This is a repository copy of
Firm Performance, Worker Commitment and Loyalty
.
White Rose Research Online URL for this paper:
http://eprints.whiterose.ac.uk/9943/
Monograph:
Brown, S., McNabb, R. and Taylor, K. (2007) Firm Performance, Worker Commitment and
Loyalty. Working Paper. Department of Economics, University of Sheffield ISSN 1749-8368
Sheffield Economic Research Paper Series 2006005
[email protected] https://eprints.whiterose.ac.uk/ Reuse
Unless indicated otherwise, fulltext items are protected by copyright with all rights reserved. The copyright exception in section 29 of the Copyright, Designs and Patents Act 1988 allows the making of a single copy solely for the purpose of non-commercial research or private study within the limits of fair dealing. The publisher or other rights-holder may allow further reproduction and re-use of this version - refer to the White Rose Research Online record for this item. Where records identify the publisher as the copyright holder, users can verify any specific terms of use on the publisher’s website.
Takedown
If you consider content in White Rose Research Online to be in breach of UK law, please notify us by
Sheffield Economic Research Paper Series
SERP Number: 2006005
Sarah Brown*, Robert McNabb and Karl Taylor*.
Firm Performance, Worker Commitment and Loyalty.
SEPTEMBER 2007.
* Department of Economics University of Sheffield 9 Mappin Street Sheffield S1 4DT
United Kingdom
Abstract:
Using matched employer-employee level data drawn from the 2004 UK Workplace and Employee Relations Survey, we explore the determinants of a measure of worker commitment and loyalty (CLI) and whether CLI influences workplace performance. Our empirical findings suggest that the employee’s industry-occupation specific relative wage is an important factor influencing employee attitudes towards the workplace. Other factors influencing employee commitment and loyalty are age and tenure, whilst workplace level characteristics of importance are: supervision; performance related pay and long term employment prospects within the workplace. With respect to the effects of employee commitment and loyalty upon the workplace, higher CLI is associated with enhanced workplace performance. This result holds for a number of robustness checks, thereby highlighting a hitherto neglected conduit for improved workplace performance. Our findings that employer characteristics influence employee commitment and loyalty suggest that workplaces may be able to exert some influence over the commitment and loyalty of its workforce, which, in turn, may affect workplace performance.
Key Words: Commitment; Financial Performance; Labour Productivity; and Loyalty JEL Classification: J20; J50
1. Introduction and Background
A large empirical literature exists which explores the determinants of organisational
performance. For example, Machin and Stewart (1990), McNabb and Whitfield
(1998) and Munday et al. (2003) examine the determinants of financial performance,
whilst Griliches and Regev (1995), Oulton (1998) and Griffiths and Simpson (2004)
focus on the determinants of labour productivity. Many such studies are based on firm
level data. One might argue, however, that, in order to understand the determinants of
firm performance, it is important to also analyse employee level information given
that the behaviour of employees and the decisions they make may influence
workplace performance. In this paper, we investigate whether the level of employee
attachment to the employer influences workplace performance using matched
employer-employee data. To be specific, we ascertain whether worker commitment
and loyalty influence labour productivity and financial performance at the firm-level.
In addition, we explore the determinants of such employee attitudes towards the
organisation for which they work in order to ascertain how such attachments may be
fostered.
The concept of organisational commitment has attracted a great deal of
interest in the human resource management and psychology literatures. For example,
employee commitment and loyalty are a central feature in the high performance
workplace literature in which they are seen as mediating factors linking different
types of human resource management and employment practices to enhanced
performance. In this context, Meyer and Allen (1991) distinguish three dimensions to
organisational commitment: affective commitment; normative commitment; and
continuance commitment. Affective commitment captures an employee’s emotional
attachment to, identification with and involvement in the organisation, whilst
organisation, i.e. an employee’s loyalty to their employer. Finally, continuance
commitment is related to an employee’s economic ties to the organisation and the
employee’s perceived costs of leaving the firm.
Meyer et al. (1993) argue that strong affective commitment to an organisation
arises because employees share values with both the organisation and its members
and is therefore predicted to have the strongest positive association with job
performance, (see also Meyer et al., 2002). With affective commitment, employees
remain with their employer because they choose to do so. Green (2007) argues that,
from an economist’s perspective, affective commitment can be regarded as a proxy
for the utility associated with working for the current employer as compared to doing
the same job with the next best employer, thereby establishing firm-specific utility.
As such, an employee’s firm-specific utility potentially plays an important role in
employee decision-making and workplace behaviour.
Since one might expect an employee’s attachment to their firm to influence
their supply of effort, which in turn may influence firm performance, it is surprising
that employee commitment and loyalty have attracted only limited attention in the
economics literature.1 This is especially so given that employees’ decisions over their
supply of effort play a key role in various incentive models of worker compensation
(for example, Lazear, 2000) as well as in the efficiency wage literature (see Akerlof,
1982; Akerlof and Yellen, 1990). In many such models, employee commitment and
loyalty play an important role in the principal-agent issues surrounding the separation
between the ownership and control of an organisation. The costs associated with
delegated decision-making clearly depend on the extent to which the interests of the
principal and agent differ (see, for example, Aghion and Tirole, 1997, and Athey and
1
Roberts, 2001). In so far as employees who exhibit commitment and loyalty to their
employer may have interests, which are aligned with that of their employer, the
agency costs often associated with the employee-employer relationship are reduced.
One attempt to construct an economic model of identity and work incentives
thus capturing such motivations, which are often missing in the standard economic
model where an individual’s preferences are fixed and primarily depend on monetary
and effort considerations, is Akerlof and Kranton (2005). Their analysis, within a
principal-agent framework, suggests that instilling in employees ‘a sense of identity
and attachment to an organisation is critical to well-functioning enterprises’.
Furthermore, the role of pay as a way to motivate employees is less important if the
employee is loyal and committed to the firm. Within the theoretical framework
proposed by Akerlof and Kranton (2005), the worker adopts an identity as part of the
organisation and his/her utility is reduced if he/she does not act in the best interests of
the organisation, thereby reducing both the wage differential (associated with reward
versus punishment) required to induce additional effort and the amount of costly
monitoring undertaken by the employer. Moreover, since identification with the firm
may lower average wages, a firm may find it profitable to create a sense of identity
and attachment, i.e. engender loyalty and commitment, amongst its workforce.
In addition, establishing a committed and loyal workforce may be associated
with enhanced firm performance and profits if the firm also benefits from less
opportunistic behaviour on the part of employees without recompense to high
incentive wages or costly levels of monitoring (Green, 2007). Furthermore, Green
(2000) argues that a firm’s human capital should be regarded as comprising social as
well as technical skills which both influence productivity. Technical skills are
regarded as the ability to convert inputs into outputs, whilst social skills are regarded
objectives. The importance of social skills in the hiring of employees is demonstrated
by the use of personality and attitude tests as well as performance or competency tests
during the hiring process (Brown and Sessions, 2006). Moreover, Green (2007)
argues that organisational commitment is a social skill as it is associated with
workplace behaviour in accordance with attaining the firm’s objectives. One would,
therefore, predict that such social skills would be positively associated with employee
effort, which, in turn, would enhance firm performance.
In so far as the degree of commitment and loyalty of employees towards their
employer is fundamentally linked to the way in which employees conduct themselves
at the workplace the economic considerations and implications are clear. A committed
and loyal workforce may require less incentive pay or supervision to supply effort to
their employer, thereby lowering employment costs and enhancing firm performance.
Given that employee commitment and loyalty clearly influence the agency
considerations, which underpin the relationship between employees and employers,
the lack of interest by economists in these important attributes of employees is
surprising especially given the vast economic literature relating to principal-agent
considerations within the workplace. In what follows, we firstly explore the
determinants of such employee attitudes at the employee level. Secondly, we explore
the implications of employee commitment and loyalty upon financial performance
and productivity at the firm level, which contrasts with the focus in the management
and psychology literature, which lies in the relationship between employee
commitment and job performance rather than firm performance.
2. Data
In order to explore the relationship between employee commitment, loyalty and firm
performance, we analyse data from the 2004 Workplace and Employee Relations
at British workplaces, the previous four surveys having been conducted in 1980,
1984, 1990 and 1998. The aim of these surveys is to provide nationally representative
data on the current state of workplace relations and employment practices in Britain,
and it is widely regarded as the principal source of information pertaining to changes
in British industrial relations [Chaplin et al. (2005)]. The survey population for the
2004 WERS is all British workplaces with at least five employees except for those in
agriculture, hunting and forestry, fishing, mining and quarrying, private households
with employed persons, and extra-territorial organisations. The sample comprises
2,295 workplaces, whilst the sample used for our econometric analysis includes 1,432
workplaces due to missing data. The 2004 WERS comprises four main sections: the
Management Questionnaire; the Worker Representative Questionnaire (which we do
not use in this paper); the Financial Performance Questionnaire; and the Employee
Questionnaire. The first three sections yield establishment level information, whilst
the final section (the Employee Questionnaire) provides employee level information.
Employee Questionnaire
Up to 25 employees from each workplace were asked to complete the Employee
Questionnaire yielding a sample of 17,008 employees after conditioning on missing
data. The Employee Questionnaire contains information on a number of measures of
employees’ attitudes towards both their job and their workplace. Two questions
capture employee commitment and loyalty. Employees are asked to indicate how
strongly they agree or disagree with each statement: (i) I share many values of my
organisation and (ii) I feel loyal to my organisation. Responses to the former yield
information pertaining to the individual’s commitment to their employer (c),2 whilst
responses to the latter indicate the level of the individual’s loyalty to their
2
organisation (l). From this information, we have constructed two five point indices
where 4 (0) represents the maximum (minimum) extent to which individuals agree
with the above statements. The indices are defined as follows:
4 4
3 3
2 / 2 /
1 1
0 0
wi wi
strongly agree (12.09%) strongly agree (20.51%)
agree (43.43%) agree (50.00%)
c neither agree disagree (32.69%) l neither agree disagr
disagree (9.21%)
strongly disagree (2.58%)
= = = = = = = = = = = = ee (19.77%) disagree (7.12%)
strongly disagree (2.60%)
where i represents the individual subscript and w denotes the workplace subscript, i.e.
wi denotes individual i employed by workplace w. The figures in parenthesis indicate
the percentage in each category.3 Arguably, employees may be unable to distinguish
between their commitment and their loyalty to the organisation, so following Green
(2007), we adopt a hybrid combination of the two questions by generating an additive
scale based upon Cronbach’s alpha ranging from 0 to 4, where the scale of reliability
is 0.77, which we term the commitment-loyalty index (CLI). The distribution across
categories 0 to 4 are: 1.27%; 5.15%; 21.54%; 52.31% and 19.74% respectively.4 The
first part of the empirical analysis, presented in Section 3, investigates the
determinants of CLI at the employee level. If employee loyalty and commitment
towards the workplace influence workplace performance, it is important to ascertain
which employee and workplace characteristics are associated with employee
commitment and loyalty.
3
It should be acknowledged that our analysis is based on self-reported data and the assumption that interpersonal comparisons can be made. The use of such data is becoming increasingly widespread in the economics literature and support for such data can be found in Guest (1990). In an early study, Hogan and Fleishman (1979) support the use of such data citing results from laboratory studies comparing perceived and actual effort exertion in physical activities. They report a highly significant positive correlation between actual metabolic rate and perceived effort in conducting a selection of occupational tasks.
4
Management Questionnaire
In Section 4, we conduct workplace level analysis in order to explore the determinants
of labour productivity, financial performance and profits per employee at the
workplace. The labour productivity and financial performance measures are derived
from the following question included in the Management Questionnaire: I now want
to ask you how your workplace is currently performing compared with other
establishments in the same industry. How would you assess your workplace’s (i)
financial performance and (ii) labour productivity? The management representative
was asked to indicate in which of the following categories financial performance
(FPw) and labour productivity (LPw) lay: (i) a lot better than average; (ii) better than
average; (iii) about average for the industry; (iv) below average or a lot below
average. From the responses to these questions, we constructed two four point indices
as follows:
3 3
2 2
1 1
0 0
w w
A lot better than average (11.66%) A lot better than average (6.91%)
Better than average (40.50%) Better than average (42.18%)
FP LP
About average (39.11%) About average (44.90%)
Below average (8.73%) Bel
= =
= =
= = =
=
= =
ow average (6.01%)
where w denotes the workplace subscript and the figures in parenthesis indicate the
percentage in each category.
Financial Performance Questionnaire
After completion of the Management Questionnaire based on a face to face interview,
a short Financial Performance Questionnaire was left for ‘someone responsible for
financial matters at the workplace’ to complete. This could only proceed with the
agreement of the management respondent and his/her ability and willingness to locate
a suitable respondent to the Financial Performance Questionnaire [Chaplin et al.
2,076 where 1,070 were returned. Thus, the overall response rate for the Financial
Performance Questionnaire (as a proportion of questionnaires placed) is 51.5%
[Chaplin et al. (2005)].
Notwithstanding the high attrition rate, the Financial Performance
Questionnaire includes a continuous objective measure of financial performance,
namely profits per head. There is evidence that both subjective and objective
performance measures in WERS 2004 are weakly equivalent and produce similar
results in fairly basic structural models (Forth and McNabb, 2007). Nevertheless,
differences are evident and, as concerns about the use of subjective data are
frequently raised (see, for example, Hamermesh, 2004), it is a prudent exercise to
consider both types of performance measures in the present study. After observations
with missing data have been omitted, we are left with a sub-sample of 495 workplaces
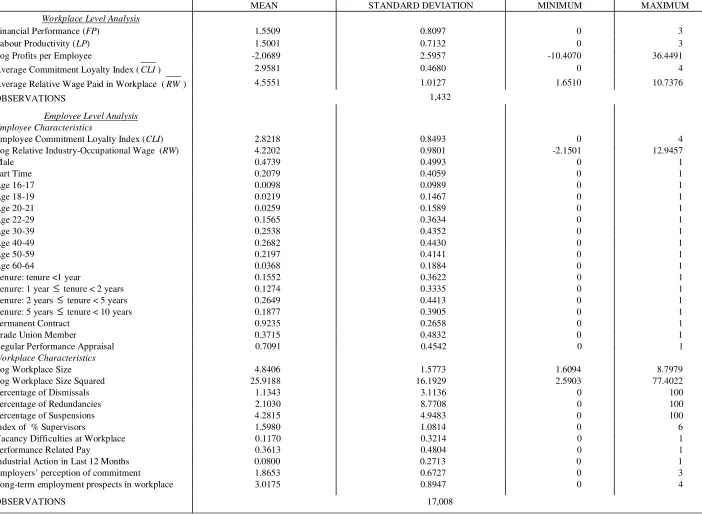
for our analysis of profits per employee.5 Summary statistics for the variables used in
our empirical analysis are presented in Table A1 in the Appendix.
3. Employee Level Analysis
3.1 Methodology
Given that employee CLI may influence workplace level performance, explored
below in Section 4, we focus initially on the determinants of employee CLI. We
conduct generalised ordered probit analysis in order to explore the correlates of CLI
allowing for clustering within establishments.5 The generalised ordered probit model
for CLI is modeled as follows:
* '
wi wi wi
CLI =λ Z +η (1)
5
The following analysis of the restricted sample of 495 workplaces is weighted making use of the weights detailed in Chaplin et al. (2005) based on the probability of workplaces taking part in WERS
2004 responding to the Financial Performance Questionnaire.
5
where CLIwi* is a latent variable denoting the unobserved propensity of individual i
employed in workplace w to be committed-loyal to workplace w; CLIwi is the
individual’s observed level of commitment-loyalty; Zwi is a vector of exogenous
characteristics, which are expected to influence CLIwi* ; λ is the associated vector of
coefficients; and ηwi is a white noise error term.
In our set of explanatory variables, we include the individual’s
industry-occupation specific relative wage since, as efficiency wage models predict, an
individual’s commitment and loyalty, as captured by CLI, to their employer may be
influenced by the individual’s wage relative to the wage prevailing in their industry
and occupation. An individual who receives low relative wages, for example, may be
less likely to form an attachment to their employer.6
Other individual characteristics we control for are: age; gender; whether the
individual is a member of a trade union; whether the employee works part-time;
whether she/he is employed on a permanent contract; whether the individual’s
performance is subject to regular appraisals; and tenure at the current workplace.
Turning to workplace characteristics, monitoring and supervision play a
prominent role in the organisational commitment literature. Hence, we include an
index of the proportion of non-managerial staff with supervisory duties based on the
responses to the following question: What proportion of non-managerial employees
here have job duties that involve supervising other employees? Although, the
supervision index serves to proxy the level of monitoring, it should be acknowledged
6
that problems obtaining accurate measures of monitoring are well-documented. For
example, Drago and Perlman (1989) note that supervision may occur for
non-monitoring purposes such as to co-ordinate production. Alternatively, the number of
supervisors might be high because monitoring is difficult (Allgulin and Ellingsen,
2002) or supervisors may only spend a fraction of their work time monitoring
(Rebitzer, 1995). Despite such problems, the relative paucity of data compels us to
rely on the proxy defined above. The inclusion of the dummy variable that equals one
if the individual’s performance is regularly subject to appraisal represents an
alternative control for monitoring.
We also control for the number of dismissals, redundancies and suspensions at
the workplace as a percentage of total employment within the workplace, which are
expected to have a negative impact on commitment and loyalty. In addition, a dummy
variable is included indicating whether the establishment has experienced difficulties
filling vacancies for the individual’s occupation. Employee level workplace tenure
acts as a control for organisation specific human capital, which may make it costly to
leave the organisation and, hence, may serve to engender attachment to the firm. In a
similar vein, we include a five point index denoting the extent managers agree with
the statement: Employees are led to expect long-term employment in this
organisation. The highest value of the index (4) indicates that managers strongly
agree with the statement; a value of 3 denotes that they agree with the statement; a
value of 2 indicates that they neither agree nor disagree; a value of 1 denotes that they
disagree; finally, a value of 0 indicates that they strongly disagree.
Other workplace characteristics we control for include workplace size and a
binary control indicating whether industrial action has been taken in the last twelve
months at the workplace. It may be the case that the level of worker loyalty and
and the overall unrest is high. In addition, we control for the employer’s perception of
employee commitment. To be specific, we include a four point index indicating the
extent to which managers agree with the following statement: Employees here are
fully committed to the values of this organisation. The index takes the highest value
(3) if the manager strongly agrees with the statement; a value of 2 if the manager
agrees with the statement; a value of 1 if the manager neither agrees nor disagrees
with the statement; and a value of 0 if the manager disagrees with the statement.
Hence, the index is increasing in the manager’s perception of employee commitment.
Finally, in order to explore alternative strategies that employers may adopt to
encourage employee allegiance, we control for the presence of performance related
pay and employee share ownership schemes at the workplace for the employee’s
occupation. Also incorporated into the vector of control variables is workplace
performance, since arguably high performance firms might inspire greater levels of
CLI – this issue is further discussed in Section 4.3.
3.2 Results
The results of estimating equation (1) are presented in Table 1 where we focus on the
marginal effects for each category from the lowest through to the highest level, i.e.
categories 0 to 4, where the two extreme categories denote ‘strongly disagree’ and
‘strongly agree’ respectively.7 Panels A to C incorporate alternative measures of
workplace performance as control variables, where the full regression results are
presented in Panel A with labour productivity included as a control variable, whilst in
Panels B and C, for brevity, the regression results are summarised with financial
7
performance and profits per employee included to control for workplace performance,
respectively.8
With respect to the individual’s relative wage, a one per cent increase in the
log relative wage increases the probability that the individual reports the highest
category for CLI by 2.7 percentage points, see Table 1 Panel A. Our empirical
findings suggest that comparisons between an employee’s wage and that of a
particular reference group are significant determinants of worker commitment and
loyalty to the workplace, which is consistent with efficiency wage theory, although
the magnitude of the implied relationship is moderate.9
Employee characteristics, specifically age and gender, play the largest role in
terms of the magnitude of the marginal effects across the CLI thresholds. Turning to
other employee characteristics, the length of time with the current employer is also
significantly associated with CLI. The effects of tenure at the workplace indicate that
individuals with shorter tenure are less committed and loyal relative to the reference
category of being employed for more than 10 years at the same workplace. This may
be because such individuals have not acquired high levels of workplace specific
human capital, which may make leaving the workplace less costly. Alternatively, it
may simply be that people who do not generate feelings of commitment and loyalty
are more likely to quit their jobs. Part time employees are also less likely to harbour
high levels of CLI.
Turning to workplace characteristics, the proportion of workers with
supervisory duties is significantly associated with CLI. Specifically, the level of
supervision decreases (increases) the probability that the individual is in the lowest
8
We have also estimated equation (1) via a random effects ordered probit specification where the results are largely in line with those reported in Table 1.
9
The distribution of the employee’s wage relative to the industry-occupation specific wage in WERS
(highest) categories of CLI. There is also some evidence that performance related pay
has a degree of influence upon employee commitment and loyalty. Long term
employment prospects within the workplace have a monotonic positive influence
upon engendering higher levels of CLI: at the mean of the index of long term
employment prospects, the probability that the individual reports the highest category
of CLI is around 2 percentage points. Interestingly, there are no statistically
significant effects from the percentage of dismissals or suspensions, industrial action
or employee share ownership at the workplace.
Trade union membership is found to lower the probability that an employee
will respond in the top categories of CLI. This finding is consistent with the literature
on unions and absenteeism (Chaudhury and Ng, 1992 and Leigh, 1981; 1985), which
shows that union members go absent more often than non-union employees. One
possible explanation for such a finding is that union members may have a stronger
sense of security at work.
Having ascertained which employee and employer characteristics engender
employee commitment and loyalty to the workplace, the following analysis
investigates whether the average level of employee CLI within the workplace
influences workplace performance.
4. Workplace Performance
4.1 Methodology
The following workplace performance models are estimated where the average level
of the employee commitment-loyalty index (CLI) within the workplace, CLIw, is
included in the set of explanatory variables:
*
1 1
' w
w w w
LP =β X +γ CLI +ν (2)
*
2 2
' w
w w w
3 3
' w
w θ Xw γ CLI ν w
Π = + + (4)
where LPw* and FPw* represent two latent variables denoting the unobserved
propensity of workplace w to achieve a certain level of labour productivity and
financial performance respectively in terms of the subjective measures of
performance; Πw represents profits per employee, the objective measure of
performance; X w is a vector of workplace characteristics expected to influence FPw*,
* w
LP and Πw ; β, ϕ, θ, γ1, γ2 and γ3 are the associated vectors of coefficients; and
jw
ν (j=1,2,3) are random error terms. Thus, the estimated coefficients of CLI w
indicate the nature of the relationship between average employee CLI within the
workplace and the measures of workplace performance.10 Equations (2) and (3) are
estimated via a generalised ordered probit specification over the sample of 1,432
workplaces, whilst equation (4) is estimated by ordinary least squares (OLS) over the
sample of 495 workplaces.
The vector of explanatory variables, Xw, is based on the existing literature
and includes: quadratics in workplace size and workplace age; controls for whether
the firm is foreign owned or a UK multinational; industrial affiliation; controls for the
presence of performance related pay or employee share ownership at the workplace;
the average industry-occupation specific relative wage in the workplace (as defined in
Section 3) denoted by RW ; a dummy indicator for whether there is a recognised
trade union at the workplace; a public sector dummy variable;11 and the percentages
10
We have also investigated incorporating commitment and loyalty simultaneously as two separate measures: only commitment was statistically significant. However, if entered separately, both commitment and loyalty were found to be significantly associated with workplace performance. These results are available from the authors upon request. This suggests that employees may not be able to discern the difference between the two survey questions and, hence, supports the use of a hybrid measure.
11
of unskilled, female and ethnic minority employees in the workplace. As a proxy for
the relative importance of labour costs within the workplace, we also include a four
point index indicating the percentage of the workplace’s sales revenue or operating
costs, accounted for by wages, salaries and other labour costs such as pensions and
insurance.12
4.2 Results
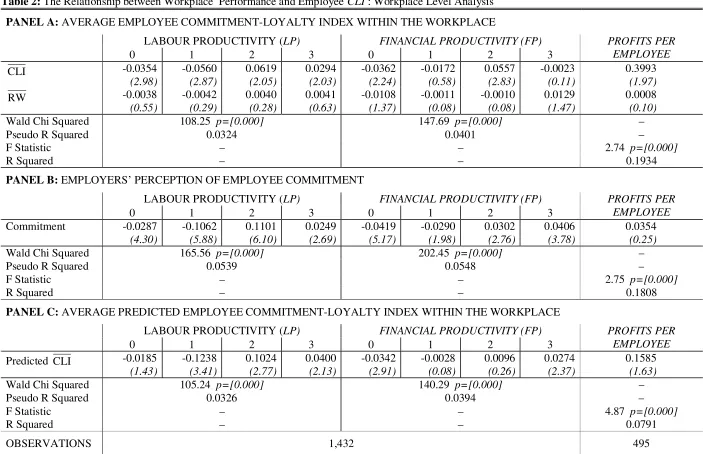
Table 2 presents the results of estimating the relationship between workplace
performance and CLI , with the results of estimating equations (2), (3) and (4)
summarised in Panel A. It is apparent from Panel A that, for our sample of 1,432
workplaces, employee CLI is positively associated with higher levels of the three
measures of workplace performance.13 Due to the ordered nature of the labour
productivity and financial performance indices, we focus on the marginal effects for
each category, lowest through to highest, i.e. categories 0 to 3, where the two extreme
categories denote ‘below average’ and ‘a lot above average’, respectively.
With respect to labour productivity,LPw, shown in the first column of Table 2,
the marginal effects presented in Panel A indicate that CLI is associated with a
decrease (an increase) in the probability that workplace labour productivity is ‘below
average’ (‘a lot above average’). Indeed, evaluated at the sample means, the
workplaces are in the public sector, hence excluding such workplaces significantly reduces our sample size, particularly in the case of the continuous measure of financial performance. Moreover, substantial variation exists in the mean level of each measure of performance within the public sector where the standard deviations for labour productivity, financial performance and profits per employee are: 0.667, 0.729 and 2.137 respectively (for comparison see Table A1 in the Appendix for the overall sample).
12
In terms of the labour cost index, a value of zero denotes less than 25%; one denotes 25% to 50%; two denotes 50% to 75%; and three denotes 75% or more. The index indicating the proportion of sales revenue or operating costs accounted for by labour costs enables us to proxy the importance of labour costs relative to the costs of other factor inputs.
13
magnitude of the effects of the employee commitment-loyalty index are 9 and 8
percentage points at the two extremes of the index respectively.15 We replicate the
above analysis focusing on the alternative subjective measure of workplace
performance – financial performance (FPw) in the second major column of Table 2.
The results are consistent with those found for labour productivity in that higher
levels of CLI are associated with a decrease in the probability of financial
performance being ‘below average’. Evaluated at the sample mean, the largest effect
of CLI serves to increase the probability that workplace financial performance is
‘above average’ by 15 percentage points. The final column of Table 2, which focuses
upon a sub-sample of 495 workplaces reporting profits per employee, again reveals a
positive association between workplace performance and employee commitment and
loyalty.
In order to explore the robustness of our findings, we replace CLI with the
four point index of the level of employee commitment perceived by the manager
taken from the Management Questionnaire as defined in Section 3. The results are
shown in Panel B of Table 2 and reveal a positive association between higher
employee commitment as perceived by the manager and workplace performance,
although the effect on the continuous measure of profits per employee is insignificant.
To summarise, our workplace results thus far suggest that employee
commitment and loyalty are positively related to higher levels of labour productivity
and financial performance at the workplace. Moreover, the magnitudes of the
15
estimated effects suggest that worker attachment to the organisation is an important
conduit for improved performance.14
4.3 Robustness
In this sub-section we further consider the robustness of the estimated relationship
between CLI and workplace performance. First, we investigate the possibility of
reverse causality between CLI and performance, i.e. the potential for high
performance organisations to engender greater levels of CLI, by employing an
instrumental variables approach. Secondly, we make use of the panel element of
WERS, which enables us to analyse the change in workplace performance over the
period 1998 to 2004 and how this is influenced by CLI in 1998 arguably enabling a
causal hypothesis to be tested. Finally, the potential simultaneity between the relative
wage and CLI is explored, in that relative wages may also directly influence
workplace performance as well as having an indirect effect via workers’ commitment
and loyalty to the organisation.
Reverse causality between CLI and workplace performance
Initially, we explore reverse causality by instrumenting CLI, based upon the analysis
presented in Section 3 above. To be specific, in the performance equations, i.e.
equations (2), (3) and (4), we replace CLI , i.e. the average exogenous CLI for each
workplace, with the average predicted CLI for each workplace, where predicted CLI
14
is based on the employee level specifications presented in Table 1, i.e. equation (1).
Thus, employee characteristics are incorporated into the employee level CLI model as
well as workplace level control variables. This is an advantageous approach in that it
may alleviate potential bias due to unobserved heterogeneity, which might affect both
sides of the regression equation, i.e. CLI and the workplace performance measures,
Green (2007). Moreover, as can be seen from the results presented in Section 3, we
also condition CLI upon workplace performance. The results shown in Table 1
suggest that performance measured by either of the subjective measures, labour
productivity (Panel A) and financial performance (Panel B), or the objective measure
of performance profits per employee (Panel C), does not have a significant impact
upon CLI. Such findings suggest that workplace performance is not a statistically
significant determinant of employee CLI.
We then re-estimate equations (2), (3) and (4) replacing CLI with the average
predicted CLI for each workplace. The analysis based upon the predicted or
instrumented CLI shown in Table 2 Panel C reveals a positive association between
employee commitment and loyalty and the measures of performance. There is a
significant effect for average predicted CLI at both extremes of the subjective
measures, but not upon profits per employee.15 Indeed, evaluated at the sample mean,
the magnitude of the effects of average predicted CLI upon the probability that the
workplace experiences labour productivity ‘above average’ is 8 percentage points,
similar in magnitude to that found in Section 4.2. The finding that none of the three
15
measures of workplace performance affect CLI in the employee level analysis and that
average predicted CLI influences performance is in accordance with a causal effect.16
CLI and the change in workplace performance
We explore the issue of causality between workplace performance and CLI in an
alternative manner by making use of the panel element within WERS. We analyse a
subset of workplaces interviewed in both 1998 and 2004: there are 522 workplaces in
both waves with information on the key variables in question. To be specific, we
explore the effect of CLI measured in 1998 upon the change in financial performance
between 1998 and 2004, denoted by ∆FPERw,2004. Arguably, any significant
association between these variables is evidence of CLI influencing workplace
performance rather than workplace performance influencing CLI . Information on
financial performance in the panel aspect of WERS is only available as a subjective
measure defined by an ordered variable as: 0 if the change in financial performance is
below the industry average; 1 if the change in financial performance is equal to the
industry average; and 2 if the change in financial performance is above the industry
average. The following model is estimated as a generalised ordered probit where we
condition upon variables measured in 1998:17
,1998
,2004 ' ,1998 w
w w w
FPER α X γCLI υ
∆ = + + (5)
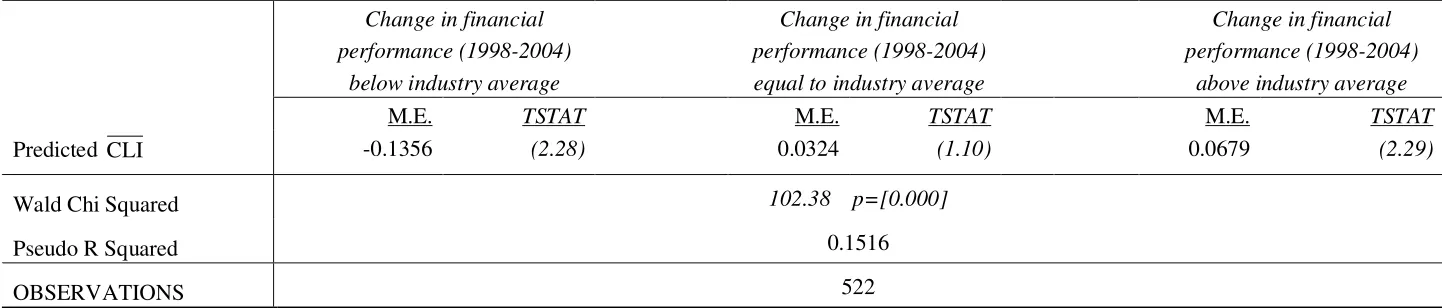
The results of estimating equation (5) are presented in Table 3 Panel A and reveal
that, based upon the sample means, CLI decreases the probability that the workplace
16
We have also explored an alternative modelling strategy, which entails joint modelling of average commitment and loyalty at the workplace and performance. To be specific, we adopt a bivariate probit model where one binary dependent variable equals 1 if the average CLI is in the highest two categories and the second binary dependent variable takes the value of 1 if the subjective performance measure (either labour productivity or financial performance) lies in one of the highest two categories. For the case of the continuous measure of performance, we adopt a two stage probit least squares estimator. Our findings are in accordance with the results in Table 2 Panel C with the positive effect of employee commitment and loyalty on performance prevailing with the joint estimation procedure.
17
experiences a change in financial performance below (above) the industry average in
the region of 38 (11) percentage points. As a further robustness check, we also
instrument CLI in 1998, based upon the specification of control variables used in
Section 3 above – but measured in 1998. The results shown in Table 3 Panel B reveal
that the relationship between average predicted CLI in 1998 and workplace
performance remains after instrumentation.
Reverse causality between CLI and relative wages
Our final robustness check focuses on the possible simultaneity between relative
wages and workplace performance. Arguably, it is possible that higher levels of
performance might lead to higher wages, which might also influence the relative
wage, akin to rent sharing arguments (Blanchflower et al., 1996). To consider whether
relative wages influence workplace performance in estimating equations (2), (3) and
(4), the average workplace relative wage ( RW ) was incorporated into the financial
performance models. The marginal effects associated with the relative wage ( RW )
are shown in Table 2 Panel A. For each measure of financial performance, there is no
significant direct relationship between the average relative wage and workplace
performance, only an indirect influence operating through CLI as is evident from the
analysis presented in Section 3, i.e. the positive relationship between the relative
industry-occupation wage and CLI.
To investigate the possible simultaneity between average relative wages and
workplace performance, we undertake a simultaneous modeling approach.
Specifically we adopt a two-stage probit least squares estimator as follows:
* '
w
w w w
F =µ X +θRW +v
*
' w
w w w
where the average relative wage across employees within the workplace, RWw, is
modeled as a continuous variable, whilst workplace performance (either labour
productivity or workplace financial performance) is treated as a binary variable which
takes the value of one if the workplace has performance “above average” or “a lot
above average”. The estimates derived from this framework are consistent and have
corrected standard errors (see Maddala, 1983). The explanatory variables in vector
w
H include controls averaged across employees within the workplace: tenure at the
current workplace, part-time employment, permanent contract, trade union
membership, gender, marital status, ethnicity and highest educational qualification.18
In the case of financial performance measured by profits per employee, which is a
continuous variable, a standard two stage least squared approach is adopted. Under a
rent-sharing type argument, we might expect φ to be positive and significant.
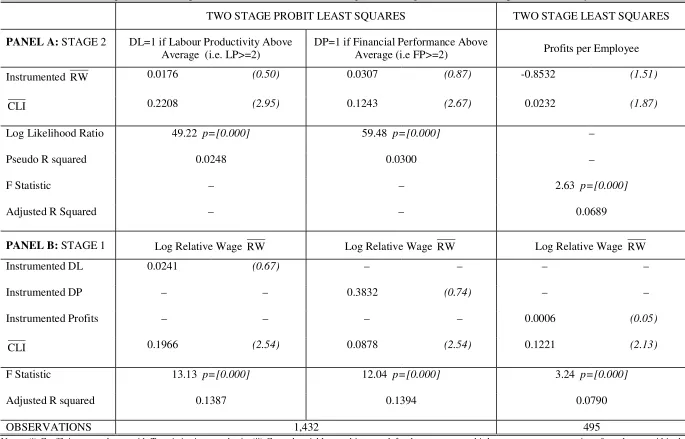
The results are presented in Table 4, where the first two columns show the
results of estimating equation (6) for labour productivity and financial performance
respectively. Table 4 is split into two panels with Panel A reporting the results of the
effect of instrumented relative wages and CLI upon workplace performance and Panel
B reporting the effects of instrumented financial performance upon the relative wage.
Clearly, across the subjective measures of workplace performance, when estimated
simultaneously, the average relative wage within the workplace has no significant
impact upon workplace performance. This finding accords with that reported in Table
2 Panel A where the relative wage was treated as an exogenous variable. Similarly, as
shown in Table 4 Panel B, the three instrumented measures of financial performance
have no impact upon the average relative wage within the workplace. In the final
column of Table 4, for the subset of 495 workplaces with information on profits per
18
employee, when estimating this measure of workplace performance simultaneously
with the relative wages by two stage least squares, there is no significant impact of
relative wages (workplace performance) upon workplace performance (relative
wages). Thus, it would appear that there is no direct simultaneity between workplace
performance and relative wages. Our findings suggest that relative wages only have
an indirect influence upon workplace performance operating through commitment and
loyalty, i.e. CLI, which is contradictory to a rent sharing argument but consistent with
efficiency wage theory.
5. Conclusion
In this paper we have analysed matched employer-employee data in order to explore
the influence of employee commitment and loyalty on workplace performance. Our
empirical findings suggest that employee commitment and loyalty are positively
associated with higher levels of workplace performance. Arguably, it is thus in an
establishment’s interest to foster such attachments. Hence, our empirical analysis
highlights a potential avenue for productivity and financial gains at the establishment
level, which has been somewhat neglected in the economics literature. Moreover, our
employee level analysis of the determinants of employee attitudes suggests not only a
role for worker characteristics, but also for workplace characteristics (such as
supervision, performance related pay and long term prospects of employment) in
influencing such attachments. Such findings suggest that establishments may be able
to exert some control over the loyalty and commitment of its workforce, which, in
References
AGHION, P. AND TIROLE, J. (1997) ‘Formal and Real Authority in Organizations’,
Journal of Political Economy, 105(1), 1-29.
AKERLOF, G. (1982) ‘Labor Contracts as a Partial Gift Exchange’, Quarterly
Journal of Economics, 97, 543-569.
AKERLOF, G AND YELLEN, J. (1990) ‘The Fair Wage-Effort Hypothesis and
Unemployment’, Quarterly Journal of Economics, 105, 255-283.
AKERLOF, G. A. AND KRANTON, R. E. (2000) ‘Economics and Identity’,
Quarterly Journal of Economics, 105(2), 255-283.
AKERLOF, G. A. AND KRANTON, R. E. (2005) ‘Identity and the Economics of
Organizations’, Journal of Economic Perspectives, 19(1), 9-32.
ALLGULIN, M. and ELLINGSEN, T. (2002) ‘Monitoring and Pay.’ Journal of
Labor Economics, 20(2), 201-216.
ATHEY, S. AND ROBERTS, J. (2001) ‘Organizational Design: Decision Rights and
Incentive Contracts’, American Economic Review, 91(2), 200-205.
BLANCHFLOWER, D., OSWALD, A. AND SANFREY, P. (1996) ‘Wages, Profits
and Rent Sharing’, Quarterly Journal of Economics,111, 227-252.
BROWN, S. AND SESSIONS, J. G. (2006) ‘Evidence on the Relationship Between
Firm-Based Screening, Education, and Earnings’, Economics of Education
BUCHANAN, B. (1974) ‘Building Organizational Commitment: The Socialization of
Managers in Work Organizations’, Administrative Science Quarterly, 19,
533-546.
CHAPLIN, J. MANGLA, J., PURDON, S. AND AIREY, C. (2005) ‘The Workplace
Employment Relations (WERS) 2004 Technical Report (Cross-Section and
Panel Surveys)’, Department of Trade and Industry, November 2005.
CHAUDHURY, M. and NG, I. (1992) ‘Absenteeism Predictors: Least Squares, Rank
Regression and Model Selection Results’, Canadian Journal of Economics,
25, 615-635.
DRAGO, R. and PERLMAN, R. (1989) ‘Supervision and High Wages as Competing
Incentives: A Basis for Labour Market Segmentation Theory’, in
Microeconomic Issues in Labour Economics, R. Drago and R. Perlman
(Editors), Harvester Wheatsheaf, London.
FORTH, J. and McNabb, R. (2007) ‘Workplace Performance: A Comparison of
Subjective and Objective Measures in the 2004 Workplace Employment
Relations Survey’, Industrial Relations Journal,(forthcoming).
GREEN, F. (2000) ‘The Impact of Company Human Resource Policies on Social Skills:
Implications for Training Sponsorship, Quit Rates and Efficiency Wages’,
Scottish Journal of Political Economy, 47(3), 251-272.
GREEN, F. (2007) ‘Leeway for the Loyal: A Model of Employee Discretion’,
Manpower Human resources Lab Working Paper: MHRLdp002, Centre for
Economic Performance, London School of Economics and Political Science.
GREENE, W.H. (2003) Econometric Analysis. Fifth Edition, MacMillan.
GRILICHES, Z. and REGEV, H. (1995) ‘Firm Productivity in Israeli Industry:
1979-1988’, Journal of Econometrics, 65(1), 175-203.
GRIFFITH, R. and SIMPSON, H. (2004) ‘Characteristics of Foreign-Owned Firms in
British Manufacturing’, in Creating A Premier League Economy, R. Blundell,
GUEST, D. E. (1990) ‘Have British Workers Been Working Harder in Thatcher’s
Britain? A Re-Consideration of the Concept of Effort’, British Journal of
Industrial Relations, 28, 293-312.
HAMERMESH, D. (2004) ‘Subjective Outcomes in Economics’, Southern Economic
Journal, 71, 2-11.
HOGAN, J. C. and FLEISHMAN, E. A. (1979) ‘An Index of the Physical Effort
Required in Human Task Performance’, Journal of Applied Psychology, 64,
197-204.
KANDEL, E. AND LAZEAR, E. P. (1992) ‘Peer Pressure and Partnerships’ Journal
of Political Economy, 100(4), 801-817.
LAZEAR, E. P. (1991) ‘Labor Economics and the Psychology of Organizations’
Journal of Economic Perspectives, 5(2), 89-110.
LAZEAR, E. P. (2000) ‘Performance Pay and Productivity’, American Economic
Review, 90(5), 1346-1361.
LEIGH, J. P. (1981) ‘The Effects of Union Membership on Absence from Work due
to Illness’, Journal of Labor Research, 2, 329-336.
LEIGH, J. P. (1985) ‘The Effects of Unemployment and the Business Cycle on
Absenteeism’, Journal of Economics and Business, 37, 159-170.
MADDALA, G.S. (1983) ‘Limited Dependent and Qualitative Variables in
Econometrics’, Econometric Society Monographs Number 3, Cambridge
University Press.
MACHIN, S. AND STEWART, M. (1990) ‘Unions and Financial Performance of
British Private Sector Establishments’, Journal of Applied Econometrics, 5,
327-350.
McNABB, R. AND WHITFIELD, K. (1998) ‘The Impact of Financial Participation
and Employee Involvement on Financial Performance’, Scottish Journal of
Political Economy, 45, 171-187.
Organizational Commitment’, Human Resource Management Review, 1,
61-89.
MEYER, J.P., ALLEN, N. J. AND SMITH, C.A. (1993) ‘Commitment to
Organizations and Occupations: Extension and Test of a Three Component
Conceptualization’, Journal of Applied Psychology, 78, 538-551.
MEYER, J. P., STANLEY, D. J., HERSCOVITCH, L. AND TOPOLNYTSKY, L.
(2002) ‘Affective, Continuance, and Normative Commitment to the
Organization: A Meta-Analysis of Antecedents, Correlates, and
Consequences’, Journal of Vocational Behavior, 61, 20-52.
MUNDAY, M., PEEL, M. AND TAYLOR, K. (2003) ‘The Performance of the
Foreign-Owned Sector of UK Manufacturing: Some Evidence and
Implications for UK Inward Investment Policy’, Fiscal Studies, 24, 501-521.
OULTON, N. (1998) ‘Competition and the Dispersion of Labour Productivity
amongst UK Companies’, Oxford Economic Papers, 50(1), 23-38.
PRENDERGAST, C. J. (1995) ‘A Theory of Responsibility in Organizations’,
Journal of Labor Economics, 13(3), 387-400.
REBITZER, J. B. (1995) ‘Is there a Trade-off between Supervision and Wages? An
Empirical Test of Efficiency Wage Theory’, Journal of Economic Behavior
Table 1: The Determinants of Employee Commitment and Loyalty: Employee Level Analysis
PANEL A: SUBJECTIVE MEASURE OF WORKPLACE PERFORMANCE – LABOUR PRODUCTIVITY
CLI=0: Strongly Disagree
CLI=1: Disagree CLI=2: Neither Agree/Disagree
CLI=3: Agree CLI=4: Strongly Agree
Employee Characteristics M.E. TSTAT M.E. TSTAT M.E. TSTAT M.E. TSTAT M.E. TSTAT
Log Relative Wage (RW) -0.0009 (1.15) -0.0044 (2.28) -0.0267 (7.10) 0.0053 (2.20) 0.0267 (7.60)
Male 0.0092 (4.87) 0.0195 (5.41) 0.0321 (4.27) -0.0421 (4.97) -0.0187 (2.59)
Part Time 0.0005 (0.23) -0.0027 (0.58) 0.0202 (2.13) 0.0282 (2.66) -0.0463 (6.01)
Age 16-17 0.8471 (12.05) -0.7194 (7.11) 0.2077 (2.38) -0.2097 (2.90) -0.1257 (2.59)
Age 18-19 0.8506 (19.11) -0.7346 (8.69) 0.2923 (3.72) -0.2617 (4.20) -0.1466 (5.85)
Age 20-21 0.8793 (25.38) -0.7380 (8.43) 0.2717 (3.26) -0.2688 (4.49) -0.1442 (10.05)
Age 22-29 0.7551 (21.17) -0.6022 (7.43) 0.2384 (3.23) -0.2459 (4.10) -0.1453 (9.32)
Age 30-39 0.5971 (14.68) -0.4996 (7.51) 0.2427 (3.83) -0.2177 (3.62) -0.1224 (7.09)
Age 40-49 0.6207 (15.43) -0.5286 (8.16) 0.2114 (3.40) -0.1966 (3.25) -0.1069 (4.62)
Age 50-59 0.6400 (14.95) -0.5541 (8.18) 0.2076 (3.24) -0.1979 (3.22) -0.0956 (3.83)
Age 60-64 0.8054 (17.67) -0.7305 (9.01) 0.1233 (1.74) -0.1383 (2.07) -0.0599 (3.52)
Tenure: tenure <1 year 0.0013 (0.38) 0.0262 (5.30) 0.0393 (3.61) -0.0340 (2.46) -0.0303 (2.52)
Tenure: 1 year ≤ tenure < 2 years 0.0024 (0.69) 0.0193 (3.74) 0.0258 (2.31) -0.0391 (2.80) -0.0037 (0.32)
Tenure: 2 years ≤ tenure < 5 years 0.0023 (0.90) -0.0140 (3.08) -0.0112 (1.24) 0.0112 (1.01) 0.0117 (1.28)
Tenure: 5 years ≤ tenure < 10 years -0.0011 (0.49) -0.0067 (1.41) -0.0029 (0.29) 0.0168 (1.40) -0.0062 (0.64)
Permanent Contract -0.0003 (0.12) -0.0094 (1.34) -0.0017 (0.13) 0.0034 (0.21) 0.0080 (0.66)
Trade Union Member 0.0055 (2.78) 0.0175 (4.19) 0.0235 (3.07) -0.0197 (2.31) -0.0269 (3.65)
Regular Performance Appraisal -0.0014 (0.81) -0.0051 (1.24) 0.0003 (0.04) 0.0089 (0.99) -0.0028 (0.32)
Workplace Characteristics
Log Workplace Size -0.0003 (0.10) 0.0062 (0.92) 0.0319 (2.48) 0.0090 (0.61) -0.0467 (3.58)
Log Workplace Size Squared 0.0001 (0.17) -0.0005 (0.80) -0.0027 (2.15) 0.0001 (0.03) 0.0031 (2.44)
Percentage of Dismissals 0.0001 (0.17) 0.0008 (1.55) 0.0004 (0.31) -0.0007 (0.64) -0.0005 (0.60)
Percentage of Redundancies 0.0001 (1.67) 0.0009 (5.10) 0.0013 (2.19) -0.0011 (2.47) -0.0012 (2.57)
Percentage of Suspensions 0.0001 (0.03) 0.0069 (1.57) -0.0049 (0.51) -0.0002 (0.02) -0.0019 (0.21)
Index of % Supervisors -0.0021 (2.90) -0.0043 (2.43) -0.0031 (0.88) 0.0005 (0.12) 0.0091 (2.61)
Vacancy Difficulties at Workplace 0.0023 (0.83) -0.0014 (0.24) 0.0219 (1.68) -0.0163 (1.08) -0.0065 (0.53)
Performance Related Pay -0.0036 (2.31) 0.0051 (1.29) -0.0072 (0.89) 0.0117 (2.34) -0.0059 (0.73)
Industrial Action in Last 12 Months -0.0034 (1.43) 0.0053 (0.71) 0.0106 (0.70) -0.0088 (0.51) -0.0038 (0.22)
Employers’ perception of commitment -0.0054 (4.57) -0.0186 (5.90) -0.0556 (8.86) 0.0218 (3.22) 0.0578 (9.11)
Long-term employment prospects in workplace -0.0001 (1.91) -0.0035 (1.73) 0.0017 (0.37) 0.0037 (1.93) 0.0081 (2.82)
Labour productivity -0.0003 (0.27) -0.0044 (1.67) -0.0078 (1.38) -0.0001 (0.01) 0.0126 (1.16)
Table 1 (Continued): The Determinants of Employee Commitment and Loyalty: Employee Level Analysis
PANEL B: SUBJECTIVE MEASURE OF WORKPLACE PERFORMANCE – FINANCIAL PERFORMANCE
CLI=0: Strongly Disagree CLI=1: Disagree CLI=2: Neither Agree/Disagree
CLI=3: Agree CLI=4: Strongly Agree
M.E. TSTAT M.E. TSTAT M.E. TSTAT M.E. TSTAT M.E. TSTAT
Log Relative Wage (RW) -0.0008 (1.14) -0.0044 (2.28) -0.0266 (7.08) 0.0051 (2.16) 0.0267 (7.61)
Workplace Financial Performance
-0.0005 (0.58) -0.0009 (0.40) -0.0098 (2.12) 0.0029 (0.57) 0.0084 (1.63)
Controls As in Table 1 Panel A
Chi Squared 2,245.93 p=[0.000]
OBSERVATIONS 17,008
PANEL C: OBJECTIVE MEASURE OF WORKPLACE PERFORMANCE – LOG PROFITS PER EMPLOYEE
CLI=0: Strongly Disagree CLI=1: Disagree CLI=2: Neither Agree/Disagree
CLI=3: Agree CLI=4: Strongly Agree
M.E. TSTAT M.E. TSTAT M.E. TSTAT M.E. TSTAT M.E. TSTAT
Log Relative Wage (RW) 0.0009 (0.16) -0.0018 (0.58) -0.0302 (5.12) 0.0071 (1.99) 0.0249 (4.38)
Log Profits per Employee -0.0001 (0.27) 0.0002 (0.16) -0.0024 (0.84) -0.0018 (0.73) 0.0041 (1.13)
Controls As in Table 1 Panel A
Chi Squared 615.60 p=[0.000]
OBSERVATIONS 6,681
Table 2: The Relationship between Workplace Performance and Employee CLI : Workplace Level Analysis
PANEL A: AVERAGE EMPLOYEE COMMITMENT-LOYALTY INDEX WITHIN THE WORKPLACE
LABOUR PRODUCTIVITY (LP) FINANCIAL PRODUCTIVITY (FP)
0 1 2 3 0 1 2 3
PROFITS PER EMPLOYEE
CLI -0.0354
(2.98) -0.0560 (2.87) 0.0619 (2.05) 0.0294 (2.03) -0.0362 (2.24) -0.0172 (0.58) 0.0557 (2.83) -0.0023 (0.11) 0.3993 (1.97)
RW -0.0038
(0.55) -0.0042 (0.29) 0.0040 (0.28) 0.0041 (0.63) -0.0108 (1.37) -0.0011 (0.08) -0.0010 (0.08) 0.0129 (1.47) 0.0008 (0.10)
Wald Chi Squared 108.25 p=[0.000] 147.69 p=[0.000] –
Pseudo R Squared 0.0324 0.0401 –
F Statistic – – 2.74 p=[0.000]
R Squared – – 0.1934
PANEL B: EMPLOYERS’ PERCEPTION OF EMPLOYEE COMMITMENT
LABOUR PRODUCTIVITY (LP) FINANCIAL PRODUCTIVITY (FP)
0 1 2 3 0 1 2 3
PROFITS PER EMPLOYEE Commitment -0.0287
(4.30) -0.1062 (5.88) 0.1101 (6.10) 0.0249 (2.69) -0.0419 (5.17) -0.0290 (1.98) 0.0302 (2.76) 0.0406 (3.78) 0.0354 (0.25)
Wald Chi Squared 165.56 p=[0.000] 202.45 p=[0.000] –
Pseudo R Squared 0.0539 0.0548 –
F Statistic – – 2.75 p=[0.000]
R Squared – – 0.1808
PANEL C: AVERAGE PREDICTED EMPLOYEE COMMITMENT-LOYALTY INDEX WITHIN THE WORKPLACE
LABOUR PRODUCTIVITY (LP) FINANCIAL PRODUCTIVITY (FP)
0 1 2 3 0 1 2 3
PROFITS PER EMPLOYEE
Predicted CLI -0.0185 (1.43) -0.1238 (3.41) 0.1024 (2.77) 0.0400 (2.13) -0.0342 (2.91) -0.0028 (0.08) 0.0096 (0.26) 0.0274 (2.37) 0.1585 (1.63)
Wald Chi Squared 105.24 p=[0.000] 140.29 p=[0.000] –
Pseudo R Squared 0.0326 0.0394 –
F Statistic – – 4.87 p=[0.000]
R Squared – – 0.0791
OBSERVATIONS 1,432 495
Table 3: The Relationship between the Change in Financial Performance over 1998 to 2004 and CLI: Workplace Level Panel Analysis
PANEL A: AVERAGE EMPLOYEE COMMITMENT-LOYALTY INDEX WITHIN THE WORKPLACE MEASURED IN 1998
Change in financial performance (1998-2004)
below industry average
Change in financial performance (1998-2004) equal to industry average
Change in financial performance (1998-2004)
above industry average
M.E. TSTAT M.E. TSTAT M.E. TSTAT
CLI -0.1320 (2.04) 0.0962 (1.46) 0.0358 (2.60)
Wald Chi Squared 103.71 p=[0.000]
Pseudo R Squared 0.1506
PANEL B: AVERAGE PREDICTED EMPLOYEE COMMITMENT-LOYALTY INDEX WITHIN THE WORKPLACE MEASURED IN 1998
Change in financial performance (1998-2004)
below industry average
Change in financial performance (1998-2004) equal to industry average
Change in financial performance (1998-2004)
above industry average
M.E. TSTAT M.E. TSTAT M.E. TSTAT
Predicted CLI -0.1356 (2.28) 0.0324 (1.10) 0.0679 (2.29)
Wald Chi Squared 102.38 p=[0.000]
Pseudo R Squared 0.1516
OBSERVATIONS 522
Table 4: The Relationship between Workplace Performance and Relative Wages: Two Stage Estimation: Workplace Level Analysis
TWO STAGE PROBIT LEAST SQUARES TWO STAGE LEAST SQUARES
PANEL A: STAGE 2 DL=1 if Labour Productivity Above Average (i.e. LP>=2)
DP=1 if Financial Performance Above
Average (i.e FP>=2) Profits per Employee
Instrumented RW 0.0176 (0.50) 0.0307 (0.87) -0.8532 (1.51)
CLI 0.2208 (2.95) 0.1243 (2.67) 0.0232 (1.87)
Log Likelihood Ratio 49.22 p=[0.000] 59.48 p=[0.000] –
Pseudo R squared 0.0248 0.0300 –
F Statistic – – 2.63 p=[0.000]
Adjusted R Squared – – 0.0689
PANEL B: STAGE 1 Log Relative Wage RW Log Relative Wage RW Log Relative Wage RW
Instrumented DL 0.0241 (0.67) – – – –
Instrumented DP – – 0.3832 (0.74) – –
Instrumented Profits – – – – 0.0006 (0.05)
CLI 0.1966 (2.54) 0.0878 (2.54) 0.1221 (2.13)
F Statistic 13.13 p=[0.000] 12.04 p=[0.000] 3.24 p=[0.000]
Adjusted R squared 0.1387 0.1394 0.0790
OBSERVATIONS 1,432 495
Table A1: Summary Statistics
MEAN STANDARD DEVIATION MINIMUM MAXIMUM
Workplace Level Analysis
Financial Performance (FP) 1.5509 0.8097 0 3
Labour Productivity (LP) 1.5001 0.7132 0 3
Log Profits per Employee -2.0689 2.5957 -10.4070 36.4491
Average Commitment Loyalty Index (CLI) 2.9581 0.4680 0 4
Average Relative Wage Paid in Workplace (RW ) 4.5551 1.0127 1.6510 10.7376
OBSERVATIONS 1,432
Employee Level Analysis Employee Characteristics
Employee Commitment Loyalty Index (CLI) 2.8218 0.8493 0 4
Log Relative Industry-Occupational Wage (RW) 4.2202 0.9801 -2.1501 12.9457
Male 0.4739 0.4993 0 1
Part Time 0.2079 0.4059 0 1
Age 16-17 0.0098 0.0989 0 1
Age 18-19 0.0219 0.1467 0 1
Age 20-21 0.0259 0.1589 0 1
Age 22-29 0.1565 0.3634 0 1
Age 30-39 0.2538 0.4352 0 1
Age 40-49 0.2682 0.4430 0 1
Age 50-59 0.2197 0.4141 0 1
Age 60-64 0.0368 0.1884 0 1
Tenure: tenure <1 year 0.1552 0.3622 0 1
Tenure: 1 year ≤ tenure < 2 years 0.1274 0.3335 0 1
Tenure: 2 years ≤ tenure < 5 years 0.2649 0.4413 0 1
Tenure: 5 years ≤ tenure < 10 years 0.1877 0.3905 0 1
Permanent Contract 0.9235 0.2658 0 1
Trade Union Member 0.3715 0.4832 0 1
Regular Performance Appraisal 0.7091 0.4542 0 1
Workplace Characteristics
Log Workplace Size 4.8406 1.5773 1.6094 8.7979
Log Workplace Size Squared 25.9188 16.1929 2.5903 77.4022
Percentage of Dismissals 1.1343 3.1136 0 100
Percentage of Redundancies 2.1030 8.7708 0 100
Percentage of Suspensions 4.2815 4.9483 0 100
Index of % Supervisors 1.5980 1.0814 0 6
Vacancy Difficulties at Workplace 0.1170 0.3214 0 1
Performance Related Pay 0.3613 0.4804 0 1
Industrial Action in Last 12 Months 0.0800 0.2713 0 1
Employers’ perception of commitment 1.8653 0.6727 0 3
Long-term employment prospects in workplace 3.0175 0.8947 0 4