Genetic variants within glutathione
S-transferase alpha 4 and their role in
newly-diagnosed epilepsy
Thesis submitted in accordance with the requirements of the
University of Liverpool for the degree of Master of
Philosophy
2
Declaration
This thesis is the result of my own work. The material contained within this thesis has not been presented, nor is it currently being presented, either wholly or in part for any degree
or other qualification.
Paul Stephen Mitchell
This research was conducted at the Wolfson Centre for Personalised Medicine Department of Molecular and Clinical Pharmacology
3
Table of Contents
Contents
Acknowledgements ... 7
Abbreviations ... 8
Abstract ... 11
Chapter 1: Introduction ... 14
1.1 Epilepsy... 14
1.1.1. Incidence and Prevalence ... 16
1.1.2. Aetiology of epilepsy ... 16
1.1.3. Diagnosis ... 17
1.1.4. The classification of seizures and epilepsy ... 18
1.1.5. Pharmacological treatment of epilepsy ... 20
Chapter 2: Early work, patient cohorts, and genome wide association study ... 25
2.1. The SANAD cohort ... 25
2.2 The Glasgow cohort ... 25
2.3 The Melbourne cohort ... 25
2.4. Variation between the SANAD and Glasgow cohorts ... 26
2.5. Genome wide association study ... 26
2.5.1 Clinical covariates included in the GWAS analysis... 28
2.5.2. Results of the GWAS ... 28
Chapter 3: Glutathione and the glutathione S-transferase enzyme superfamily ... 31
3.1 Glutathione ... 31
3.2. The glutathione S-transferase family ... 33
3.2.1. Nomenclature of the glutathione S-transferases ... 35
3.2.2. Basic structural features of the glutathione S-transferases ... 36
3.2.3. The cytosolic glutathione S-transferases ... 37
3.2.4. The mitochondrial glutathione S-transferases ... 39
3.2.5. Membrane-associated proteins in eicosanoid and glutathione metabolism .... 40
3.2.6. Variation within the roles of the cytosolic glutathione S-transferases ... 42
3.2.7. An overview of glutathione S-transferase alpha 4 ... 48
3.2.8. The glutathione S-transferases and their role in epilepsy and antiepileptic drugs: Current literature ... 50
4
3.4. Aims ... 56
Chapter 4: Methods ... 58
4.1. SNP selection ... 58
4.1.1. HapMap ... 58
4.1.2. HaploView ... 58
4.2. Preparing a working-stock of DNA ... 62
4.3. TaqMan® genotyping ... 62
4.4. Sequenom MALDI-TOF genotyping ... 64
4.4.1. MySequenom ... 65
4.4.2. Plating DNA for Sequenom Genotyping ... 65
4.4.3. Preparation of plex primer mix ... 66
4.4.4. PCR Reaction ... 67
4.4.5. Shrimp alkaline phosphatase ... 67
4.4.6. iPLEX® gold reaction mixture ... 68
4.4.7. Matrix assisted laser desorption/ionisation time-of-flight mass spectrometry (MALDI-TOF MS) ... 71
4.4. Data and quality control ... 73
4.4.1. SNP control ... 73
4.4.2. DNA genotype control ... 73
4.4.3. Hardy-Weinberg equilibrium ... 73
4.4.4. Matching clinical and genotype data... 73
4.5. Statistical Methods ... 74
4.5.1. Clinical covariates and data coding... 74
4.5.2. Statistical analysis ... 75
Chapter 5: Results ... 78
5.1. Linkage disequilibrium ... 78
5.2. Descriptive statistics ... 80
5.2.1. SANAD Cohort ... 80
5.2.2. Glasgow Cohort ... 82
5.3. Binary logistic regression analysis ... 84
5.4. Cox proportional hazards multiple regression analysis ... 87
Chapter 6: Discussion ... 93
6.1. Limitations ... 98
5
6.3. Study Impact ... 100
6.4. Future work ... 100
6.5. Conclusion ... 102
References ... 104
List of Tables
Table 1.1. Simplified adaption from the 1981 ILAE classification of seizures(8). ... 19Table 1.2: Utilisation of AEDs as recommended by NICE. ... 23
Table 3.1. MAPEG subgroup with corresponding isoenzymes and their biological roles 41 Table 3.2. Cytosolic GSTs with known gene(s) and chromosomal number. ... 42
Table 4.1. Chromosomal coordinates of the GSTA4 gene ... 58
Table 4.2. List of forced inclusion SNPs ... 60
Table 4.3. Tagging/test SNPs with captured alleles ... 61
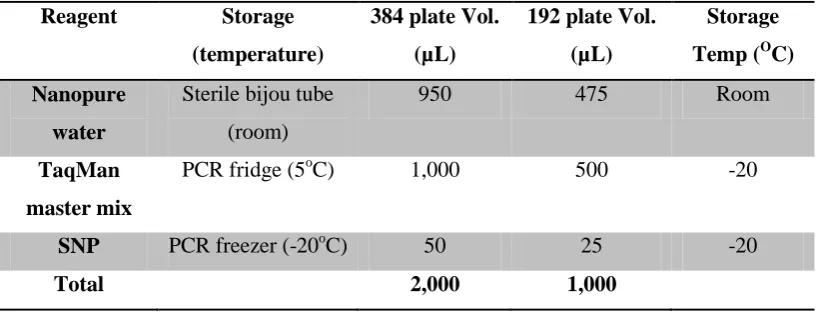
Table 4.4. Reagents and volumes for PCR mix ... 64
Table 4.5 Sequenom PCR preparation mix ... 66
Table 4.6. SAP Enzyme Reagent Preparation ... 67
Table 4.7 4-Step adjustment table for extension primer mix ... 69
Table 4.8 iPLEX reaction reagents and volumes ... 69
Table 4.9 Data coding for statistical analysis ... 75
Table 5.1 Descriptive data for the SANAD dataset ... 81
Table 5.2. Descriptive data for the Glasgow dataset ... 83
Table 5.3. SANAD cohort ... 84
Table 5.4. Glasgow cohort ... 85
6
Table 5.6. SANAD cohort ... 87
Table 5.7. Glasgow cohort ... 89
Table 5.8. Combined cohorts ... 90
Table of Figures
Figure 1.1. AED development since 1900 ... 21Figure 2.1. GWAS Manhattan plot ... 28
Figure 3.1. The structure of glutathione ... 31
Figure 3.2. The synthesis and degradation of GSH within the γ-glutamyl cycle ... 33
Figure 3.3. The general crystallographic structure of GST ... 37
Figure 3.4. The synthesis of the eicosanoids ... 41
Figure 4.1 A schematic of a MALDI-TOF MS system. ... 72
Figure 5.1. SANAD cohort LD plot ... 78
Figure 5.2. Glasgow cohort LD plot ... 79
Figure 5.3. SANAD and Glasgow combined LD plot ... 79
Figure 5.4.KM curve for rs6904769 (SANAD) ... 88
Figure 5.5 KM curve for rs6922246 (SANAD) ... 88
7
Acknowledgements
Foremost, I would like to offer my sincerest gratitude to my supervisors, Dr Graeme Sills and Professor Tony Marson. I am indebted to their patience and academic guidance during my year of postgraduate research, and for this I am wholeheartedly grateful – I am confident the skills I have gained this year will serve me well for my future medical career.
I would also like to extend great thanks to Dr Dan Carr for his infinite patience and support in every aspect of this project; for never once judging any outrageous nonsense I came out with, and for teaching me the genotyping methodologies required for this MPhil.
For input into the statistical analyses, I would like to thank Dr Andrea Jorgensen, whose help and guidance in making sense of medical statistics has been wholly appreciated.
To everyone else in the departments of neuroscience and molecular and clinical pharmacology, I extend my thanks for their contributions.
8
Abbreviations
µL Microlitre
µM Micromole
3’/5’ UTR 3’/5’ untranslated region
4-HNE 4-hydroxynonenal
A Adenine
AED(s) Antiepileptic drug(s)
ALT Alanine aminotransferase
Ask1 Apoptosis signal-regulating kinase 1
AST Aspartate aminotransferase
AUS Australia
C Cytosine
cDNA Complementary deoxyribonucleic acid
CI Confidence interval
CT Computed tomography
CYP2C9 Cytochrome P450 2C9
DNA Deoxyribonucleic acid
dNTP deoxyribonucleotide triphosphate DVLA Drive and vehicle licencing agency
E.coli Escherichia coli
EEG Electroencephalogram
EST Expanded sequence tag
FAM 6-carboxyflurorescein
FDR False discover rate
FLAP 5-lipooxygenase activating protein
G Guanine
GBP Gabapentin
GSH Glutathione
GSSH Glutathione disulphide
9
GSTA Glutathione S-transferase alpha GSTM Glutathione S-transferase mu GSTO Glutathione S-transferase omega GSTP Glutathione S-transferase pi GSTS Glutathione S-transferase sigma GSTT Glutathione S-transferase theta GSTZ Glutathione S-transferase zeta
GWAS Genome wide association study
GWS Genome wide significance
HNF-1 Hepatic nuclear factor 1
HR Hazard ratio
HW Hardy-Weinberg equilibrium
IGE Idiopathic generalised epilepsy
IL-1β Interleukin 1β
ILAE International league against epilepsy
JNK c-Jun N-terminal kinase
Kb kilobase
KM Kaplan-Meir
kNN k nearest neighbour
LD Linkage disequilibrium
LRE Localisation related epilepsy
LTC4S Leukotriene C4 synthase
MAAI Maleylacetoacetate isomerase
MAF Minor allele frequency
MALDI-TOF MS Matrix assisted laser desorption/ionisation-time of flight mass spectrometry
MAPEG Membrane associated proteins in eicosanoid and glutathione metabolism
MDA Malondialdehyde
mEH (3/4) Microsomal epoxide hydrolase (3/4)
MgCl2 Magnesium chloride
10
MGST(1/2/3) Microsomal glutathione S-transferase (1/2/3)
MLH Matrix liquid handler
MRI Magnetic resonance imaging
mRNA UTR Messenger ribonucleic acid untranslated region
mRNA Messenger ribonucleic acid
NAPQI N-acetyl-p-benzoquinone imine
NCBI National centre for biotechnology reseach
ng Nanograms
NHS National health service
NICE National institute of clinical excellence
O
C Degrees centigrade
OR Odds ratio
PAH Polyaromatic hydrocarbon
PCR Polymerase chain reaction
PGD2 Prostaglandin D2
PGES Prostaglandin E synthase
PGF2 Prostaglandin F2
PGH2 Prostaglandin H2
q-PCR Quantitative polymerase chain reaction
rpm Revolutions per minute
SANAD Standard and new antiepileptic drug
SAP Shrimp alkaline phosphatase
SD Standard deviation
SNP Single nucleotide polymorphism
SUDEP Sudden unexplained death in epilepsy
T Thymine
UNC Unclear
UV Ultraviolet
VKORC1 Vitamin K epoxide reductase complex subunit 1
VPA Valproic acid/Sodium valproate
11
Abstract
Introduction: Epilepsy is one of the commonest neurological disorders, affecting over 50 million people worldwide. Antiepileptic drugs (AEDs) are the mainstay of treatment, though they remain ineffective in 30% of individuals for whom they are prescribed.
Pharmacoresistance in epilepsy is a significant problem. The mechanisms involved elude us still, with numerous theories and hypotheses posed in order to explain why this phenotype may exist. It is thought that genetic variation within certain genes may explain, at least in part, why the pharmacoresistant phenotype exists, and indeed may explain the dose-response variation observed in clinical practise.
A genome-wide association study was conducted on newly-diagnosed patients with epilepsy upon starting their first AED, with the primary measure of outcome being one year remission of seizures at any time during follow-up. The strongest association was seen at a loci on chromosome 6, rs622902 (p=1.47×10⁻⁷) in the glutathione S-transferase alpha 4 (GSTA4) gene. GSTA4 is an enzyme of the glutathione-conjugating family of superenzymes that are responsible for a plethora of reactions that detoxify reactive metabolic intermediates, including many xenobiotics. In view of these findings, it was the aim of this study to explore the role of GSTA4 in newly-diagnosed epilepsy patients.
12
treatment (sodium valproate or gabapentin vs. neither) and EEG findings (normal, non-specific, epileptiform, not-done).
Results: Three SNPs (rs6904769, FDR = 0.0353; rs6922246, FDR = 0.0109 and rs384505, FDR = 0.0459) in the SANAD cohort showed an association with the binary outcome (yes/no) of seizure remission. Only rs6922246 (FDR = 0.0459) held association after combining both cohorts.
Two SNPs (rs6904769, FDR = 0.0491 and rs6922246, FDR = 0.00380) were significantly associated with time to 12-month remission of epilepsy. This association held in rs6922246 (FDR = 0.0459) after combining the cohorts.
13
Chapter 1
14
Chapter 1: Introduction
1.1 Epilepsy
As with many diseases - particularly those affecting the nervous system - epilepsy was considered a symptom of demonic possession. For epilepsy, this belief was held firmly until the period 1860-1910, when the supernatural explanation for the cause of epilepsy was lain to rest, and the modern era of scientific theory was initiated by the ‘father of epilepsy’, John Hughlings Jackson (1).
Much like headache, epilepsy is a symptom of neurological dysfunction rather than a disease in itself per se (2). The distinction between a seizure and epilepsy is subtle, in that any person can have a seizure under certain pathological conditions such as hyponatraemia, hypoglycaemia, alcohol withdrawal, etc., whereas epilepsy is a condition of recurrent, unprovoked seizures whereby the known pathological conditions such as those aforementioned are absent. Therefore, every patient with epilepsy has seizures, but not ever patient with seizures has epilepsy. The underlying neurological pathology in epilepsy is manifest as spontaneous neuronal discharge of cerebral cortex neurons resulting in seizures. The epilepsy type is dependent on a variety of factors, though the anatomical location of the epileptogenic focus, along with any secondary generalisation, dictates the phenotype most strongly.
15
negative connotations: quality of life is often greatly impacted, and stigma is something many patients with epilepsy often report.
Quality of life in epilepsy is negatively impacted upon for several reasons. Unlike other chronic diseases, epilepsy may result in withdrawal of driving privileges, such that one must be seizure-free for 12 consecutive months in order to regain a licence from the Drive and Vehicle Licensing Agency (DVLA). A measurement of outcome in epilepsy research is time to 12-month remission, which ideally encompasses this restriction, also. Furthermore, the inability to predict the next seizure often leads to patients being cautious about being away from home, developing anxiety and becoming caught in a spiral of fear and emotion often resulting in depression as a concurrent diagnosis.
A multitude of underlying factors are recognised as responsible for the causation of epilepsy, and it is now thought that the disease is multifactorial in most patients. The list of aetiologies is vast, and can range from underlying genetic factors through to structural cerebral pathology as in mesial temporal sclerosis. Sclerosis of the mesial temporal lobe structures is not considered to be primary causative, as it is not strictly known whether the sclerosis arises as a result of the epilepsy, or whether the sclerosis is a prerequisite to the epilepsy. This may be the case for other pathologies observed in patients with epilepsy.
16
1.1.1.
Incidence
and Prevalence
Epilepsy is a common neurological condition affecting over 50 million people worldwide, and this figure is a likely gross underestimate (5). Unlike many chronic diseases, epilepsy is, for the most part, a hidden disorder, and is more widespread in society than is often thought. The incidence of epilepsy as cited in the literature varies significantly, though a large meta-analysis in 2011 by Ngugi et al (5) reported that the mean incidence was 50.4 cases per 100,000 population per annum. This figure is higher for those living in developing nations (81.7 per 100,000 per year) and is also higher for those of lower socioeconomic status. The prevalence of the disorder is estimated at between 4 and 10 persons per 1,000 (6). Increased prevalence of epilepsy in developing nations is most likely the result of poor maternal health, particularly in the first trimester during neural tube development, higher birth complications and subsequent neonatal anoxia, and poorer environmental conditions during the perinatal period (5, 6).
The distribution of incidence against age for epilepsy is bimodal; the first peak is in the early years of life, and the second occurs in the elderly population. The latter probably occurs in accordance with a greater incidence of neurological dysfunction with advancing age, most notably cerebrovascular disease. In recent years, the incidence of epilepsy in the paediatric population has seen a decline, and this is thought to have occurred secondary to better maternal heath during pregnancy and increased standards of neonatal and perinatal care.
1.1.2. Aetiology of epilepsy
17
(CT) and magnetic resonance imaging (MRI), along with significant advances in molecular biochemistry, have revolutionised epileptology, though there is still a long way to go. It is now possible to discern structural cortical abnormality from other causes of epilepsy, and many of the inherited errors of metabolism that lead to specific epilepsy syndromes are well understood (1). However, the vast majority of epilepsies still remain ‘cryptogenic.’ Genetic predisposition is thought to contribute significantly, and recent advances in molecular genetics offer further light and promise to understanding the aetiology of epilepsy.
1.1.3. Diagnosis
The diagnosis of epilepsy is notoriously difficult. As such, it is a recommendation of the National Institute for Health and Clinical Excellence (NICE) that the diagnosis be confirmed by a specialist clinician with an interest in the condition (7).
18
1.1.4. The classification of seizures and epilepsy
Seizures are clinically classified into two main categories: partial/localised/focal and generalised. Where the seizure cannot be classified, it should be labelled ‘unclassifiable’ until such time as additional information becomes available enabling its inclusion in one of the two principal categories (8).
This classification system is centred on the anatomical area of cortical discharge that manifests as a seizure. Partial seizures are those that occur with a discrete area of discharge that is attributable to a particular area of brain and that does not involve the entire cerebral hemispheres bilaterally. Generalised seizures involve all areas of the brain having spread via the deep brain structures/corpus callosum to involve both hemispheres. The focus in partial seizures is often easily discerned by the seizure itself; involvement of the motor strip will affect the contralateral limb(s), and activation of the reticular formation in the midbrain will lead to loss of consciousness, as in generalised seizures or complex partial seizures.
19
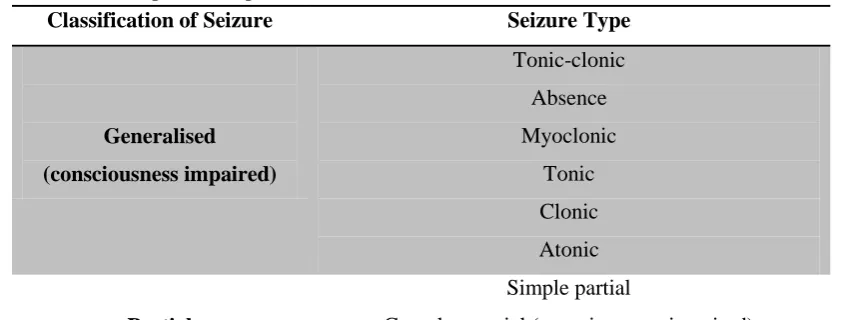
Table 1.1. Simplified adaption from the 1981 ILAE classification of seizures(8).
Classification of Seizure Seizure Type Generalised
(consciousness impaired)
Tonic-clonic Absence Myoclonic
Tonic Clonic Atonic
Partial
Simple partial
Complex partial (consciousness impaired) Partial with secondary generalisation (consciousness
impaired)
‘Unclassifiable’
Below is the latest accepted classification of the epilepsies from the ILAE. 1.Localization-related (local, focal, partial) epilepsies and syndromes
1.1 Idiopathic (with age-related onset)
Benign childhood epilepsy with centro-temporal spikes Childhood epilepsy with occipital paroxysms
Primary reading epilepsy 1.2 Symptomatic
Chronic progressive epilepsia partialis continua
Syndromes characterized by seizures with specific modes of precipitation Temporal lobe epilepsies
Frontal lobe epilepsies Parietal lobe epilepsies Occipital lobe epilepsies 1.3 Cryptogenic
2. Generalized epilepsies and syndromes 2.1 Idiopathic (with age-related onset)
Benign neonatal familial convulsions Benign neonatal convulsions
20
Childhood absence epilepsy Juvenile absence epilepsy
Juvenile myoclonic epilepsy (impulsive petit mal, Janz syndrome) Epilepsy with grand mal seizures (GTCS) on awakening
Other generalized idiopathic epilepsies
Epilepsies with seizures precipitated by specific modes of activation 2.2 Cryptogenic or symptomatic
West syndrome (infantile spasms) Lennox-Gastaut syndrome
Epilepsy with myoclonic-astatic seizures Epilepsy with myoclonic absences 2.3 Symptomatic
2.3.1 Non-specific aetiology
Early myoclonic encephalopathy
Early infantile epileptic encephalopathy with suppression bursts Other symptomatic generalized epilepsies
2.3.2 Specific syndromes
Epileptic seizures complicating other disease states
1.1.5. Pharmacological treatment of epilepsy
Pharmacological therapy remains the mainstay of epilepsy treatment. The ultimate goal of AED therapy is to achieve total seizure freedom whilst producing no side-effects from the medication. Seizure freedom with no side-effects is a scenario seldom seen by the clinician, and often a balance between seizure control and side-effects must be struck in order to obtain the best possible outcome for any given patient.
21
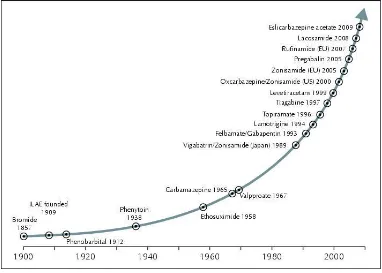
The current market has over 20 AEDs available for prescription. Figure1.1 illustrates the main AEDs available today and their approximate year of approval for marketing. Even with the exponential increase in AEDs coming to market in recent decades, there has been no real revolution in the treatment of the condition (9). With approximately 50 million people worldwide suffering from epilepsy and 30% of those inadequately served by existing medication, pharmacoresistant epilepsy represents a significant global health issue.
There is a clear need for the development of novel, more effective AEDs. However, this is unlikely to be achieved with any significant success until the mechanisms underpinning epileptogenesis are unravelled and new targets for drugs are discovered.
Figure 1.1. AED development since 1900, showing the exponential rise in AED drugs
[image:21.595.124.506.351.624.2]22
1.1.5.1. Choice of antiepileptic medication
The choice of AED is a decision directed by guidelines published by NICE (7), which reflect evidence-based practise and the opinion and experience of specialist clinicians with an interest in epilepsy. Several factors are considered in AED prescribing; foremost is the suitability of the drug for a specific seizure type or syndrome. Most AEDs are not suitable for all seizure/epilepsy types, and in some circumstances may even exacerbate the condition. The side-effect profile of the medication must also be borne in mind, with switching of AEDs commonplace owing to unacceptable side-effects. Further factors influencing choice include age, sex, concomitant medications, patient preference (usually on the basis of anticipated side effects), and cost.
23
Table 1.2: Utilisation of AEDs as recommended by NICE. Adapted from NICE (7).
Seizure Type 1st-line AED Adjunctive AED Others Generalised tonic-clonic Carbamazepine Lamotrigine Oxcarbazepine Sodium valproate Clobazam Lamotrigine Levetiracetam Sodium valproate Topiramate
24
Chapter 2
Early work, patient cohorts, and
25
Chapter 2: Early work, patient cohorts, and genome
wide association study
2.1. The SANAD cohort
The standard and new antiepileptic drug (SANAD) study was an un-blinded, multicentre, randomised clinical trial designed to analyse which of the current standard and new antiepileptic drugs had superiority in both clinical and cost effectiveness in newly-diagnosed patients with epilepsy. Over 2,400 patients were recruited into the trial, and were prospectively followed up for a period of at least 1 year from the initiation of their first AED (10, 11). Drug response phenotypes were reported by consulting the clinical trial database.
A subset of the SANAD cohort was consented to provide a blood sample that was to be used for DNA extraction and later genetic analysis. The approval for this was given by the North-West multicentre research ethics committee in August 2002.
2.2 The Glasgow cohort
The Glasgow cohort comprises 285 newly-diagnosed patients with epilepsy that were recruited from the Western Infirmary, Glasgow. Drug response phenotypes in this study were identified retrospectively from prospectively-collected trial data and/or from hospital notes, thereby making the available clinical data more comprehensive than the SANAD data set. Patients were self-reported as having European ancestry and blood samples for DNA analysis were collected with consent following approval from the West ethics committee, North Glasgow University Hospitals NHS Trust in September 2002.
2.3 The Melbourne cohort
26
SNPs in 279 candidate genes were used in order to try and determine which SNPs were most influential in predicting seizure control following 1 year of AED therapy using a k-Nearest neighbour (kNN) model.
2.4. Variation between the SANAD and Glasgow cohorts
Differences between the cohorts that were of note include the geographical distribution of the patients in the SANAD cohort; these patients are representative of the UK with their diagnoses being made by clinicians nation-wide. Conversely, the Glasgow cohort was representative of a discrete geographical area with the diagnoses made by the same group of clinicians. Further, whilst the Glasgow data was deemed to be more comprehensive, data that was not available from this group included information regarding neurological deficit. The significance of these is discussed in the appropriate sections.
2.5. Genome wide association study
27
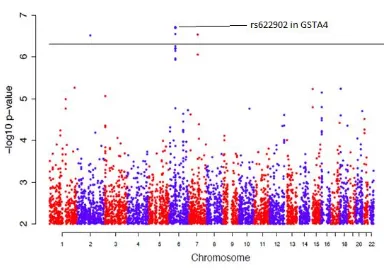
The results of a GWAS are typically illustrated in the form of a Manhattan plot, which displays statistical significance on the y-axis (as –log10 p-value) against chromosome
number on the x-axis, for each genotyped SNP. Genome wide significance (GWS) is arbitrarily assumed at a p-value of <1x10-4.5 for discovery analysis and a p-value of <5x10⁻⁸for meta-analysis used in validation. Below GWS, the general consensus is that meta p-values in the interval 5x10⁻⁸ < p < 5x10⁻⁷ are suggestive of causal genomic association.
A GWAS of treatment response in newly-diagnosed epilepsy patients was conducted on patients from the SANAD cohort at the Wellcome Trust Sanger Institute on an Illumina 660Q GWAS chip (unpublished data). The aim of this was to identify regions of DNA that were highly polymorphic in order to begin to understand the role of SNP variations in the response to AED therapy. These data were meta-analysed with those from the AUS cohort for the purposes of validation. The primary outcome in this analysis was 1-year remission of seizures at any stage during follow-up, with a minimum follow-up of one year from initiation of AED therapy.
28
2.5.1 Clinical covariates included in the GWAS analysis
The following is a list of the clinical covariates included in the GWAS analysis. - Age
- Sex
- Epilepsy type (generalised, partial or unclassified) - Treatment (sodium valproate, gabapentin or neither) - EEG (normal, abnormal or not done)
- Neurological deficit (yes or no)
- Number of pre-treatment seizures (2, 3, 4, 5 or >5)
A total of 933 patients were included in the final meta-analysis. Of these, 671 were from the SANAD cohort (438 cases, 233 controls) and 262 from the AUS cohort (188 cases, 74 controls).
2.5.2. Results of the GWAS
Figure 2.1. GWAS Manhattan plot illustrating the most significant loci of rs622902 (p = 1.47×10⁻⁷) in the GSTA4 gene region
[image:28.595.122.506.363.633.2]29
association was observed in chromosome 6; the most significant p-value (p=1.47×10⁻⁷, log10 value=6.83) was attributed to the SNP rs622902, located within the gene encoding
glutathione-S-transferase alpha 4 (GSTA4). Other loci identified included a SNP on chromosome 2 which represents rs13022574 – the DPP10 gene, and rs37919 on chromosome 7 within the region of GNA1, CD36 and GNAT3. The former is a dipeptidyl peptidase-like protein that regulates the functional properties of neuronal Kv4 channels whose implication in epilepsy has been previously described by Maffie and Rudy (13). GNA1 is glucosamine-phosphate N-acetylytransferase; CD36 is a thrombospondin receptor; and GNAT3 is a a guanine nucleotide binding protein. The role of these SNPs on chromosome 7 is less obvious in epileptogenesis.
30
Chapter 3
Glutathione and the glutathione
S-transferase enzyme
31
Chapter 3: Glutathione and the glutathione
S-transferase enzyme superfamily
3.1 Glutathione
Glutathione (GSH) is a molecule of detrimental importance in the physiology of cellular redox balance where, via the action of glutathione S-transferase (GST) enzymes, it prevents the oxidation of cellular compounds, organelles and membrane lipids by toxic phase I metabolites. It was discovered by Nobel laureate Sir Frederick Gowland Hopkins of Cambridge University in 1922, where he noted that the addition of GSH could restore a tissues ability to reduce methylene blue, when that tissue had previously lost its reducing power (14).
Figure 3.1. The structure of glutathione
Taken from Thomas J, 1999 (15).
32
Schafer and Buettner (17) have conducted extensive research into GSH. They have shown that the intracellular concentrations of GSH vary, with the distribution being somewhat compartmentalised. The highest concentration of GSH can be found in the cytoplasm – between 1 and 11mM – mirroring the fact that this is the site of GSH synthesis. The mitochondria also contain a separate pool, where the process of oxidative phosphorylation produces superoxide (O2
-) that would otherwise destroy the organelle and cell (16, 18). Nuclear GSH maintains the redox state of important sulfhydryls that exists within proteins necessary for DNA repair (18). This compartmentalisation of GSH is important; radical species produced within the cells have a known short half-life, and their subsequent damage occurs close to the sites at which they are produced (16). In order for their effective removal, GSH must be present in these sites of radical manufacture such that the redox balance is maintained.
The common affinity for GSH shown throughout the GST superfamily also illustrates the importance of this molecule as a powerful reducing agent. Whilst the GSTs have affinity for a multitude of substrates and compounds, this affinity shown throughout all members of the cytosolic and mitochondrial GST families for GSH specifically is owed to a GSH binding site in the GST macromolecule – the ‘G-site’ (19). This will be discussed in greater detail in section 1.2.3.
33
Figure 3.2. The synthesis and degradation of GSH within the γ-glutamyl cycle
Taken from Masella R & Mazza G, 2009 (16).
1) γ-glutamylcysteine synthetase; 2) GSH synthetase; 3) γ-glutamyltranspeptidase; 4) γ-glutamylcyclotransferase; 5) oxoprolinase.
CYS-GLY – cysteinyl glycine; γ-GT – γ-glutamyl transferase
3.2. The glutathione
S
-transferase family
34
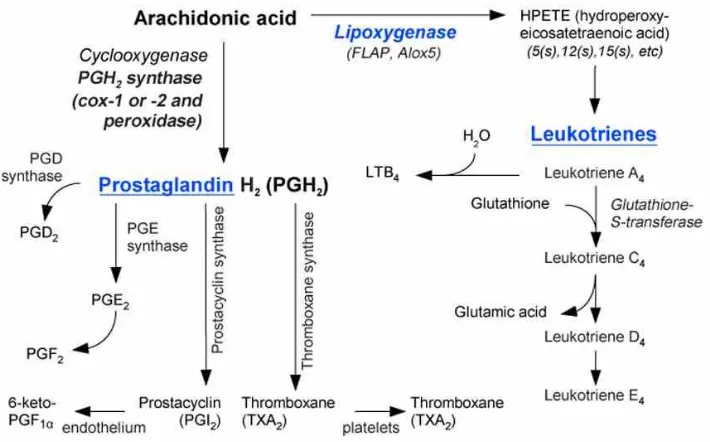
pharmacological agents, and are thereby considered a highly sophisticated evolutionary mechanism for removing cytotoxic agents from within the cell. Further research has also elucidated many other roles, including hormone synthesis, tyrosine degradation, and peroxide breakdown (22). Not only are GSTs involved in enzymatic reactions involving GSH, but they have also been shown to synthesise leukotrienes via mechanisms which utilise GSH as a co-factor, and they are also implicated in the production of prostaglandins (22). These will be discussed in greater detail in the relevant sections.
There exist three superfamilies of GST: cytosolic, mitochondrial, and MAPEG (membrane-associated proteins in eicasanoid and glutathione metabolism), the latter formerly designated microsomal GST (MGST). Both cytosolic and mitochondrial subtypes share deep evolutionary similarities in their three-dimensional structure, but these groups bear no reflection of a common ancestry with the MAPEG enzymes; cytosolic and mitochondrial GSTs form dimers, where MAPEG GSTs form bound trimeric enzymes. Cytosolic GSTs comprise the largest group, and are responsible for the catalysis of the greatest variation of biochemical reactions within the cell. It is, therefore, the group that will be elaborated upon in greatest detail.
35
3.2.1. Nomenclature of the glutathione S-transferases
An internationally accepted method for naming GST was long sought, in part due to the continually evolving knowledge of the function, and diversity, of these enzymes. Upon their initial discovery, GST was known to catalyse the reactions of GSH with bromosulfophthalein (25) and chloronitrobenzenes (26), and subsequently the name GSH S-aryltransferase was given. Other known GSTs involved in the catalysis of epoxides and alkyl halides were given the respective names GSH epoxide transferase and GSH S-alkyl transferase (27). However, it was soon discovered that the compound 1-chloro-2,4-dinitrobenzene acted as a ‘general’ substrate for all GSTs (28), and the original nomenclature had to be abandoned.
There still exists debate in the naming of GSTs across the entire superfamily of enzymes. Decades of research into GST has procured much information on their importance in cellular homeostasis and detoxification of endogenous and xenobiotic compounds, and has thus necessitated a unified nomenclature method. To date, a system of internationally accepted nomenclature exists for the soluble mammalian GSTs, which includes cytosolic and mitochondrial enzymes (the latter of which are also designated GSTK).
36
may be homodimeric composed of two copies of subunit 1, or heterodimeric (within the same class), composed of more than 1 subunit. In this case, the homodimeric protein Alpha would be written GSTA1-1; the heterodimeric protein alpha is written GSTA1-2. Similarly, the gene encoding GST class mu subunit 1 is written GSTM1, with the homodimeric protein written GSTM1-1. In cases where GSTs belonging to different biological organisms need to be distinguished, a lowercase prefix may be used to denote that species, such as r or p for rat and pig, respectively. In this case, the protein mu class GST with subunit 1 for each would be rGSTM1-1 and pGSTM1-1, respectively.
3.2.2. Basic structural features of the glutathione S-transferases
The first determined structure of any GST was that of the porcine pi subclass, pGSTP1-1, as described by Reinemer et al (31). Since then, the three dimensional structures of many of the other families and classes of GST have been elucidated by x-ray crystallography, including similarities and differences between their protein folding, and the chemical properties by which they interact with their substrates.
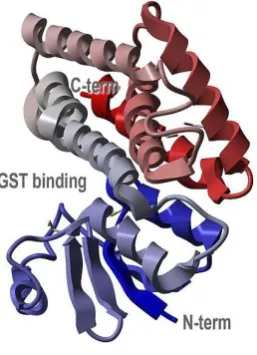
(‘thioredoxin-37
[image:37.595.250.379.171.349.2]like’) (34), while the H-site is constructed of the C-terminal domain, itself α-helical with a contributing loop from the N-terminal domain. Substrate specificity within the H-site is owed to variation in the amino acid sequence at this location (33).
Figure 3.3. The general crystallographic structure of GST illustrating the C- and
N-terminus and the common GST binding site for GSH. Taken from Protein Data Bank:
http://www.rcsb.org/pdb/explore/explore.do?structureId=1R5A
3.2.3. The cytosolic glutathione S-transferases
Cytosolic GSTs are dimeric proteins with between 199-244 amino acids (22). In mammals, there are seven subclasses: alpha (A), mu (M), pi (P), sigma (S), theta (T), omega (O) and zeta (Z). Other subclasses do exist (beta, delta, epsilon, lambda, phi, tau, and “U”) (22), though these enzymes are found in non-mammalian species and are not discussed further.
38
Ligandin (35) - this name was changed upon the discovery of the wide functional roles of these enzymes.
The sigma class GST, otherwise known as haematopoeitic prostaglandin D synthase, converts PGH2 into PGD2 in a GSH-dependant manner, as outlined in figure 1.5 (36).
39
polyaromatic hydrocarbons (PAH), and they show particular affinity towards the metabolites of lipid peroxidation (44) and cell membrane oxidation (45).
3.2.4. The mitochondrial glutathione S-transferases
Mitochondrial GSTs, also known as GST kappa (GSTK), share deep structural evolutionary links with the cytosolic group of enzymes (46). They were first isolated from the mitochondria of rat liver by Harris et al (46) and this organelle-specific localisation was confirmed using immunohistochemical techniques by Thomson et al (47) on specimens of liver and kidney. A number of research methodologies by several groups has confirmed the presence of this class of GST in the mitochondria, as well as finding the enzyme within cellular peroxisomes where they act as peroxidase enzymes protecting against lipid-peroxides (30). The specific localisation of this class reflects the fact that GSTK is highly involved in the detoxification of reactive-oxygen species from the respiratory chain reactions and oxidative phosphorylation, particularly more so than other classes (48).
40
3.2.5. Membrane-associated proteins in eicosanoid and glutathione
metabolism
The MAPEG series of GSTs contains four subtypes (I-IV), of which there exist six isoenzymes belonging to subtypes I, II and IV in humans. These six isoenzymes are (52):
1) 5-lipooxygenase activating protein (FLAP); 2) Leukotriene (LT) C4 synthase (LTC4S);
3) Microsomal glutathione S-transferase 1 (MGST 1); 4) Microsomal glutathione S-transferase 2 (MGST 2); 5) Microsomal glutathione S-transferase 3 (MGST 3), and; 6) Prostaglandin E synthase (PGES).
The initial two isoenzymes are involved in the biosynthesis of leukotrienes; LTC4S
conjugates leukotriene A4 with GSH, and FLAP is necessary for the production of
5-lipooxygenase from its precursor arachidonic acid. MGSTs 1-3 are GSTs as well as GSH-dependent peroxidases; MGST 1 is implicated in the biochemical reactions conjugating electrophilic compounds with GSH, whilst MGST 2 and 3 both catalyse the conjugation of GSH with leukotriene A4. Prostaglandin E synthase is involved in the biosynthesis of
prostaglandin E2 (PGE2) from the precursor molecule prostaglandin H2 (PGH2),
ultimately responsible for the synthesis of prostaglandin F2 (PGF2) - all of these
41
Figure 3.4. The synthesis of the eicosanoids, with the specific role of GSH and GST shown
in leukotriene (leukotriene C4) production Taken from: http://www.scienceofhealthindex.com/images/Eicosanoid_synthesis.jpg
According to subdivision based on sequence, group I MAPEGs contain FLAP, LTC4S
[image:41.595.135.490.68.289.2]and MGST 2; group II contains MGST 3 as its only member; and group IV contains PGES and MGST 1. Group III subtypes are found only in the bacteria Escherichia coli and Vibrio cholera (22).
Table 3.1. MAPEG subgroup with corresponding isoenzymes and their biological roles
Subgroup Isoenzyme Biological Function
I
5-lipoxygenase activating protein (FLAP)
Leukotriene biosynthesis activation
Leukotriene C4 Synthase
(LC4S)
GST specific for LTC4
synthesis Microsomal Glutathione
S-Transferase 2 (MGST 2)
GST activity & GSH peroxidase activity
II Microsomal Glutathione
S-Transferase 3 (MSGT 3)
GST activity & GSH peroxidase activity IV
Prostaglandin E Synthase (PGES)
PGH2 PGE2
Microsomal Glutathione S-Transferase 1
[image:41.595.108.518.533.707.2]42
3.2.6. Variation within the roles of the cytosolic glutathione
S-transferases
A brief overview of variation amongst the human cytosolic GSTs is given below in order to outline their varying roles within the human body, and to give an appreciation of what genetic variants/polymorphisms may have on their function.
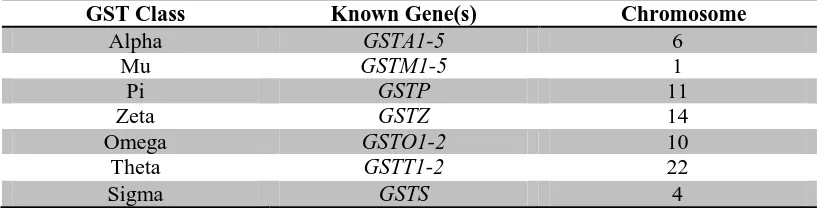
[image:42.595.107.520.290.395.2]For reference, the cytosolic GSTs with their corresponding gene(s) and chromosome number are given below in table 1.4.
Table 3.2. Cytosolic GSTs with known gene(s) and chromosomal number.
3.2.6.1. Alpha Class
Five GST alphas have been identified to date – GSTA1, A2, A3, A4 and A5 - all located on chromosome 6 (33, 54-56). Using gene-specific probes and real-time PCR methods in 24 human tissue samples, Morel et al (54) showed that GSTA1, GSTA2 and GSTA4 were distributed widely in human tissues, whilst GSTA3 was somewhat rarer and GSTA5 mRNA was not detected. Specifically, transcripts of GSTA4 were detected in all tissues, which was a finding echoed by Desmots et al (57) who found GSTA4 in all tissues by Northern blot analysis. GSTA1 and GSTA2 mRNA were often co-expressed. GSTA3 was found in several of the samples, though in high concentrations in lung, stomach, testis, placenta and suprarenal tissue. In all of the samples analysed, no transcript corresponding to the GSTA5 sequence was detected.
GSTA1 has been implicated in the pathophysiology of inflammation, with its downregulation having profound implications for the mechanisms that guard against
GST Class Known Gene(s) Chromosome
Alpha GSTA1-5 6
Mu GSTM1-5 1
Pi GSTP 11
Zeta GSTZ 14
Omega GSTO1-2 10
Theta GSTT1-2 22
43
cellular stress from by-products of lipid peroxidation. Ng et al (58) showed that interleukin (IL)-1β, via a mechanism that involved the overexpression of a variant of hepatic nuclear factor 1 (HNF-1), caused the repression of GSTA1 during the inflammatory process. This indicates that GSTA1 may play an important role in the cellular mechanisms that protect against inflammation secondary to the by-products of lipid peroxidation.
The GSTA2 protein is 222 amino acids in length with a molecular mass of 25,425. Its role in health and disease has been studied by several groups; GSTA2 is the known enzyme for conjugation of the myelosuppresive agent busulfan with GSH. This agent may be administered to patients undergoing haematopoietic stem cell transplantation prior to therapy, and its biotransformation appears unaltered by polymorphic variation suggestive of there being no consequence of base variation in these alleles (59). Board and Webb (55) also suggested that this particular GST may be implicated in the aetiology of non-haemolytic unconjugated hyperbilirubinaemia, indicating GSTA2 may have a role in the transport of compounds such as haeme and bilirubin.
44
GSTA4 has a wide tissue distribution in humans. Amongst other organs, it is found within kidney, liver, brain, skin, heart and colon (63). This particular alpha isoform was isolated and cloned from a human cDNA library (62), whereupon it was shown to have particular enzymatic activity towards carbonyl compounds and reactive radical species (63), indicating a significant role for this isoform in cellular homeostasis. The role of GSTA4 will be discussed in further detail at the end of this section.
To date, little is known regarding the role of GSTA5. Hayes et al (64) reported the upregulation of GSTA5 in rat hepatocytes following the administration of chemotherapeutic agents, with further computer modelling of the promoter region of
GSTA5 identifying a possible antioxidant response element that may confer this resistance (64, 65). The postulated role of this enzyme in chemoresistance suggests their upregulation may also play a role in other diseases where pharmacoresistance is a problem, though this hypothesis has yet to be explored.
3.2.6.2. Mu class
The five known GST mu genes, GSTM1-5, have been mapped to chromosome 1 using locus-specific PCR primer pairs on DNA samples retrieved from human/hamster somatic cell hybrids (66). Of the GSTM subclass, both GSTM1 and GSTM2 have been shown to be the most active GSTs within the liver (67). The specific roles of these isozymes within the hepatic parenchyma, however, are poorly understood.
45
concluded that rs366631 is a pseudo-SNP and may, perhaps, be used as a biomarker for
GSTM1 gene deletion. GSTM1 null has been implicated in several disease states, and its role in epilepsy is discussed further at the end of this chapter.
In comparison to GSTM1, much less is known regarding the function of GSTM2, M3, M4 and M5. GSTM2 is a dimeric enzyme that is found mainly within liver and muscle tissues, and GSTM3 is found largely within the brain (70). Studies into the significance of
GSTM4 gene variation in human disease are few, though one group suggested that a T2517C polymorphism within intron 6 of the GSTM4 gene is associated with carcinoma of the lung (Fisher’s Exact Test, p=0.026) in a population containing 136 lung cancer patients and 156 healthy controls (71).
GSTM5 was discovered by Takahashi et al (72) by screening a human frontal cortex cDNA library with a rat cDNA that cross-hybridised with other human and rodent GSTM cDNAs. This isozyme was found to be expressed primarily in brain and lung tissue by Northern blot analysis, and is predicted to contain 217 amino acids. The role of GSTM5 has yet to be outlined.
3.2.6.3. Omega class
Two members of the omega class are known to exist to date, whose loci exist on chromosome 10: GSTO1 and GSTO2 (40, 73). Whilst all of the GST isozymes share structural and functional variance, the GST omega is somewhat further distinct from the others (33).
46
seen within any other class of GST. Further, substrates that are biochemically altered by other GSTs are not altered by certain GSTO1 alleles, and its ability to metabolise dehydroascorbate in a GSH-dependant reduction shows that this particular allele illustrates behaviour that is characteristic of the glutaredoxins rather than the GSTs (40, 74).
The role of GSTO2 currently remains unclear. Significant expression was found in the testes, though amounts have also been shown in kidney, liver, striated muscle and prostate tissues (73). This allele shares 64% of its amino acid sequence with GSTO1 (73).
3.2.6.4. Pi class
One member of the GST pi is currently known to date, and is coded by a loci found on chromosome 11 (33). Its expression can be found in all tissues of the human body, expect for red blood corpuscles and little amounts found in the liver (70, 75).
GSTP was isolated by Kano et al (76) by screening a human placental cDNA library with rat placental GST cDNA. The protein is approximately 209 amino acids in length, and contains 7 exons which span approximately 2.8kb (77).
Several studies have suggested a role for GSTP in a number of biochemical pathways, and its role in several disease states has been implicated. Expression of GSTP was found to be increased in many tumours relative to normal tissue samples, suggesting a role for GSTP in carcinogenesis (78). These links are poorly explored.
47
Much interest in the polymorphism within GSTP has been shown. Of particular interest was a study conducted by Menegon et al (80), who pursued the widely-accepted hypothesis that Parkinson’s disease could be caused by numerous environmental factors, including xenobiotic agents and pesticides. Given the role of GST in the reduction of such compounds, and its presence in the blood-brain barrier (81), the group investigated the role of GST polymorphisms in the development of Parkinson’s disease in 95 patients and 95 controls by PCR genotyping. When analysing the results of those patients who had reported pesticide exposure, associations were seen only within GSTP, with differences secondary to an excess of heterozygotes and non-carries of the A allele in the patient group compared to the control group.
3.2.6.5. Theta class
Two isozymes comprise the GST theta class (GSTT1 and GSTT2), whose location on chromosome 22 was found by in-situ hybridisation studies (82). Pemble et al (83) are responsible for the cDNA cloning of this class, and deduced its composition of 239 amino acids, though for some time GSTT was overlooked owing to its low activity with the classic GST substrate, 1-chloro-2,4-dinitrobenzene.
A study by Chen et al (84) compared the frequency of the GSTT1 null genotype in 96 myelodysplastic syndromes and 201 healthy controls matched for age, race and sex. Forty-six per cent of patients with myelodysplastic syndrome were null for GSTT1
compared with 16% of controls. The results illustrated a 4.3-fold increased likelihood of myelodysplastic syndrome, though the mechanism of this increased inference was not understood.
48 3.2.6.6. Zeta class
GST zeta was discovered using sequence alignment and phylogenetic analysis, and is located on chromosome 14 (87, 88). This isoenzyme is found in abundance in the liver and proximal convoluted tubules of the kidney, where they catalyse GSH-dependant reactions involving an array of electrophilic alpha-halogenated acids (33). GST zeta is also characterised as maleylacetoacetate isomerase owing to its role in the catabolic pathway of both phenylalanine and tyrosine (89).
Polymorphisms within GSTZ are known to have clinical consequence. Decreased ability to catalyse the aforementioned reactions lead to metabolic diseases including type I tyrosinaemia and phenylketonuria (90).
3.2.7. An overview of glutathione
S-
transferase alpha 4
Board et al (62) was responsible for isolating the entire GSTA4 cDNA clone from a human adult brain cDNA library. The protein is 222 amino acid molecules long with a molecular mass of 25.7kD. It shares 52% sequence identity with GSTA1, spans 18kb, and contains 7 exons.
Within the GSTA4 gene region there are, to date, a total of 361 known SNPs (contig label: GRCh37.p5) including the intronic regions. Of these, 12 are known functional SNPs (non-synonymous). Fourteen exist in the 3’ UTR region and 5 are within the 5’ UTR region of the gene. The chromosomal coordinates are 6p12.1 and it can be found within base pairs 52,842,746 – 52,860,178 (91).
49
the catalysis of reactive carbonyl compounds such as alk-2-enals whose presence also lead to cellular stress and damage. Combined, the role of GSTA4 as a protector against reactive intermediates is considerable.
A number of studies have been conducted into the link between GSTA4 and disease. It is known that insulin resistance is linked to an increase in the production of free radical species, resulting in the increased production of lipid aldehydes (93). These aldehydes are enzymatically degraded primarily by GSTA4. Decreased levels of GSTA4 and resultant increases in lipid aldehyde production were shown to cause abnormal protein carbonylation within adipocytes. The effect was aberrant glucose transport, lipolysis and mitochondrial respiration. Downregulation of GSTA4 may, therefore, contribute to the pathogenesis of insulin resistance and type 2 diabetes. Its role in other diseases may also be significant.
50
3.2.8. The glutathione S-transferases and their role in epilepsy and
antiepileptic drugs: Current literature
The literature regarding the role of GSTs in epilepsy and its treatment is scarce, with very few published studies. There are, however, a small number of groups that have explored the role of certain cytosolic GST subclasses in epilepsy, or in their effect on AEDs.
Liu and Tsai (95) studied the effects of the null genotype GST Mu (GSTM1(-)) in a cohort of 1323 patients; 97 patients with epilepsy with good seizure control on anticonvulsant therapy, 35 patients with intractable seizures on anticonvulsant polytherapy, and 1191 healthy control subjects. Good seizure control was defined as fewer than 2 seizures a month with monotherapy, and intractable seizures were defined as a seizure frequency of greater than 4 per a month whilst taking a combination of anticonvulsants with effective monitoring of blood levels for at least four months. Patients with generalised tonic-clonic seizures or secondary generalised tonic-clonic seizures were included in the study, and the pharmaceutical agents prescribed, either alone or in combination, included phenytoin, carbamazepine, valproic acid, and phenobarbital. Both null genotype of GSTM1 and the plasma level of malondialdehyde (MDA) were determined for the groups of patients outlined above. MDA is a marker of oxidative stress, and was used to indirectly measure the level of lipid peroxidation in the patients. The results showed that the allele frequency of GSTM1(-) genotype of the patients with intractable epilepsy was significantly higher than those with well-controlled epilepsy (80% vs. 48.5%, OR = 4.3, p = 0.001) and healthy controls (80% vs. 49.5%, OR = 4.1, p = 0.001). It was therefore suggested that the null Mu genotype may be a significant genetic factor that contributes to the highly variable response to anticonvulsant therapy observed in clinical practise.
51
GSTM1(-) and GSTT1(-) were chosen due to their association with troglitazone-induced liver toxicity, a drug of the thiazolidinedione class used as an anti-glycemic agent whose licence was withdrawn following idiosyncratic hepatotoxicity. The study followed 192 Japanese epilepsy patients treated with carbamazepine, and the genotypes of GSTM1(-), GSTT1(-), and of microsomal epoxide hydrolase-3 and 4 (mEH-3, mEH-4), were determined. mEH is an enzyme involved in a wide range of reactions involving epoxide intermediates, where it is responsible for the addition of water to these substrates. The proportion GSTM1 null and GSTT1 null genotypes in their cohort were reported as 55.7% and 39.6%, respectively. In patients with these genotypes, the alanine aminotransferase (ALT) and aspartate aminotransferase (AST) were abnormally elevated in 24% of the
GSTM1 null patients, and 32.3% of the GSTT1 null patients, with levels rose by approximately 2.3- and 1.8-times that of the normal limit. When comparing both ALT and AST levels in the GSTM1 null vs. GSTM1 present genotypes, the levels were significantly higher in the former (ALT - p = 0.007 and AST – p = 0.004). The levels of ALT was significantly higher in GSTM1-/GSTT1- than in GSTM1+/GSTT1- and
GSTM1+/GSTT1+ (p = 0.01 and p = 0.01, respectively). Serum levels of AST was significantly higher in both GSTM1-/GSTT1- and GSTM1-/GSTT1+ than they were in
GSTM1+/GSTT1+ (p = 0.02 and p = 0.003, respectively). Genotype of mEH showed no significant association with hepatotoxicity. In summary, the group suggested that the
GSTM1 null genotype may be significantly associated with carbamazepine hepatotoxicity.
52
genotypes for the increase of GGT over the normal limit were 2.3 (95% CI 1.1 – 7.2) and 6.5 (95% CI 1.5 – 28), respectively. Liver function tests were not significantly affected by the GSTT1 genotype alone. In patients treated with VPA for greater than 6 months, ALT, AST and GGT were all significantly raised in the GSTM1- genotype compared to the
GSTM1+ genotype. The authors therefore concluded that both GSTM1- and GSTM1-/GSTT1- genotypes may be genetic risk factors for the particular increase of GGT in epilepsy patients treated with VPA.
In a research project conducted by Shang et al (81), 32 clinical cortex specimens were obtained following neurosurgical removal for intractable epilepsy. Several structural pathologies were seen, including hippocampal sclerosis, arteriovenous malformation, old infarct, and viral encephalitis. Eight non-epileptic patients who had undergone neurosurgery for arteriovenous malformations for reasons other than epilepsy were used as controls. Patients had been treated for over two years with at least 3 antiepileptic drugs, including phenytoin, phenobarbital, carbamazepine, valproate and topirimate to no effect, with patients experiencing at least 3 seizures per month in the preceding 6 months. Immunohistochemical techniques were employed to detect three GST isoforms in the cortex specimens: alpha, mu and pi. GSTA was not found in any specimens; GSTM was found in 63% of controls and 53% of intractable epileptic specimens; and GSTP showed immunoreactivity in 66% of the epilepsy patients compared with 50% of the controls (p < 0.01). These results suggest that high levels of GST pi may contribute to refractory epilepsy.
53
contribute to neuronal dysfunction that manifests as epilepsy, or indeed local increased metabolic activity may interfere with antiepileptic drug metabolism. A recent meta-analysis of two genome-wide association studies highlighted SNP variants in GSTA4 to be associated with pharmacoresistant epilepsy.
3.3. Pharmacogenetics and single nucleotide polymorphisms
Pharmacogenetics comprises the study of how the pharmacokinetic and pharmacodynamic factors of a drug vary between individuals owing to genetic differences in the population. It is thought that polymorphisms in drug transporters, channels, metabolising enzymes, etc, may explain to some degree the dose-response variation seen in clinical medicine, and may indeed explain the pharmacoresistant phenotype observed in several diseases (98). The ultimate goal of this area of science is personalised medicine – genotyping of individuals in order to predict their response to a drug, or predict which members of the population may react adversely to a particular drug.
54
Single nucleotide polymorphisms (SNPs) are variations within a single nucleotide, such that one base is switched for an alternate. In describing these variations, we refer to a SNP as having two alleles, such that a change from a cytosine (C) to thymine (T) (C>T) SNP would have C and T alleles, and the individual could be genotype CC, CT or TT. SNP variation is the commonest form of genetic variation, and there are thought to be in excess of 3 million common SNPs within the human population (12). The vast majority of these polymorphisms are in regions of the genome that have no functional significance, with protein function remaining unaltered. In order of perceived functional significance, there major categories of SNP are:
1) Non-synonymous a. Nonsense b. Missense 2) Splice site
a. 5’ splice site – upstream of the gene b. 3’ splice site – downstream of the gene 3) mRNA untranslated region (mRNA UTR)
a. 5’ UTR – upstream of the gene b. 3’ UTR – downstream of the gene 4) Synonymous
5) Intronic
SNPs within each of the above genomic regions may affect protein structure and, hence, may affect function in a variety of ways. Nonsense SNPs generally affect protein function most drastically, where they are responsible for premature stop-codons and the truncation of the polypeptide. It is also known that nonsense mutation can result in mRNA decay, resulting in the complete absence of the gene product – nonsense-mediated decay (103).
55
The process whereby intronic regions of DNA are removed and exonic regions are joined is termed splicing. SNPs within the splicing sites (either up- or downstream) of the gene thereby result in defected amino acid sequence and may impact upon the specificity of the transcribed protein.
SNPs within the mRNA UTR regions can also occur either up- or downstream of the gene. These regions of DNA are implicated in the binding of transcription factors and in the stability of the mRNA, and thereby variation within these sites may affect protein synthesis and overall protein structure in these ways.
Synonymous SNPs result in codon-triplets that code for the same amino acid as previously, and it was therefore first thought that these genetic variants were of no functional consequence. However, it is now recognised that certain codons translate for amino acids more readily and efficiently than others, and therefore these SNPs may also have a consequence for the overall gene product if the polymorphism is at a critical region.
56
3.4. Aims
57
Chapter 4
58
Chapter 4: Methods
4.1. SNP selection
4.1.1. HapMap
The HapMap project is an international collaboration between six countries whose aim is to produce a publically accessible database of the known genetic variation within Homo sapiens in order to advance the research of medical genetics and their effects on disease.
The HapMap database (accessible via: http://hapmap.ncbi.nlm.nih.gov/) was used to obtain the chromosomal coordinates of the GSTA4 gene using the genome browser #27 feature (details given below). Ten kilobases (kb) of DNA sequence were added up- and down-stream of these coordinates such that the 5’ upstream and 3’ downstream regions of the gene were confidently included in the search.
Table 4.1. Chromosomal coordinates of the GSTA4 gene
Gene Chromosomal position (kb) Expanded position (±10kb)
GSTA4 Chr 6: 52,950 – 52,968 Chr 6: 52,940 – 52,978
4.1.2. HaploView
59
This list was refined within HaploView by applying the following restrictions and rescoring the genetic markers:
- Hardy-Weinberg (HW) p-value = 0.001 - Minimum genotype: 75%
- Maximum number Mendelian errors: 1 - Minimum minor allele frequency: 0.001
This resulted in the identification of 48 SNPs representative of variation across the
GSTA4 gene region. Thereafter, the ‘Tagger’ function within HaploView was employed to generate a list of tagging SNPs that, owing to the LD structure across the GSTA4 gene region, would serve as markers for these 48 alleles and thereby reduce the number of SNPs required to genotype. The following criteria were set for the identification of tagging SNPs in Tagger:
- Pairwise tagging only - r2 value = 0.8
- LOD threshold for multi-marker tests = 3.0
60
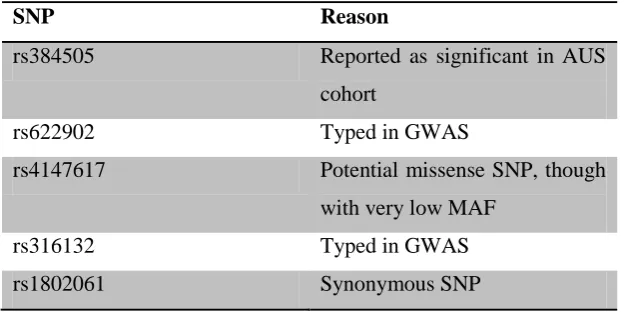
Table 4.2. List of forced inclusion SNPs
This resulted in the final identification of 17 SNPs across the GSTA4 gene region that would effectively (r2=0.978) capture all known genetic variation. Those tagging SNPs are listed in table 3.3, together with the alleles captured by each SNP.
SNP Reason
rs384505 Reported as significant in AUS cohort
rs622902 Typed in GWAS
rs4147617 Potential missense SNP, though
with very low MAF
rs316132 Typed in GWAS
61
Table 4.3. Tagging/test SNPs with captured alleles
Test Captured alleles
rs384505 rs384505
rs622902 rs622902
rs4147617 rs4147617
rs316132 rs612483, rs426013, rs584124,
rs316133, rs670960, rs316141, rs316129, rs316132, rs316140, rs613764, rs316131
rs1802061 rs17615213, rs1802061,
rs4986947, rs17614751
rs316128 rs375872, rs316135, rs375887,
rs428957, rs449690, rs385636, rs316128, rs419129, rs426169, rs387853
rs13191212 rs672822, rs669674, rs654144,
rs11967816, rs13191212, rs508078
rs6922246 rs6922246, rs1032419,
rs9463851
rs34511626 rs13219629, rs34511626
rs6904769 rs6904769, rs7496
rs3734431 rs3734431
rs16883343 rs16883343
rs17608022 rs17608022
rs6904771 rs6904771
rs396216 rs396216
rs3756980 rs3756980
62
4.2. Preparing a working-stock of DNA
Prior to plating out the DNA, each of the SANAD and Glasgow samples was Nanodroped® in order to obtain their original concentration. Thereafter, nanopure water was added to the stock DNA samples accordingly in order to obtain working-stock aliquots of 20µL at a concentration of 20ng/µL.
For stock concentrations that were too low, or for those samples that contained insufficient volume, these patients were excluded from the original eligible list. This resulted in 35 stock samples that were unusable from the SANAD cohort. All samples from the Glasgow cohort were usable.
The working-stock DNA was plated out into 96-well plates. For purposes of quality control, wells B3 and D7 were filled with nanopure water (blanks), and 8 controls taken from random wells were dispensed into wells H8 – H12 such that following the genotyping the results could be checked for concordance. The plates were then stored at -20oC until required.
4.3. TaqMan® genotyping
63
from the reporter molecule via fluorescence resonance energy transfer and therefore inhibits detection by the PCR detector. The probes are designed such that they anneal to a region of DNA that is amplified by a specific set of primers. When the Taq polymerase adds nucleotides to the template DNA, the reporter molecule is separated and is free to emit fluorescence that can be detected. Therefore, the amount of fluorescence emitted increases exponentially commensurate with the quantity of DNA and can be reported in real-time.
4.3.1. Plating DNA for PCR genotyping
The stored working-stock DNA was allowed to thaw from -20oC at room temperature and centrifuged at 1,500rpm for 30 seconds. Using an 8-channel multi-pipette, 1µL (20ng) of working-stock DNA was transferred into the alternate wells of a 384-well plate. In this way, four 96-well plates were transferred into one 384-well plate, and then placed in a vacuum centrifuge at room temperature for 5 minutes until the aqueous supernatant had evaporated and the dried DNA was left. If required, this could be sealed and stored at -20oC for future use.
4.3.2. Preparation of polymerase chain reaction solution