An Ultrastructural Study of the Role of Clathrin as
an Inter-Microtubule Bridge in Kinetochore Fibres
_____________________________________________
Daniel George Booth
ID: 200512334______________________________________
University of Liverpool
Thesis submitted in accordance with the requirements of the University of Liverpool for the degree of Doctor in Philosophy
Daniel George Booth
Abstract
The mitotic spindle is required for the accurate segregation of an equal number of chromosomes, into two separate daughter cells. The movement of chromosomes is carried out by kinetochore fibres (K-fibres) of the spindle apparatus, these extend from the cell pole and terminate at attachment on the kinetochore. K-fibres are composed of bundles of individual kinetochore microtubules (kMTs). Microtubule (MT) bundling is coordinated by inter-MT bridges, which are thought to promote MT stability and organisation. The inter-MT bridges in K-fibres have never been fully characterised.
Clathrin is a triskelion-structured protein with a well-characterised role in membrane trafficking, where it forms the ‘coat’ of clathrin-coated vesicles. More recently clathrin has been shown to have an unrelated function during mitosis: a period of the cell cycle when membrane trafficking is dormant. The depletion of clathrin by RNAi results in a number of mitotic defects, all of which are a consequence of destabilised K-fibres. It has been proposed that a TACC3/ch-TOG/clathrin complex physically cross-braces kMTs to stabilise K-fibres.
1) a loss of kMTs, 2) a decrease in kMT organisation and 3) a loss of a population of short inter-kMT bridges. Immunogold labelling confirmed that clathrin was a component of the inter-kMT bridge.
The literature typically refer to inter-MT bridges as electron dense ‘struts’ that cross-link MTs, however, a few classic EM studies have described bridges as ‘filamentous’ with ‘multiple projections’. A highly resolved view of bridge structures was sought. Using high-pressure freezing with freeze-substitution, tomography and 3D rendering, this project revealed that a novel structure was present that cross-linked kMTs, we have termed this structure ‘inter-kMT mesh’. The mesh was found exclusively between kMTs and appeared to promote kMT organisation through multiple contacts with MTs. The mesh responded to manipulated levels of TACC3 expression, resulting in disorganised K-fibre bundles, misshapen kMTs and an enhanced electron-dense inter-kMT mesh.
Table of Contents
Pre Chapter Contents
Page
Title page
1
Abstract
2
Table of contents
4
Acknowledgments
13
Abbreviations
14
List of figures
16
1
Chapter 1: Introduction ... 19
1.1
The cell cycle ... 19
1.2
Stages of mitosis ... 21
1.2.1 Prophase ... 21
1.2.2 Prometaphase ... 21
1.2.3 Metaphase ... 22
1.2.4 Anaphase ... 24
1.2.5 Telophase ... 24
1.3.1 Microtubules ... 26
1.3.2 Ultrastructure of the metaphase spindle ... 28
1.3.2.1 Astral microtubules ... 29
1.3.2.2 Inter-polar microtubules ... 29
1.3.2.3 Kinetochore microtubules ... 31
1.4
Microtubule cross-linking proteins ... 35
1.4.1 Inter-MT bridges in K-fibres ... 36
1.4.2 Characterised inter-MT bridges ... 38
1.4.3 Other MT-associated bridges ... 40
1.5
Candidates for the inter-MT bridges of K-fibres ... 41
1.6
Clathrin ... 43
1.6.1 Structure ... 43
1.6.2 Clathrin and membrane trafficking ... 46
1.6.3 Clathrin in mitosis ... 48
1.6.4 The function of clathrin in mitosis is distinct from membrane trafficking ... 49
1.6.5 Clathrin as an inter-MT bridge ... 50
1.6.6 Clathrin requires MT binding partners to localise to the spindle53
2
Chapter 2: Materials and Methods ... 56
2.1
Molecular biology ... 56
2.1.1 Reagents ... 56
2.1.2 Generation of DNA constructs ... 56
2.1.3 PCR amplification of DNA ... 59
2.1.4 Separation of DNA by agarose gel electrophoresis ... 59
2.1.5 Extraction of DNA from agarose gels ... 60
2.1.6 Restriction endonuclease digestion of DNA ... 60
2.1.7 Ligation of DNA insert into vector ... 61
2.1.8 Bacterial transformation of DNA constructs ... 61
2.1.9 Recovery of DNA from bacterial cultures ... 62
2.1.9.1 Wizard® Plus SV Miniprep Kit ... 62
2.1.9.2 Qiagen HiSpeed Midi Kit ... 63
2.2
Cell Biology ... 63
2.2.1 Reagents ... 63
2.2.2 Cell lines ... 64
2.2.3 Cell culture ... 64
2.2.4 Transfection of DNA plasmids ... 64
2.2.6.1 Generating liquid nitrogen cell stocks ... 66
2.3
Microscopy ... 67
2.3.1 Reagents ... 67
2.3.2 Light Microscopy ... 67
2.3.2.1 Routine fixation and mounting ... 67
2.3.2.2 Indirect immunofluorescence ... 67
2.3.3 Electron Microscopy ... 68
2.3.3.1 Preparation of formvar coated copper grids ... 68
2.3.3.2 Correlative light electron microscopy (CLEM) processing ... 68
2.3.3.3 Immunogold labelling ... 69
2.3.3.4 Preparation of cells for high pressure freezing (HPF) and Freeze substitution (FS) ... 70
2.4
Data Collection and Analysis ... 71
2.4.1 Longitudinal analysis of inter-microtubule bridges by TEM ... 71
2.4.2 Orthogonal analysis of kinetochore fibre microtubules ... 71
2.4.3 Gold particle quantifications ... 71
2.4.4 Tomography and 3D rendering ... 72
2.4.5 Statistical testing ... 73
3.2
Aims ... 78
3.3
Method ... 78
3.4
Results and discussion ... 79
3.4.1 Correlative microscopy dishes and seeding density ... 79
3.4.2 Optimising spindle preservation ... 81
3.4.3 Preparation of CLEM samples for longitudinal sectioning ... 83
3.4.4 Preparation of samples for orthogonal sectioning ... 86
3.4.5 Characterising K-fibres ... 87
3.4.6 Is 2D imaging sufficient for a kMT analysis? ... 91
3.4.7 A single tilt analysis is sufficient for a kMT study ... 93
3.4.7.1 Counting/quantifying kMTs ... 95
3.4.7.2 Inter-MT distances ... 97
3.4.7.3 K-fibre cross sectional area ... 97
3.4.8 Establishing inter-MT bridge analysis ... 98
3.4.8.1 Maintaining a consistent sectioning depth ... 98
3.4.8.2 Analysed spindle regions were chosen at random ... 99
3.4.8.3 Extracting data from MIAs ... 99
stabilises kinetochore fibres through inter-MT bridging . 103
4.1
Introduction ... 103
4.2
Chapter aims ... 104
4.3
Materials and methods ... 104
4.3.1 Generation of pBrain vectors to express GFP and shRNA ... 104
4.3.1.1 Generation of pBrain-SpH-shRNA ... 104
4.3.1.2 Generation of pBrain-GFP-shRNA ... 105
4.3.2 Immunofluorescence microscopy ... 105
4.3.2.1 Testing RNAi efficiency of pBrain constructs using immunofluorescence microscopy ... 106
4.3.3 Correlative light electron microscopy (CLEM) ... 106
4.3.3.1 Quantification of CCVs at the spindle ... 106
4.4
Results ... 107
4.4.1 Clathrin localises to the spindle during mitosis ... 107
4.4.2 Clathrin at the spindle is not assembled in CCVs ... 107
4.4.3 Target proteins can be depleted using pBrain vectors ... 111
4.4.4 Depletion of clathrin induces loss of kMTs ... 115
inter-MT bridges ... 119
4.4.7 Clathrin localises to inter-MT bridges in K-fibres ... 122
4.4.8 Depletion of TACC3 causes loss of inter-kMT bridges ... 127
4.4.9 Ch-TOG depleted K-fibres were extremely disorganised ... 129
4.5
Discussion ... 133
5
Chapter 5 – K-fibres contain an inter-MT ‘mesh’ ... 137
5.1
Introduction ... 137
5.2
Chapter aims ... 139
5.3
Materials and methods ... 139
5.3.1 Indirect immunofluorescence of cold-stable HeLa cells ... 139
5.3.2 High pressure freezing and freeze substitution ... 140
5.3.2.1 Preparation of HeLa cells for HPF and FS ... 140
5.3.2.2 High pressure freezing and freeze substitution ... 141
5.3.2.3 SDS-PAGE separation of protein ... 141
5.3.2.4 Western blotting ... 142
5.4
Results ... 144
5.4.1 Tomography improves the resolution of inter-MT cross-linking structures ... 144
5.4.4 TACC3 expression levels and kMT organisation ... 156
5.4.4.1 Overexpression of TACC3 alters K-fibre morphology ... 156
5.4.4.2 Altering the levels of TACC3 in HeLa cells ... 161
5.4.4.3 K-fibres overexpressing TACC3 are disorganised ... 162
5.5
Discussion ... 169
6
General discussion ... 173
7
Appendices ... 176
7.1
Oligonucleotides for TACC3 and ch-TOG shRNA ... 176
7.2
The role of KIF4 in midbody formation ... 177
7.3
Inhibition of Aurora A kinase destabilises kinetochore fibers
179
7.4
Publications ... 181
Acknowledgements
An ‘acknowledgements page’, the only section of this thesis that will have never come into contact with red pen. Firstly, I would like to thank my supervisors Ian Prior and Steve Royle. Steve has been enthusiastic and supportive throughout my PhD, continually providing help and advice whenever requested. Thankyou to all the members of my lab and the EM unit, past and present, particularly to Anna, Fi and Ali who have given me help, advice and cake many times over the last four years. I would also like to thank the various post-doc, PhD and masters students that I have become friends with during my PhD, particularly Rob Jenn, who has been a great friend, formidable beer drinking partner and average player of FIFA. Several non-scientists also need acknowledging, these would include: my parents, who have provided me with support before, during and hopefully after my time at university; my friends from back home, many of whom I have now known for nearly 25 years. They have provided me with a sanctuary away from my scientific bubble whenever I have needed it; and finally to my long-suffering girlfriend Gemma, who I love and adore, who has (mostly) never complained that we have only been on one holiday together during the last four years.
The acknowledgements will finish with two quotes; the first is thought-provoking in both a scientific context and life in general, the second is a quote that has provided me with comfort and relief whilst writing this thesis.
“Not everything that can be counted counts and not everything that counts can be counted” – Albert Einstein
Abbreviations
2D 2-Dimensional
3D 3-Dimensional
aMT Astral microtubules
APC/c Anaphase promoting complex/cyclosome APS Ammonium persulfate
ARF ADP-ribosylation factor BSA Bovine serum albumin CCP Clathrin coated pit CCV Clathrin coated vesicle
ch-TOG Colonic-hepatic-tumour over expressed gene CHC Clathrin heavy chain
CHO Chinese hamster ovary CIP Calf intestinal phosphatase CLC Clathrin light chain
DMEM Dulbecco’s modified eagle’s medium DNA Deoxyribonucleic acid
EDTA Ethylenediaminetetraacetic acid EM Electron microscopy
ER Endoplasmic reticulum FBS Fetal bovine serum FS Freeze substitution
G1 Gap-phase 1
GGA Golgi-localised, gamma adaptin ear-containing, ARF binding HPF High pressure freezing
IP Immuno-precipitation ipMT Inter polar microtubules K-Fibre Kinetochore fibre
kMTs Kinetochore microtubules
LM Light microscopy
MAP Microtubule associated protein MIA Multiple image alignment MTs Microtubules
PNK Poly nucleotide kinase PSe Adobe Photoshop Elements
RT Room temperature
SEM Standard error of the mean SpH Synapto-pHluorin
TACC3 Transforming acidic coiled-coil protein 3 TBE Tris-Borate EDTA
TBS Tris buffered saline
TEM Transmission electron microscopy TEV Tobacco etch virus
TGN Trans-golgi network UA Uranyl acetate
UV Ultra violet
List of figures
Chapter 1 Introduction
Figure 1.1 Cell cycle regulation and progression……….21
Figure 1.2 A schematic diagram to show the stages of mitosis………...24
Figure 1.3 Microtubule assembly and architecture………..28
Figure 1.4 Composition of metaphase microtubules………....31
Figure 1.5 K-fibres and kMT attachment at the kinetochore………...34
Figure 1.6 Inter-MT bridges in human K-fibres………..38
Figure 1.7 Clathrin triskelia, CCV architecture and endocytosis………..……..45
Figure 1.8 Clathrin is a candidate for an inter-MT cross-linker in K-fibres……51
Chapter 2 Materials and methods
Figure 2.1 Vector maps for pBrain-GFP-shRNA and pTRE2hyg-GFP- TACC3(KDP)……….58Figure 2.2 Method for gold labelling quantifications………..72
Chapter 3 Establishing and optimising a series of EM techniques to
analyse kMTs and inter-MT bridges
Figure 3.1 Correlative Light Electron Microscopy (CLEM)………...74Figure 3.2 Two axes for sectioning through the mitotic spindle………..76
Figure 3.3 Gridded dishes and optimal seeding densities for CLEM…………..79
Figure 3.4 Osmolarity of fixative solutions influences cell preservation………81
Figure 3.6 A pictorial guide to block preparation for orthogonal CLEM………87
Figure 3.7 Serial sections discriminate kMTs from other MT populations…….89
Figure 3.8 A tilt series improves kMT coverage………..91
Figure 3.9 Single tilt series offer high coverage of kMTs………...93
Figure 3.10 Methods for quantifying kMT number, inter-MT spacing and cross sectional area………..95
Figure 3.11 Quantification methods for longitudinal bridge analysis………99
Chapter 4 A
TACC3/ch-Tog/Clathrin
complex
stabilises
kinetochore fibres through inter-MT bridging
Figure 4.1 Clathrin localises to the mitotic spindle………107
Figure 4.2 CCVs are not enriched in the mitotic spindle………...108
Figure 4.3 pBrain vectors allow efficient depletion of target proteins………...111
Figure 4.4 K-fibres have fewer microtubules following clathrin depletion…...112
Figure 4.5 Clathrin depletion leads to an increase in inter-kMT spacing……..115
Figure 4.6 Clathrin depletion reduces inter-MT bridge frequency………119
Figure 4.7 Clathrin-depleted kinetochore fibres exhibit a change in bridge length distribution………120
Figure 4.8 Clathrin-depleted K-fibres exhibit loss of a population of short inter-MT bridges………122
Figure 4.9 Clathrin is localised to inter-MT bridges in K-fibres………...124
Figure 4.10 TACC3-depleted K-fibres exhibit a loss of inter-MT bridges……..127
Figure 4.12 Depletion of ch-TOG disrupts spindle morphology……….130
Figure 4.13 A model demonstrating TACC3/ch-TOG/clathrin and MT
binding……….134
Chapter 5 K-fibres contain an inter-MT ‘mesh’
Figure 5.1 Inter-MT cross-linkers possess structural diversity………..137
Figure 5.2 Tomography of K-fibres reveals complex, inter-MT, cross-linking structures………...144
Figure 5.3 High pressure freezing allows 3D modeling of inter-MT mesh…...147
Figure 5.4 Mesh is found exclusively between kMTs and not throughout the cytosol………...150
Figure 5.5 Inter-MT mesh shows a weak association with kMT displacement.151
Figure 5.6 Structural reinforcement is lowest at the K-fibre periphery……….154
Figure 5.7 TACC3 overexpression influences K-fibre morphology…………..156
Figure 5.8 TACC3 expression levels can be regulated using doxycycline and RNAi……….158
Figure 5.9 TACC3 overexpression results in disorganised and misshapen
kMTs……….162
Figure 5.10 TACC3 overexpressing K-fibres exhibit disorganised kMTs and a dense inter-MT mesh ………..………165
Chapter 7 Appendices
Figure 7.1 RNAi sequences and shRNA designs for entry into pBrain vector system ………..175
Figure 7.2 The role of KIF4 in midbody formation………. ………177
1
Chapter 1: Introduction
1.1
The cell cycle
Once the stages of interphase have been completed the cell can progress into mitosis. The purpose of mitosis is to equally segregate two copies of the genome into two daughter cells. To do this the mitotic spindle moves the sister chromatids to opposite poles of the cell (Rieder, 1982, Rieder, 2005, Scholey et al., 2003).
1.2
Stages of mitosis
1.2.1 Prophase
During prophase, chromatin condensation is initiated. Here, duplicate copies of DNA begin restructuring into chromosomes (Koshland and Strunnikov, 1996), this is due the condensin II complex of proteins (Hirano, 2005). The chromosomes are pairs of sister chromatids, one destined for each daughter cell. The centrosomes, which were duplicated during interphase, show an increase in microtubule (MT) nucleation and begin repositioning, one either side of the nucleus (Figure 1.2 B). Each centrosome nucleates a radial array of dynamically unstable MTs known as asters (Ault and Rieder, 1994). Finally, the breakdown of the nuclear envelope begins.
1.2.2 Prometaphase
known as mono-orientation. At this point, the chromosome remains only partially stable until bi-oriented by MT attachment of the other sister chromatid (Ault and Rieder, 1994). MTs that become stably attached to a kinetochore are referred to as kinetochore MTs (kMTs) (Tanaka, 2010). Other non-kinetochore MTs that do not associate with chromosomes begin to extend from the cell poles towards the cell equator. These inter-polar microtubules (ipMTs) can be diverse in length, but can also interact with other ipMTs from the opposite pole (Mastronarde et al., 1993). The aim of prometaphase is to align the chromosomes at a plane equidistant between the cell poles, this is known as the metaphase plate.
1.2.3 Metaphase
The APC/c is activated by cell-division cycle protein 20 (cdc20), from here the APC/c mediates two primary functions; targeting securin (see 1.2.4) and cyclins for degradation (Peters, 2002), this drives chromosome separation and mitotic exit, respectively. The SCF ubiquitinates cyclin-dependent-kinase inhibitors (CKIs) such as p27 and p21 (Morgan, 1995), targeting them for proteosome degradation, hence promoting cell cycle progression (Nakayama and Nakayama, 2005).
1.2.4 Anaphase
The purpose of anaphase is to start the migration of sister chromatids towards the cell poles (Figure 1.2 E), an action facilitated by the pulling action of K-fibres of the spindle apparatus (Scholey et al., 2003). Before movement can occur, the sister chromatids must be separated from one another. Securin, a protein complex that binds to and inhibits separase throughout most of the cell cycle, becomes degraded during the metaphase-to-anaphase transition (Uhlmann et al., 1999). Cohesin, the central mediator responsible for the cohesion of sister chromatid arms, is cleaved by the active form of separase (Uhlmann et al., 2000). As chromosomes are pulled apart, the formation of the spindle midzone is simultaneously triggered (Figure 1.2 E). As late anaphase approaches, ipMTs are repositioned into the gap left between the dividing chromosomes (Straight and Field, 2000). Midzone microtubules consist of a tight bundle of mostly anti-parallel MTs, these dictate the position of the cleavage plane, an area the cell will later use as its division point (Field et al., 1999).
1.2.5 Telophase
endoplasmic reticulum (ER) (Larijani and Poccia, 2009). In addition, the MTs of the midzone become even more concentrated (Figure 1.2 F), with the continued recruitment of bundling proteins such as the protein regulator of cytokinesis 1 (PRC1). The CDK mediated phosphorylation of PRC1 during prophase renders it inactive until dephosphorylation during anaphase. The active form of PRC1 orchestrates the spatiotemporal regulation of midzone MTs (Zhu et al., 2006).
1.2.6 Cytokinesis
Cytokinesis can be described as the creation of two daughter cells, from one adult cell, following mitosis. During cytokinesis, invagination of the plasma membrane increases in response to the continued reorganization of actin and formation of the contractile ring (Salmon, 1989). The furrow continues to ingress synchronously from all sides of the cell until it becomes compressed against the MTs composing the central spindle, the result is the formation of the midbody (Figure 1.2 G) (Salmon and Wolniak, 1990). The spindle midbody is the focal point for abscission, the finale of cell division, where the two daughter cells become completely isolated from one another. Abscission events are driven by the ESCRT III membrane-remodeling proteins (Carlton and Martin-Serrano, 2007).
1.3
The mitotic spindle
this project is primarily concerned with the metaphase spindle, this introduction will focus on the structure of the spindle apparatus during this stage of mitosis.
1.3.1 Microtubules
Microtubules are non-covalent polymers of the protein tubulin. Like many other cytoskeleton proteins, tubulin is well conserved throughout evolution and is expressed in all dividing eukaryotic cells (Burns, 1991). MT subunits are composed of heterodimers of α-tubulin and β-tubulin. The α- and β-tubulin monomers share
~50% homology at the amino acid (AA) level (Sullivan, 1988). Tubulin heterodimers of mammalian MTs arrange into thirteen linear protofilaments, these are associated laterally into cylindrical tubes that contain a hollow lumen (Figure 1.3), the diameter of a MT is ~23 nm (Desai and Mitchison, 1997). Although protofilament number in mammals is thirteen, this can vary in other species and MT based organelles (Figure 1.3 B) (Bohm et al., 1984). To assemble into a MT the protofilaments form outwardly curved tubulin sheets, which gradually close to form MT cylinders (Vitre et al., 2008, Mahadevan and Mitchison, 2005). The study of MTs at the ultrastructural level is only possible using electron microscopy (EM).
To assemble into microtubules, α- and β- tubulin dimers bind to
guanosine-5'-triphosphate (GTP). Following the energy transfer, β-tubulin, in a GTP bound
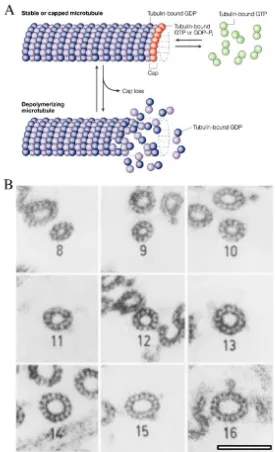
Figure 1.3 – Microtubule assembly and architecture. (A) A schematic diagram showing microtubule assembly from α- and β- tubulin dimers. GTP-bound tubulin
Whether or not a tubulin dimer is in a GTP or GDP bound state, directly influences MT stability, where GTP bound dimers favour polymerisation and GDP bound dimer favour deploymerisation (Heald and Nogales, 2002). A change in MT flux from polymerisation (growth) to deploymerisation (shrinkage) is known as catastrophe, the reversal of this process is referred to as MT rescue (Howard and Hyman, 2003).
1.3.2 Ultrastructure of the metaphase spindle
The metaphase spindle is composed of three major classes of microtubule: astral microtubules (aMTs), inter-polar microtubules (ipMTs) and kinetochore microtubules (kMTs) (Figure 1.4). During prophase and prometaphase, MT asters nucleate from the centrosomes, an event reliant of the presence of γ-tubulin, the key
unit on the γ-tubulin ring complex, a structure that acts as a scaffold for MT
polymerisation (Martin et al., 1997, Moritz and Agard, 2001). MTs in asters can follow one of three paths: 1) they nucleate towards and eventually attach to a chromosome, in which case they become kMTs; 2) they nucleate away from the cell cortex, towards the cell equator, but are not involved in chromatid capture, in which case they become ipMTs; 3) they nucleate towards the cell cortex, becoming aMTs (Ault and Rieder, 1994, Tanaka, 2010).
However, one study quantified that the spindle of the fungus, Neetria haematococca, contained 37% aMTs (Jensen et al., 1991). This number is unlikely to be representative for mammalian spindles due to the vast difference in cell size and overall spindle architecture.
1.3.2.1 Astral microtubules
Astral MTs nucleate from the centrosome and contact the cell cortex, here they associate with the actin cytoskeleton (Kunda and Baum, 2009), a relationship governed by the multisubunit motor complex, dynein (Markus and Lee, 2011, Millar et al., 2004). Astral MTs have a role in spindle orientation and therefore the positioning of the division plane during cytokinesis (Wuhr et al., 2009). Ultrastructurally, aMTs are not organised into compact bundles, rather, they remain freely isolated from one another (Vogel et al., 2007).
1.3.2.2 Inter-polar microtubules
The MTs of metaphase cells that extend from the cell pole towards the opposite pole but do not target a kinetochore, are known as inter-polar microtubules (ipMTs). These are diverse in length and sometimes interact with microtubules from the opposite pole. Inter-polar MTs are thought to provide spindle stability by coordinating the spindle poles and are also involved in spindle elongation during anaphase (Snyder et al., 1986, Mcdonald et al., 1992).
Figure 1.4 – Composition of metaphase microtubules. A schematic diagram (left) and fluorescence micrograph (right) showing an overview of a mitotic cell in metaphase. The spindle is assembled from three microtubule sub-types (green); astral microtubules (aMTs), that nucleate away from the spindle and usually towards the cell cortex; kinetochore microtubules (kMTs), that extend from the cell pole and terminate at an attachment on the kinetochore (located on the front of each sister chromatid); inter-polar microtubules (ipMTs), that extend from the cell pole towards the chromosomes, but have no kinetochore attachment, rather, they remain unattached at the MT plus end, or they interact with other ipMTs from the opposite spindle pole. Scale bar, 4 µm.
A peak in MT density is seen half way between the spindle pole and the metaphase plate, this frequency decreases at each side of this position, as either the cell equator or the cell pole is approached. Less than 25% of ipMTs terminate within 1 µm of the cell pole and only 10% extend from one cell pole and attach at the opposite pole (Mcdonald et al., 1992, Mcintosh and Landis, 1971). The remaining ipMTs terminate within their own half spindle or part way through the opposing half spindle. Although there is still a relatively high frequency of ipMTs within close proximity or passing through the cell equator, these show almost no preference for bundling (2 – 4 ipMTs per bundle), this preference is increased slightly as the onset of anaphase approaches (2 – 6 ipMTs per bundle). The ipMTs found close to the cell equator contain a mixture of parallel and anti-parallel MTs, where anti-parallel MTs comprise 55-70% of the total ipMT population (Brinkley and Cartwright, 1971). The parallel ipMTs are only weakly associated with one another, whereas the anti-parallel ipMTs are more strongly associated. The small bundles of anti-parallel ipMTs present during metaphase are thought to be the forerunners for MTs of stem bodies, the precursors of the spindle midbody (Mastronarde et al., 1993, Mcintosh et al., 1975). As mitosis progresses the distribution of inter-ipMT spacing become more uniform, an event that is attributed to the increase in anti-parallel ipMTs, i.e. the forming of stem bodies and eventually the midzone (Mastronarde et al., 1993).
1.3.2.3 Kinetochore microtubules
Joglekar, 2010, Compton, 2007, Rieder, 1981). These movements occur in large part due to the loss or addition of tubulin subunits to elongate or shorten the kMTs.
Biophysical experiments suggest that K-fibres can exert large forces, far in excess of what is required to move a chromosome through the viscous cytosol (Nicklas, 1988). It is also possible for a K-fibre to move a chromosome through pushing (Mitchison and Kirschner, 1985).
Kinetochore MTs are packed into bundles (Figure 1.5 B, C, E & F) where they are referred to as kinetochore fibres (K-fibres). The number of kMTs per bundle varies between species and cell types, ranging from 1 in Saccharomyces cerevisiae to 120 in Haemanthus (Bajer, 1973). The K-fibres of higher mammals
typically contain 20-40 kMTs per bundle (Bajer, 1973, Mcdonald et al., 1992, Mcintosh et al., 1975, Rieder, 1982) with human spindles containing ~30 kMTs per bundle (Mcintosh and Landis, 1971). Other examples would include the K-fibres of Schizosaccharomyces pombe (4-6 kMTs), Drosophila melanogaster (11 kMTs)
The outer kinetochore is a structure that attaches the chromosome directly to kMTs (Figure 1.5). Both the inner and outer kinetochore are composed of dense protein clusters, such as the Ndc80 complex, a necessity for kMT-kinetochore attachment (Sullivan et al., 2001).
Unlike ipMTs, the MTs of a K-fibre are well organised and deviate very little from their course at the point of origin at the cell pole, until termination at the kinetochore (Mcdonald et al., 1992, McIntosh et al., 1979). It has been shown that ipMTs can infiltrate a K-fibre periodically throughout its length. Within close proximity to the kinetochore this infiltration is minimal, towards the cell pole the frequency of ipMTs within the K-fibre increases, an expected occurrence due to the sheer volume of MTs at the spindle pole. Although these ipMTs appear to be part of the K-fibre, they display large levels of displacement throughout the half spindle length and show no or a very weak association with kMTs (Mcdonald et al., 1992, Witt et al., 1981).
In summary, of the three types of MT in the metaphase spindle, only kMTs and anti-parallel ipMTs are well-organised into bundles. Of these the K-fibre is easily distinguished on the basis of its size. It is well established that MT bundles in cells are organised by cross-linking proteins (Peterman and Scholey, 2009, Rubinstein et al., 2009). The kMTs of a K-fibre are similarly organised by cross-linkers (Hepler et al., 1970, Witt et al., 1981).
1.4
Microtubule cross-linking proteins
MT cross-linkers are almost exclusively referred to as ‘bridges’, although they are sometimes termed ‘arms’.
1.4.1 Inter-MT bridges in K-fibres
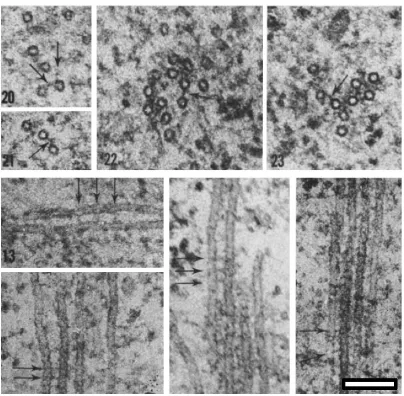
Inter-MT bridges have been observed in K-fibres, where they are thought to promote kMT organisation and stability (Bastmeyer and Fuge, 1986, Hepler et al., 1970, Mcdonald et al., 1992, Witt et al., 1981), however, these have never been fully characterised in molecular terms. Inter-kinetochore microtubule (inter-kMT) bridges have been observed in a number of species. Examples include the African blood lily, Haemanthus katherinae (Hepler et al., 1970), the crane fly (Bastmeyer and Fuge,
1986), Chinese hamster (CHO) cells (Witt et al., 1980) and finally, human spindles (Figure 1.6) (Hepler et al., 1970). Regardless of the species, inter-kMT bridges appear structurally similar throughout, measuring 2-5 nm in width and 20-40 nm in length. In human cells they are most frequently ~20 nm in length (Figure 1.6) (Hepler et al., 1970).
Bastmeyer et al. analysed bridges in the meiotic spindle of the crane fly, observing that the dimensions of bridges were variable, ranging between 6 and 30 nm in length and 4 and 19 nm in thickness (Bastmeyer and Fuge, 1986). This study also revealed that the frequency of inter-MT bridges was directly proportional to MT density and frequency of paired MTs, i.e. the greater the number of paired MTs the higher the incidence of bridges. They suggested that a greater density of MTs would require more structural support and organisation, hence the increase in bridge frequency.
They observed a ‘fine filamentous material’ that cross-bridged kMTs. The bridges were approximately 5 nm wide and 30-40 nm long and often appeared to attach at an acute angle rather than perpendicular to the MT wall. In addition, they also noted that one MT can crosslink to at least four other MTs. Witt et al. went on to hypothesise that bridges could provide a structural role, by tethering the kMTs together into one mechanically coherent bundle, suggesting that this would be more efficient at propagating force from the cell pole to the chromosome (Witt et al., 1981).
Hepler et al. observed ‘bridges’ and ‘arms’ that cross-bridged kMTs and MTs of the midzone in human cells (Figure 1.6). They considered these bridges to be similar in appearance, measuring about 2-5 nm in width and 20-40 nm in length, regardless of the MT subtype they were associated with. They also noted that bridges were both straight and curved, occurring at various tilt angles relative to the MT surface and also that one MT could have multiple projections. This study also noted that inter-MT bridges appeared to be observed periodically along the length of MTs with gaps of 10, 20, 30 and 40 nm, suggesting that particular MT binding sites are available (Hepler et al., 1970).
1.4.2 Characterised inter-MT bridges
studies (Hu et al., 2011). Overexpression of PRC1 results in the extensive bundling of interphase MTs (Mollinari et al., 2002).
In summary, PRC1 is currently the best-studied inter-MT bridge in the spindle apparatus, where it functions by bundling non-kinetochore MTs during late mitosis. Depletion of PRC1 or its binding partner KIF4 results in a reduction of midzone integrity as a consequence of poorly organised MTs. The knock-on effect of this phenotype is the loss of midbody assembly and therefore a loss of docking sites for other essential abscission proteins.
1.4.3 Other MT-associated bridges
In addition to inter-MT bridges of the spindle, bridges have also been studied elsewhere, some examples would include: microtubules of flagella, cilia and axostyle (Tilney, 1971, Roth et al., 1970, Barton, 1969) or the interstitial cells of the adult cricket, Gryllus assimili, which contain microtubules that are interconnected by 12-14 nm long arm-like structures (Friedman, 1971). Another well-studied example is MAP2, one of the most abundant MAPs in the brain. MAP2 mainly localises to the somatodendritic compartments in neurons, where it has been shown to promote neurite-growth through stabilisation of MTs by cross-bridging (Matus, 1994). Overexpression of MAP2 resulted in excessive MT bundling (Hirokawa, 1994, Takemura et al., 1992). In addition, the Purkinje cell dendrites of MAP2 knock-out mice exhibit morphologically atypical inter-MT bridges, compared to those from controls (Harada et al., 2002).
membranes (Franke et al., 1971). Although bridges have been observed cross-linking a variety of structures, it is inter-MT bridges in K-fibres that are the least understood and the focus of this project.
1.5
Candidates for the inter-MT bridges of K-fibres
To test the function of inter-kMT bridges, the identity of this protein or complex of proteins needs to be discovered. A short list of potential candidates has been proposed, these include; HSET, hepatoma up-regulated protein (HURP) and clathrin.
as an inter-MT bridge, some flaws in the experimental procedures were apparent. First, there is no mention of how gold label that was on or near to the MT wall is discriminated from particles ‘between’ MTs. This is odd given that it appears they have not taken into account the potential combined length of the primary and secondary antibodies (up to 16 nm (Ottersen, 1989)) in their proximity measurements. Second, although this study has proposed HSET as an inter-MT bridge and rightly used EM to test this, no mention has been given to the bridges present in their representative micrographs, which, although apparently poorly preserved (perhaps as a result of the cytosolic washout), did not appear to be associated with any gold particles.
HURP, is a MAP that is thought to promote spindle stability and enhance microtubule polymerisation by reducing the turnover rate of α/β-tubulin subunits on
1982). If this is true, then due to its localisation, HURP is unlikely to be a bridge in K-fibres.
The third candidate for inter-MT bridges is clathrin, the focus of this project.
1.6
Clathrin
1.6.1 Structure
Clathrin is triskelion-structured protein assembly composed of three heavy (190 kDa) and three light (25–27 kDa) chains (Kirchhausen and Harrison, 1981). During interphase, the triskelion shape of the clathrin molecule allows it to form the polyhedral lattice or ‘coat’ that covers clathrin coated vesicles (CCVs) and clathrin coated pits (CCPs) (Brodsky et al., 2001) (Figure 1.7 B). The molecular composition of a clathrin triskelion is defined in a model generated using electron cryo-microscopy combined with existing crystal-structure knowledge (Fotin et al., 2004). A single clathrin heavy chain (CHC) molecule possesses: an N-terminal seven-bladed β-propeller (residues 1-330), a linker region, eight clathrin heavy-chain
Atomic force microscopy of isolated clathrin triskelia show that each leg has a contour length of ~52 nm and a radius of ~2 nm (Jin and Nossal, 2000). Individual clathrin triskelia are capable of huge structural diversity due to the potential bending angles at the triskelion hub, knees and ankles, this is best shown using a specialist type of electron microscopy, pioneered by John Heuser, known as ‘deep-etch’ (Figure 1.7 C). This technique yields 3D micrographs that contain high levels of topological detail (Heuser, 1981, Heuser, 2011). Heuser has published numerous studies containing images of clathrin triskelia in a variety of geometric positions (Heuser, 1980, Heuser and Kirchhausen, 1985, Heuser and Keen, 1988), some examples are shown in Figure 1.7 C. The panel on the far left shows a particularly nice example of two triskelia in remarkably different configurations. The length of the triskelion at the top of the panel, from N-termini to N-termini is approximately half the length of the triskelion at the bottom of the image (Figure 1.7 C).
1.6.2 Clathrin and membrane trafficking
1.6.3 Clathrin in mitosis
In addition to its role in membrane trafficking, clathrin also performs a ‘moonlighting’ role during mitosis (Royle and Lagnado, 2006, Royle et al., 2005, Royle, 2006). It is generally accepted that mitosis is a phase of the cell cycle where endocytosis remains dormant (Warren, 1993), however, this notion has been challenged on occasion (Boucrot and Kirchhausen, 2007). During some periods of mitosis the surface area of the cell decreases (Ohnuma et al., 2006, Boucrot and Kirchhausen, 2007). For this reason, Boucrot et al hypothesised and tested that the observed reduction in receptor-mediated endocytosis of transferrin, during mitosis, could be related to the decrease in the surface area of the cell, and not necessarily a net reduction in endocytic activity (Boucrot and Kirchhausen, 2007).
demonstrated by a disorganised metaphase plate and an increase in the number of cells with misaligned chromosomes. Second, an increase in inter-kinetochore distance as a consequence of a reduction in K-fibre tension (Waters et al., 1996). Third, a twofold reduction in proliferation, as a result of an increase in the mitotic index, i.e. cells had difficulty progressing through mitosis. These mitotic defects could be attributed to destabilised K-fibres, demonstrated by a loss of kinetochore attachment or a lack of tension, leading to the continued activation of the spindle checkpoint (Royle et al., 2005). A role of clathrin in mitosis is further supported by similar results observed in tobacco BY-2 cells (Tahara et al., 2007), porcine oocytes (Holzenspies et al., 2010) and other human studies (Fu et al., 2010, Lin et al., 2010).
1.6.4 The function of clathrin in mitosis is distinct from membrane
trafficking
assembled into coated vesicles then major endocytic adapters should also be present (Robinson, 2004). This was tested using indirect immunofluorescence, where none of AP-1, AP-2 or AP-3 were present at the spindle (Royle et al., 2005). Third, a clathrin mutant was generated that could not function in endocytosis, but could rescue mitosis (Royle and Lagnado, 2006). Another clathrin mutant has been tested that cannot localise to microtubules but can still function in endocytosis (Hood and Royle, 2009). More recently, clathrin mutants that can only dimerise and therefore not assemble into a coated lattice, could still function in mitosis (Blixt and Royle, 2011). Collectively, these data imply that clathrin at the spindle is functioning independently from its role in membrane trafficking.
Royle et al. showed that the NTD is required for spindle binding multimerising is required for mitotic function, they hypothesised that this would allow clathrin to cross-link MTs of the spindle.
1.6.5 Clathrin as an inter-MT bridge
This was confirmed by the cold-treatment of mitotic cells to depolymerise all other MT subtypes, followed by anti-clathrin immunocytochemistry (Royle et al., 2005).
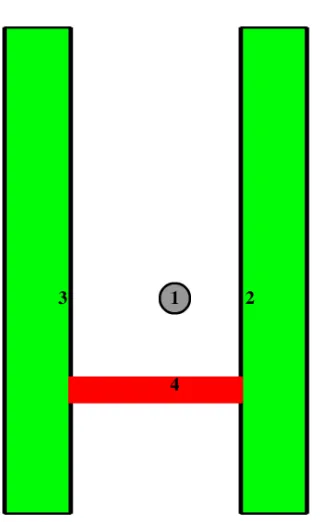
similar to a scaled model of a clathrin/MT assembly (Figure 1.8). It appears that this type of direct testing, analysing the bridges ultrastructurally, provide the best evidence for screening bridge candidates.
only using Xenopus TACC3 (maskin) and Xenopus cytostatic factor (CSF) extract (Fu et al., 2010).
Of these four studies, Booth et al. was the only one to isolate and purify the native TACC3/ch-TOG/clathrin complex, from mitotic spindle preparations. This complex was only found to be present at the spindle and not assembled in the cytosol (Booth et al., 2011).
1.6.6.2 Recruitment of the TACC3/ch-TOG/clathrin complex
Whilst the four groups that identified the TACC3/ch-TOG/clathrin complex are in agreement that spindle clathrin is in a complex with TACC3 and ch-TOG, the order of recruitment to the spindle is contentious.
There are two models for the recruitment of the TACC3/ch-TOG/clathrin complex to K-fibres. In the first, clathrin recruits TACC3 and ch-TOG to kMTs (Lin et al., 2010, Fu et al., 2010, Hubner et al., 2010), in the other, TACC3 is the primary recruitment factor (Booth et al., 2011). The best evidence for clathrin as the mediator of recruitment is that, depletion of clathrin reduces the amount of TACC3 at the spindle (Lin et al., 2010, Hubner et al., 2010, Fu et al., 2010, Booth et al., 2011), however, this is contradicted by other results suggesting it is TACC3 that is the primary recruitment factor. The depletion of TACC3 has been shown to block clathrin recruitment (Booth et al., 2011). Furthermore, the overexpression of TACC3 enhances clathrin recruitment to the spindle, whereas overexpression of clathrin has no effect on TACC3 recruitment (Booth et al., 2011). In addition, clathrin cannot bind directly to microtubules, instead, it requires the presence of mitotic cytosol (Booth et al., 2011). In contrast, maskin, a TACC3 homolog expressed in Xenopus, can bind directly to microtubules, with an equivalent Kd to
other MAPs (Peset et al., 2005, O'Brien et al., 2005)
TACC3/ch-2
Chapter 2: Materials and Methods
2.1
Molecular biology
2.1.1 Reagents
Wizard® Plus SV Miniprep Kit (#1581MB09_9A) was purchased from Promega (Southampton, UK). Midiprep (#27106), gel extraction (#28604) and PCR purification (#28704) kits were all obtained from QIAgen (Crawley, UK). All restriction enzymes: HindIII, BglII, EcoRI, NheI and ApaLI; NEB buffers; Quick-Loading 1kb DNA ladder (#NO468G); calf intestinal phosphatase (#M0290S); T4 polynucleotide kinase buffer (#B0201S); T4 polynucleotide kinase (#M0201S); Quick ligase buffer (#B2200S); Quick ligase (#M2200L); MgSO4 (#B0254S) were
purchased from New England BioLabs (Hertfordshire, UK). Bovine serum albumin (BSA) (#A8022); Kanamycin disulfate salt (#K1876); Tryptone (#T9410); sodium chloride (#S8875); Trizma®base (T1503); ethylenediaminetetraacetic acid disodium
salt dihydrate (EDTA) (#E1644) and all oligonucleotides were ordered from Sigma Aldrich (Poole, UK). Yeast extract (#BP1422) and boric acid (#B376053) were obtained from Fisher Scientific (Loughborough, UK). Pfu Turbo® DNA polymerase
(#600250-52) and Pfu 10X reaction buffer (#600152-82) were obtained from Agilent (Edinburgh, UK).
2.1.2 Generation of DNA constructs
The molecular biology carried out during this project was focused on
The rationale for using the pBrain series of vector was to generate a dual promoter plasmid capable of expressing an shRNA together with a fluorescent reporter. To express shRNA targeting TACC3 or ch-TOG, complementary sense and anti-sense oligonucleotides were designed. These were annealed to become a double stranded DNA cassette that could be directly ligated into a pBrain-SpH vector. The oligonucleotide RNAi regions were designed according to published sequences where efficient knock down had been reported (Gergely et al., 2003). This pBrain-SpH-shRNA vector expressed synapto-pHluorin (SpH) as the fluorescent reporter. A fragment of pBrain-SpH-shRNA was removed and inserted into a pEGFP-C1 vector, to change the fluorescent reporter to give pBrain-GFP-shRNA (Figure 2.1 A). See 4.3.1 for a more comprehensive methodology.
The pTRE2hyg-GFP-TACC3(KDP) vector (Figure 2.1 B) is compatible with HeLa Tet-On® cells from Clontech (Mountain View, CA, USA), allowing the stable
Figure 2.1 – Vector maps for pBrain-GFP-shRNA and pTRE2hyg-GFP-TACC3(KDP). (A) pBrain-GFP-shRNA individually expresses GFP (green) and an shRNA (cyan) under the control of H1 (orange) and CMV (red) promoters. (B)
[image:58.595.154.487.108.595.2]2.1.3 PCR amplification of DNA
DNA was amplified by PCR using a Techne TC-312 thermocycler, in the following 50 µl reaction: DNA template, 100 ng; deoxyribonucleotide triphosphate (dNTP), 2.5 mM; 10X Pfu reaction buffer, 5 µl; DMSO, 5% v/v; magnesium sulfate (MgSO4), 1.0 mM; sense and anti-sense oligonucleotide primers, 0.5 µM; Pfu
Turbo® DNA polymerase, 2.5 U; to a final volume of 50 µl using dH2O. The
thermocycler parameters were set as:
• Denaturing - 95°C, 40 s
• Annealing - primer Tm –5°C, 1 min • Extension – 72°C, 1 min per 1 kb DNA • Cycles - 36
Prior to usage, the DNA products amplified by PCR were resolved using agarose gel electrophoresis, extracted from the gel and finally, purified.
2.1.4 Separation of DNA by agarose gel electrophoresis
Gels were prepared by combining electrophoresis grade agarose (0.8 - 1.1% v/v) with 100 ml 0.5X TBE (Tris-base, 45 mM; boric acid, 45 mM; EDTA, 10 mM, pH 8.3), the solution was heated in a microwave until the agarose was fully dissolved. Ethidium bromide was added to a concentration of 0.5 µg/ml. The gel was poured into a mould and left to set at room temperature. Samples were mixed with 6X loading buffer (bromophenol blue, 0.25%; xylene cyanol FF, 0.25%; glycerol, 30%; in water) and the DNA resolved in a horizontal midi electrophoresis tank containing 0.5X TBE, at ~100 V using a BioRad PowerPack™. A 1 kb DNA
using an ultra violet (UV) light source. If the DNA was required for further stages of cloning, gel extraction and purification of the appropriate band was performed.
2.1.5 Extraction of DNA from agarose gels
All centrifugations during the QIAquick Gel Extraction Kit (Qiagen) purification were for 1 min at 16,000 x g unless otherwise stated. The appropriate band was excised from an agarose gel and dissolved in Buffer QG at 50°C. The DNA was precipitated using isopropanol before collection in the membrane of a QIAquick spin column, by centrifugation. DNA was washed using 750 µl of Buffer PE. The flow through was discarded and the column centrifuged once more, removing any remaining residual ethanol that was present in the wash buffer. The DNA was eluted into a clean 1.5 ml microfuge tube with 50 µl of Buffer EB and centrifugation. DNA abundance was estimated by measuring the optical density of the DNA solution at 260nm wavelength (OD260), using a spectrophotometer
(Eppendorf, BioPhotometer).
2.1.6 Restriction endonuclease digestion of DNA
2 h. In the case of vector digestions, 10 U of calf intestinal phosphatase (CIP) was introduced after ~1.5 h.
2.1.7 Ligation of DNA insert into vector
A typical 21 µl ligation reaction was made up as follows: vector, 1 µl (or 50 ng); DNA insert, 2 µl (or a 1:3 molar ratio of vector:insert); water, 7 µl; Quick ligation buffer (2X), 10 µl; Quick ligase, 1 µl. The reaction was incubated at room temperature for 10-15 min. A negative control of digested vector only (1 µl vector and 9 µl water, i.e. no DNA insert), was also assembled in preparation of transformation into ultra-competent bacteria.
2.1.8 Bacterial transformation of DNA constructs
Post-ligation, DNA constructs were amplified by transformation into chemically ultra-competent E-Coli DH5α bacteria (donated by Maria Blixt) using
the following protocol: 100 µl of DH5α bacteria was added to 1 µl of ligation mix
The following morning, single colonies were selected and removed using a 10 µl pipette tip, suspended in 5 ml LB (containing 50 µg/ml of appropriate antibiotic) and incubated overnight in an orbital shaker (37°C, 200 rpm).
2.1.9 Recovery of DNA from bacterial cultures
Depending on the scale of bacterial culture either a Wizard® Plus SV
Miniprep Kit or Qiagen HiSpeed Midi Kit was used for the recovery of DNA. Miniprep kits were used when DNA was required for cloning and midi-kits were used when the DNA was required for transfection.
Prior to DNA recovery, 850 µl of bacterial culture was retained and combined with 150 µl glycerol. With the glycerol serving as a cryo-protectant, the DNA transformed bacterial stock was stored at -80°C.
2.1.9.1 Wizard® Plus SV Miniprep Kit
2.1.9.2 Qiagen HiSpeed Midi Kit
The bacterial culture (~100 ml) was pelleted by centrifugation at 4°C for 15 min at 6000 x g. The supernatant was discarded and the pellet homogenously resuspended in 4 ml Buffer P1, added to this was 4 ml of Buffer P2. The bacterial lysate was mixed thoroughly and incubated at RT for 5 min after which 4 ml of chilled Buffer P3 was added. The bacterial lysate was decanted into a QIAfilter Cartridge and left for 10 min, during which time a HiSpeed Midi Tip was equilibrated by applying 4 ml of Buffer QBT. The column was allowed to empty by gravity flow. The bacterial lysate was then filtered through a QIAfilter Cartridge into the previously equilibrated HiSpeed Tip using a syringe. The cleared lysate was allowed to enter the resin by gravity flow. The HiSpeed Tip was washed with 20 ml of Buffer QC after which the DNA was eluted using 5 ml of Buffer QF. The eluted DNA was precipitated using 3.5 ml of isopropanol, mixed and left to incubate at RT for 5 min. The DNA precipitate was transferred into a QIAprecipitator where it was washed with 2 ml of 70% ethanol, it was then eluted using 1 ml of Buffer TE.
2.2
Cell Biology
2.2.1 Reagents
2.2.2 Cell lines
HeLa cells are a human cell line derived from epithelial cervical carcinoma. HeLa cells (#93021013) were purchased from HPA Cultures (Solisbury, UK).
HeLa Tet-On cells® (Clontech) are a human cervical epithelioid carcinoma-derived cell line that expresses the reverse tetracycline - controlled transactivator (rtTA). An inducible, gene expression system can be generated by stably transfecting these cells with a plasmid that expresses the gene of interest under the control of a Tet Response Element (TRE), (see 2.2.6 for the methodology used to generate a stable cell line).
2.2.3 Cell culture
Cells were routinely cultured at 37°C in a humidified 5% CO2 incubator in
plastic tissue culture flasks containing Dulbecco’s Modified Eagle’s Medium (DMEM) (Invitrogen), supplemented with 10% foetal bovine serum (FBS) and 1% penicillin/streptomycin sulphate. In the case of HeLa Tet-On cells, the medium was also supplemented with G418 (300 µg/ml).
Adherent cells were passaged upon reaching 80 – 95% confluency using 0.25% trypsin EDTA (#T4049). To passage, the cell media was removed and cells washed with warm phosphate buffered saline (PBS) (Fisher Scientific), before incubation in trypsin EDTA at 37°C until the cells had become detached. Cells were resuspended in fresh DMEM (containing supplements) and re-seeded into a new flask at an appropriate density (typically a 1:10 dilution).
2.2.4 Transfection of DNA plasmids
glass coverslips when necessary) 24 hours prior to transfection. On the day of transfection the cell media was replaced with 1 ml fresh DMEM (containing supplements) and the following protocol used per well: 1.5 µl of GeneJuice was added to 50 µl of Optimem (Invitrogen) and incubated for 10 min; 0.5 µg of DNA was added and incubated for a further 10 min. The transfection solution was added to the cells and the plasmid left to express for an appropriate length of time.
2.2.5 Transfection of siRNA
The procedure for transfecting cells with siRNA was as follows: 17 µl of oligofectamine (Novagen) was added to 73 µl of Optimem media (containing no supplements), in parallel, 11 µl of siRNA (20 µM), was added to 1000 µl of Optimem media. Both the oligofectamine and siRNA solutions were left to incubate separately for 10 min. The two solutions were then combined and incubated for a further 10 min. The transfection solution was added to the 10 cm dish (making a total volume of ~5.5 ml). The media was replaced with fresh DMEM (containing supplements) after 6 hr. Cells were left to allow protein depletion for the appropriate amount of time, in the case of TACC3 this was 72 hr.
2.2.6 Generation of a stable cell line
HeLa TetOn® pTRE2hyg-GFP-TACC3(KDP) cells are a dual stable HeLa
cell line capable of expressing GFP-TACC3(KDP) after induction using doxycycline (doxycycline was a gift from Professor Bill Earnshaw, University of Edinburgh). This cell line was generated by stably transfecting HeLa TetOn® cells with a
G418 (300 µg/ml and hygromycin (200 µg/ml). The antibiotics killed any cells that were not stable TetOn® HeLas or stable with pTRE2hyg. Selection was carried out
over a course of 7-14 d, until colonies of cells (comprising ~100 – 200 cells per colony) could be seen under a tissue culture dissection microscope. Approximately 75 individual, lightly trypsinised colonies were picked using a 10 µl pipette tip and suspended (in fresh DMEM containing G418 and hygromycin) into a 12 well plate, one colony per well. Over a number of days the colonies were expanded, first into a 6 well plate and eventually into 10 cm dishes. During passaging a small proportion of cells were seeded onto glass coverslips and screened for stable expression and functionality of GFP-TACC3(KDP) using fluorescence microscopy (2.3.2.1)
following induction with doxycycline (0.5 µg/ml, 24 h). As a result of the fluorescence screen it was possible to identify six appropriate clones, these were chosen for continued culturing, in addition, liquid nitrogen stocks were also created (see below). The remaining clones were discarded.
2.2.6.1 Generating liquid nitrogen cell stocks
2.3
Microscopy
2.3.1 Reagents
Paraformaldehyde powder (#15812-7) was purchased from Sigma Aldrich (Poole, UK). Microscope slides (#ISO 8037/1) were purchased from Thermo Scientific. Triton X 100 (#BP151-500) was purchased from Fischer Scientific.
All reagents for TEM were purchased from Agar Scientific (Essex, UK) unless otherwise stated. The Dip Miser Set (#T083) was purchased from ProSciTech (Thuringowa, Australia).
2.3.2 Light Microscopy
2.3.2.1 Routine fixation and mounting
Cells were fixed using paraformaldehyde (3% PFA, 4% sucrose in PBS) at RT for 15 min or using 100% methanol for 15 min at -20°C. Cells were washed with PBS before the cover slips were mounted onto glass slides using mowiol (a gift from Samantha Williams). The mountant was left to set at RT overnight.
2.3.2.2 Indirect immunofluorescence
2.3.3 Electron Microscopy
2.3.3.1 Preparation of formvar coated copper grids
Hexagonal 200 mesh copper grids (#G2410C) were coated with formvar (#T083) (0.2% formvar in 100% chloroform). A new glass slide was polished using chamois leather before being inserted into a Dip Miser containing formvar. The glass slide was withdrawn from the Dip Miser at an appropriate speed, generating a slide homogenously coated with a thin layer of formvar plastic. Once dry, the edges of the formvar coat were scored using a razor and the slide immersed in water, allowing the plastic coat to become detached from the glass slide and reside on the surface of the water. Factory fresh copper grids were transferred onto the plastic using forceps before being collected onto a new, clean, glass slide. Coated grids were left to dry for at least 2 h before use.
2.3.3.2 Correlative light electron microscopy (CLEM) processing
which samples were washed, firstly using buffer A (3 x 20 min) and secondly with ddH2O (2 x 20 min). Cells were then washed in 30% ethanol (30 min) before
incubation in uranyl acetate (0.5% in 50% ethanol) for 1 h, after which cells were dehydrated in a series of eight graded ethanol washes (30 - 100%) at 5 – 10 min per incubation. Samples were incubated in 100% ethanol (2 x 20 min) followed by infiltration with ethanol:resin mixes (2:1 and 1:1 respectively) for 20 min per mix, before being covered in 100% resin. At this stage cells were left for 30 min before curing at 60°C for ~48 h.
If cells were to be analysed longitudinally, then prior to placement in the oven, a gelatin capsule (#G29211) of resin would be placed on top the cell(s) of interest. Following resin polymerisation, samples were trimmed and sectioned using a Leica UC 6 microtome and DiATOME Ultra diamond knife. Before TEM, the grids were routinely post-stained using lead citrate and uranyl acetate (5% in 50% ethanol). See Chapter 3 for comprehensive details on CLEM processing.
2.3.3.3 Immunogold labelling
HeLa cells were seeded into CLEM dishes and transfected (as described in
2.2.4) with plasmids expressing GFP-CHC or GFP-α-Tubulin. Following a 48 h
1.5 h after which cells were labelled with one of: GFP, CHC (X22) or
anti-α-tubulin primary antibodies in blocking solution for 1 h. Cells were washed in
buffer A three x 5 min, before incubation in the appropriate gold-conjugated secondary antibody, in block, for 1 h. Following secondary antibody labelling the cells were washed with buffer A (three x 5 min) and post-fixed (3% glutaraldehyde in buffer A) for 15 min. At this stage, cells exhibiting spindle GFP fluorescence were chosen for CLEM using a Nikon TE2000U microscope and subjected to EM processing and resin embedding (as described in 2.3.3.2). Following resin polymerisation, samples were trimmed and sectioned using a microtome and diamond knife. See Chapter 3 for more comprehensive details on CLEM processing.
2.3.3.4 Preparation of cells for high pressure freezing (HPF) and Freeze substitution (FS)
2.4
Data Collection and Analysis
2.4.1 Longitudinal analysis of inter-microtubule bridges by TEM Random areas of the spindle were chosen at a low magnification (~12,000 x), after which a high magnification 4x4 multiple image alignment (MIA) was taken at 60,000 x. Images were taken at 100 kV using an FEI Tecnai G2 Spirit BioTWIN microscope. Following image capture the MIAs were analysed using AnalySIS®
(Soft Imaging System). The following were measured: total microtubule (MT) length, paired MT length (regions of single MTs within 80 nm bridging distance of each other), bridge frequency and length of inter-MT bridges. Data were imported into Microsoft Excel spreadsheets where parameter means and SEM were calculated. Multi-peak fitting was done using Multipeak Fitting 2 in Igor Pro 6.12. Data analysed using Igor Pro was carried out by or with the help of, Steve Royle.
2.4.2 Orthogonal analysis of kinetochore fibre microtubules
K-fibres within 1.5 µm of the metaphase plate were imaged using a single-axis tilt series. An audio-visual interleave (*.avi) file of the tilt was imported into ImageJ where MTs were mapped and annotated allowing a matrix of co-ordinates to be generated. Using this matrix, the inter-MT distance, MT frequency and K-Fibre cross-sectional area were calculated.
2.4.3 Gold particle quantifications
Immunogold labelling of GFP-α-tubulin and GFP-CHC was quantified using
2.4.4 Tomography and 3D rendering
[image:72.595.230.390.338.599.2]Tilt series of resin sections were acquired using a tilt range between -60° and +60°. All *.mrc files (the output file produced when generating a tilt series) were reconstructed into tomograms using IMOD 4.1 (Boulder Laboratory for 3-Dimensional Electron Microscopy of Cells and the Regents of the University of Colorado). Serial join tomography was carried out using the ‘tomogram join’ sister-software of IMOD. All *.rec files (the output file format of IMOD) were rendered into 3D models using the Amira 3.1 software package.
2.4.5 Statistical testing