Article
Antibacterial and Corrosion Resistance Properties of
Anodized
AA6061
Aluminum Alloy
Nattapon Pornnumpa
1,2and Manthana Jariyaboon
2,3,*1 Materials Science and Engineering Program, Faculty of Science, Mahidol University, Bangkok 10400,
Thailand
2 Center for Surface Science and Engineering, Faculty of Science, Mahidol University, Nakhon Pathom
73170, Thailand
3 Department of Chemistry, Faculty of Science, Mahidol University, Bangkok 10400, Thailand
*E-mail: manthana.jar@mahidol.ac.th (Corresponding author)
Abstract. Anodizing is one of the surface treatments for aluminum and its alloys. It is commonly used to increase corrosion resistance and mechanical properties. This technique is also applied for decorative purpose. Therefore, anodized aluminum alloys are widely used in many applications such as household structure, cell-phone case, automobile and aircrafts. Anodic aluminum oxide (AAO) structure, which has a pore at the center of each hexagonal cell arrangement, is created after anodizing process. To further enhance the property of anodized aluminum alloys, antibacterial property can be produced on AAO surface by deposition of nanoparticles into its pore structure. In this work, AA6061-T6 aluminum alloy was anodized at 12 V using 20%w/v H2SO4 at temperature of 17±1°C for 30 minutes.
AgNO3 solution was used for producing Ag nanoparticles. Effects of AgNO3
concentrations on antibacterial and corrosion resistance properties of anodized AA6061 aluminum alloy were studied. Antibacterial property was investigated on both gram-positive (S.aureus) and gram-negative (E.coli) bacteria according to JIS Z 2801 standard test for three months after exposure to ambient environment. 100% reduction of S.aureus was achieved, whereas 97.3% reduction of E.coli was obtained when using 1mM AgNO3. However, the
deposition of Ag nanoparticles resulted in a slight increase in corrosion susceptibility.
Keywords: Anodized aluminum, antibacterial, corrosion.
ENGINEERING JOURNAL Volume 23 Issue 4 Received 3 May 2019
1.
Introduction
AA6061 is an aluminum alloy containing magnesium and silicon as major alloying elements. Because of its alloying elements, AA6061 shows good corrosion resistance, machinability, weldability and good anodizing response. It is extensively used in many applications such as household structure, cell-phone case and automobile [1-3]. Although AA6061 has good corrosion resistance, corrosion problem still occurs due to intermetallic particles in the alloy. Therefore, several surface treatments are commonly used to protect the alloy from corrosion attack. Anodizing is one of them. Anodizing process creates anodic aluminum oxide (AAO) film on the surface via electrochemical reactions. The anodic aluminum oxide film is composed of two layers that are inner barrier layer and outer porous layer. The inner barrier layer plays an important role on corrosion resistance because of its compact dense structure. The outer porous layer is hexagonal cell arrangement having single cylindrical pore at the center of each cell resulting in its absorption property [4, 5]. Thus, several properties can be improved after anodizing process such as good interface adhesion, good surface appearance, improvement of mechanical as well as anti-corrosive properties [6, 7]. However, accumulation of microorganism on the surface can still emerge on some areas, where the proper cleaning cannot be reached leading to biocorrosion problem.
Biocorrosion correlates with microorganism on the metal surface, especially bacteria. Bacteria can attach and agglomerate on the surface to form biofilm causing suitable conditions for corrosion. Inside the biofilm, there are many bacterial colonies that live in, which excrete metabolic waste and change environment underneath the biofilm [8]. Hence, the prevention of bacterial attachment on the surface can reduce biocorrosion attack.
Silver nanoparticles (AgNPs) are well known as one of the antibacterial agents because they can prevent in broad spectrum of both gram-positive and gram-negative bacteria. They were reported that they could kill even fungi, yeast, as well as virus [9]. Hence, there are many products using AgNPs as antibacterial agents such as disinfectant for wound cleaning, laundry machine and clothes [10]. So, it is interesting to develop anodized aluminum alloy surface enhanced with antibacterial property by deposition AgNPs into the anodic aluminum oxide film.
In general, anodizing process has three significant steps. The first step is surface preparation to control quality of the surface. The second step is anodizing to create anodic oxide film and the last step is sealing process to close up oxide pores. In order to obtain the anodized aluminum surface with antibacterial property, four main methods have been patented [11-14]. (i) Electrodepositing antibacterial metalsinto the porous surface layer of anodized aluminum [11]; this method is cheap, simple and fast; however color of the anodized aluminum produced from this method may be limited by metals used in electrodeposition process. (ii) Coating organo-silane layer with antibacterial property on the anodized aluminum surface [12]; this method is time and energy-consuming process since several steps of heat treatments must be applied to obtain organo-silane layer. (iii) In-situ thermal reduction [13]; cations (i.e., Ag+) in solution are thermally reduced to obtain
nanoparticles with antibacterial property and at the same time they are deposited into porous layer during sealing step of anodizing process. Drawback of the in-situ thermal reduction method is that the temperature used to synthesizing nanoparticles must be the same as those used in the sealing step. (iv) Soaking anodized aluminum into a suspension mixture containing nanoparticles with antibacterial performance and sealing agent [14]; this method provides pore sealing layer distributed with nanoparticles. The precise control of size of nanoparticles in the suspension is needed and aggregation of nanoparticles must be avoided.
2.
Experimental
2.1. Material
AA6061-T6 sheet with a thickness of 1 mm was used in this work. It was purchased from C-line limited Partnership, Thailand. The chemical composition of this alloy was shown in Table 1. Specimens were cut into dimensions of 50x50x1 mm3 and 30x30x1 mm3 for antibacterial and electrochemical tests, respectively.
Table 1. The chemical composition of AA6061-T6 (wt%) [3].
Alloy Si Fe Cu Mn Mg Cr Zn Ti Al
6061-T6 0.4-0.8 0.7 0.15-0.40 0.15 0.8-1.2 0.04-0.0.35 0.25 0.15 Balanced
2.2. Synthesis of Silver Nanoparticles (AgNPs)
Silver nanoparticles (AgNPs) were synthesized by in-situ chemical reduction. Silver nitrate (AgNO3) solution
was reduced by 0.1% w/v trisodium citrate (Na3C6H5O7) at 96±1°C. Volume ratio of AgNO3 solution to
trisodium citrate was 10 to 1 [15]. The concentrations of AgNO3 solution used in this workwere 0.5 mM and
1 mM.
2.3. Anodizing Process and Deposition of Silver Nanoparticles (AgNPs)
AA6061-T6 sheet was ground using SiC paper upto 1200 grit no. It was then put in 8%w/v NaOH followed by 6%w/v HNO3 for etching and desmutting, respectively. It was anodized in 20%w/v H2SO4 at 12 V with
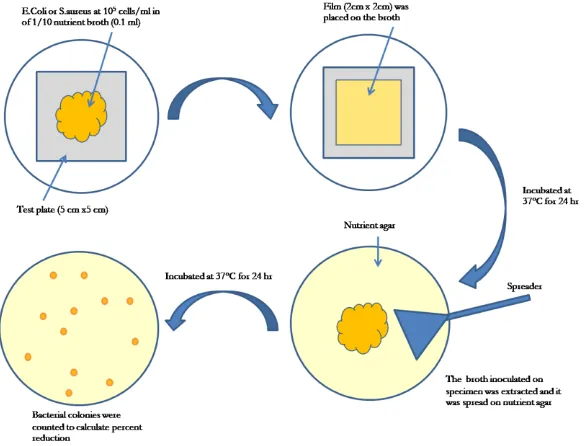
a temperature of 17±1°C for 30 minutes. AgNPs were deposited into the anodic aluminum oxide film after the oxide film was created by dipping the specimen into silver nitrate solution as described in Section 2.2. Finally, it was sealed by soaking in boiled water at temperature of 96°C for 25 minutes. Figure 1 illustrates a method of how to produce the anodized AA6061-T6 with antibacterial property.
Fig. 1. Schematic diagram showing a method of fabrication anodized AA6061-T6 with antibacterial property.
2.4. Antibacterial Standard Test
Antibacterial performances of the anodized AA6061-T6 without and with AgNPs deposition were investigated monthly according to JIS Z 2801 standard test [16] for three months after exposing to environment as illustrated in Fig. 2. E.coli and S.aureus bacteria were used as gram-negative and gram-positive bacteria, respectively.
The specimens were sterized by UV-exposing for 30 minutes on each side before testing, after that bacteria were inoculated on the surfaces. Incubation was performed by an incubator (Daihan Labtech CO., LTD, Model LIB-060M) at 37°C for 24 hrs. After incubation, the bacteria on the surfaces were extracted and diluted to make 10-fold serial dilutions. Each dilution was spreaded on a new petri dish containing nutrient agar and it was then incubated at 37°C for 24 hrs again. Bacterial colonies having the number of colonies in a range of 30-300 colonies were counted to determine viable cellsper cm2, colony forming unit per cm2
(CFU/cm2), according to Eq. (1).
[image:3.595.135.463.456.522.2]where N= number of viable cells (per 1 cm2 of test piece)
C = number of colonies (CFU) D=dilution factor
V= volume of broth used towash out A=surface area of covering film (cm2)
CFU/cm2 was used to calculate antibacterial activity and percent reduction of bacteria as shown in Eq. (2)
and (3), respectively.
(Ut 0) ( t 0) t t
R U A U U A (2)
where R=antibacterial activity
Uo = average of logarithm numbers of viable bacteria immediately after inoculation on untreated
specimens
Ut = average of logarithm numbers of viable bacteria after inoculation on untreated specimens after
24 hrs
At = average of logarithm numbers of viable bacteria after inoculation on antibacterial treated
specimens after 24 hrs
%reduction (A U U) 100 (3)
where A = average value of viable bacteria after inoculation on antibacterial treated specimens after 24 hrs U = average value of viable bacteria after inoculation on untreated specimens after 24 hrs
Fig. 2. Schematic diagram of JIS Z 2801 standard test.
2.5. Electrochemical Test
To measure potentiodynamic polarization curves, a three-electrode system was used with an Autolab (PGSTAT302N) potentiostat. Reference and counter electrodes were a saturated Ag/AgCl and a platinum rod, respectively. AA6061-T6 with an exposure area of 1 cm2 was a working electrode. The potentiodynamic
[image:4.595.152.445.389.612.2]2.6. Microstructural Characterization
Microstructures of the anodized AA6061-T6 were investigated using field emission scanning electron microscopy (FE-SEM, FEI – Versa 3D Dual Beam) equipped with energy dispersive X-ray spectroscopy (EDS, EDAX/Oxford Instruments). Specimens were coated with gold. FE-SEM/EDS was operated at 20 kV.
3.
Results and Discussion
3.1. Macroscopic Appearance of the Anodized AA6061-T6
Macroscopic images of the anodized AA6061-T6 without and with AgNPs deposition were shown in Fig. 3. As seen in Fig. 3, matte surfaces with unique texture were obtained for both cases due to the anodic aluminum oxide film structure. Color of the anodized AA6061-T6 without AgNPs was grey. In case of those with AgNPs, slight yellow shade appeared on the surface due to the color of AgNPs. Therefore, AgNPs were deposited on the anodized AA6061-T6 without significant effect on decorative application.
Fig. 3. Macroscopic images of the anodized AA6061-T6. (a) without AgNPs and (b) with AgNPs deposition.
3.2. Microstructure of the Anodized AA6061-T6
Top-view FE-SEM images at 100,000 magnifications of the anodized AA6061-T6 without and with AgNPs deposition synthesized using 0.5 mM and 1.0 mM AgNO3 are illustrated in Fig. 4. In case of without AgNPs
deposition (0 mM AgNO3), there were unsealed and sealed areas on the anodic oxide film layer of the
anodized AA6061-T6 as displayed in Fig. 4(a). After deposition of AgNPs, the microstructure was changed as displayed in Fig. 4(b) and (c). The surfaces showed more sealed areas. However, “discrete uncovered area”, which was quite deep, was observed in black color. Increase in AgNO3 concentrations reduced “the discrete
uncovered area”. In addition, it should be noted that the structure of anodic oxide film (cross-section view) could not be seen even at high magnification FE-SEM. The thickness of the anodic oxide film for all conditions was approximately 12 µm.
Fig. 4. Top-view FE-SEM images of the anodized AA6061-T6at 100,000magnifications. (a) 0 mM AgNO3,
[image:5.595.186.409.293.400.2] [image:5.595.75.530.597.709.2]Figures 5and 6 show EDS point analysis and EDS mapping analysis of cross-section FE-SEM images of the anodized AA6061-T6 with AgNPs deposition synthesized using 0.5 mM and 1 mM AgNO3,
respectively. AgNPs were found near the surface of the anodic oxide film. AgNPs with a size of approximately 6 µm were seen as illustrated in Fig. 6 indicating agglomeration of silver nanoparticles. In addition, it should be pointed out that AgNPs could not be detected by EDS analysis on the top-view of the surface. This is very surprising, since 100% antibacterial efficiency was achieved as reported in section 3.3.
Fig. 5. EDS point analysis of the anodized AA6061-T6 with AgNPs deposition synthesized using 0.5 mM AgNO3.
Fig. 6. EDS mapping analysis of the anodized AA6061-T6 with AgNPs deposition synthesized using1 mM AgNO3.
3.3. Antibacterial Efficiency
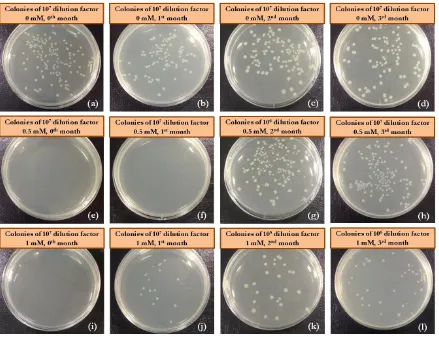
The measurements were carried out every month according to JIS Z 2801 for three months with 0.5 mM and 1.0 mM AgNO3 solutions. Figures 7 and 8 display typical bacterial counted plates of gram-negative (E.coli)
and gram-positive bacteria (S.aureus), respectively. Images of different dilution factors were illustrated depending on the number of colonies obtained in plates; it must be in a range of 30 to 300 colonies in order to be able to count by naked eyes. However, if the number of colonies in plates of all dilution factors was zero, the image of dilution factor of 107 was displayed.
The number of counted colonies was used to calculate antibacterial activity (R-value) and percentage of reduction of bacteria as displayed in Table 2 and 3 for E.coli and S.aureus, respectively. R-value must be 2 or above and percentage of reduction must be 99% or above to be considered as having antibacterial property [16]. On the 0th month, both 0.5 mM and 1.0 mM AgNO3 solutions showed 100% reduction of both bacteria.
After the 3rd month, 100% reduction of S.aureus was still achieved for both concentrations, whereas 71.6%
and 97.3% reduction of E.coli were obtained when using 0.5 mM and 1 mM AgNO3, respectively. It is evident
[image:6.595.144.454.325.533.2]previous works [17, 18] reported that minimum inhibitory concentrations (MIC) of silver nanoparticle solutions to be able to inhibit visible growth of S.aureus and E.coli were 1.96 µg/mL and 16 µg/mL, respectively. This means that concentration of AgNPs used to inhibit E.coli efficiently is higher than that of
S.aureus. In this work, the decrease in % reduction was also observed only in the case of E.Coli, especially at
0.5 mM. Moreover, differences in cell wall structure and thickness of peptidoglycan layer between gram-positive and gram-negative bacteria were reported [19]. Gram-gram-positive bacteria have thicker peptidodyglycan layer than that of negative. Hence, bonding between siliver ions and peptidoglycan layer of gram-positive bacteria is stronger [20]. Thus, an attachment of siliver ions on gram-gram-positive bacteria isbetter than that of gram-negative bacteria. This leads to more damage on the cell respiratory of gram-positive bacteria. In other words, gram-positive bacteria are killed easier than gram-negative bacteria.
[image:7.595.78.517.214.551.2]Fig. 8. Typical images of the bacterial counted plates taken every month for three months of S.aureus according to JIS Z 2801. (a) – (d) 0 mM AgNO3, (e) – (h) 0.5 mM AgNO3 and (i) – (l) 1 mM AgNO3.
Table 2. Antimicrobial activity and percentage of reduction of E.coli.
Concentraion
of AgNO3 Month Average of viable cells (Bacterial cells/cm2)
Antimicrobial activity (R-value)
% reduction of
E.coli
0 mM 0th month 4.27 × 10⁹ -
-(Control) 1st month 3.38 × 10⁹ -
-2nd month 2.64 × 10⁹ -
-3rd month 8.30 × 10⁹ -
-0.5 mM 0th month 2.50 9.23 100.00
1st month 2.50 9.13 100.00
2nd month 5.92 × 10⁷ 1.65 97.76
3rd month 2.35 × 10⁹ 0.55 71.64
1 mM 0th month 2.50 9.23 100.00
1st month 1.50 × 10⁶ 3.35 99.96
2nd month 3.17 × 10⁶ 2.92 99.88
[image:8.595.69.509.81.419.2] [image:8.595.85.510.495.718.2]Table 3. Antimicrobial activity and percentage of reduction of S.aureus.
Concentraion
of AgNO3 Month Average of viable cells
(Bacterial cells/cm2)
Antimicrobial activity (R-value)
% reduction of S.aureus
0 mM 0th month 2.92 × 10⁹ -
-(Control) 1st month 1.02 × 10⁹ -
-2nd month 2.58 × 10⁹ -
-3rd month 4.12 × 10⁹ -
-0.5 mM 0th month 2.50 9.07 100.00
1st month 2.50 8.61 100.00
2nd month 2.50 9.01 100.00
3rd month 2.50 9.22 100.00
1 mM 0th month 2.50 9.07 100.00
1st month 2.50 8.61 100.00
2nd month 2.50 9.01 100.00
3rd month 1.83 x 10⁵ 4.35 100.00
3.4. Electrochemical Measurement
Figure9 shows potentiodynamic polarization curves of bare AA6061-T6, anodized AA6061-T6 without and with AgNPs deposition synthesized using 0.5 and 1 mM AgNO3. Corrosion potentials and corrosion current
densities are shown in Table 4. It was found that the anodized AA6061-T6 showed much better corrosion resistance than that of bare AA6061-T6due to the anodic oxide film on the surface. The anodized AA6061-T6 with AgNPs deposition for both cases resulted in shifting of corrosion potentials to more positive values. This result corresponds to previous works due to deposition of silver on the surface [21, 22]. Higher corrosion current density was observed with AgNPs deposition. This is likely due to a presence of “the discrete uncovered area” on the surface as illustrated in Fig. 4(b) and (c). Solution can accumulate in the deep uncovered surface leading to more corrosion susceptibility [23]. Increasing AgNO3 concentration did not
affect corrosion reactivity. Figure 10 reveals corrosion morphology of the anodized AA6061-T6 after polarization measurements. Pitting corrosion was seen for all cases.
Fig. 9. Potentiodynamic polarization curves of bare AA6061-T6, anodized AA6061-T6 without and with AgNPs deposition synthesized with 0.5 mM and 1 mM AgNO3.
-0.5 0.0 0.5 1.0 1.5 2.0 2.5 3.0
10-12 10-11 10-10 10-9 10-8 10-7 10-6 10-5 10-4 10-3 10-2 10-1 AA6061 0 mM AgNO3 0.5 mM AgNO3 1 mM AgNO3
i (A/
cm
2 )
[image:9.595.94.503.103.334.2] [image:9.595.151.422.528.714.2]Table 4. A summary of corrosion potentials and corrosion current densities of bare AA6061-T6, anodized AA6061-T6 without and with AgNPs deposition.
AA6061-T6 Corrosion potential
(Ecorr)/mV Corrosion current density (Icorr)/A cm-2
Bare -592 ± 5 2.6 ± 1.8 × 10⁻⁶
0 mM AgNO3 -529 ± 81 1.3 ± 0.1 × 10⁻¹⁰
0.5 mM AgNO3 170 ± 34 5.7 ± 3.3 × 10⁻⁹
1 mM AgNO3 207 ± 43 5.0 ± 4.8 × 10⁻⁹
Fig. 10. FE-SEM images of the anodized AA6061-T6 after potentiodynamic polarization measurements. (a) 0 mM AgNO3, (b) 0.5 mM AgNO3 and (c) 1 mM AgNO3.
4.
Conclusions
The anodized AA6061-T6 enhanced with antibacterial property was successfully produced. For S.aureus, increase in concentrations of AgNO3 used in this work showed no effect on antibacterial efficiency. 100%
antibacterial efficiency was achieved. However, antibacterial efficiency of E.coli after exposure for three months decreased to 97.27% and 71.64% when using AgNO3 concentrations of 1 mM and 0.5 mM,
respectively. AgNPs showed slight adverse effect on corrosion resistanceof the anodized AA6061-T6.
Acknowledgement
Authors would like to thank Faculty of Science, Mahidol University for Teaching Assistant Fellowship.
References
[1] S. Venukumar, B. Baby, S. Muthukumaran, and S. V. Kailas, “Microstructural and mechanical properties of walking friction stir spot welded AA 6061-T6 sheets,” Procedia Mater. Sci., vol. 6, pp. 656-665, 2014. [2] A. Dorbane, G. Ayoub, B. Mansoor, R. Hamade, G. Kridli, and A. Imad, “Observations of the
mechanical response and evolution of damage of AA6061-T6 under different strain rates and temperatures,” Mater. Sci. Eng., A, vol. 624, pp. 239-249, Jan. 2015.
[3] I. J. Polmear, “Wrought aluminium alloys,” in Light Alloys: Metallurgy of the Light Metals, 3rd ed. London: Arnold, 1995, ch 3, pp. 92.
[4] X. Zhao, Y. Zuo, J. Zhao, J. Xiong, and Y. Tang, “A study on the self-sealing process of anodic films on aluminum by EIS,” Surf. Coat. Technol., vol. 200, no. 24, pp. 6846-6853, Aug. 2006.
[5] A. Hakimizad, K. Raeissi, and F. Ashrafizadeh, “A comparative study of corrosion performance of sealed anodized layers of conventionally colored and interference-colored aluminum,” Surf. Coat.
Technol., vol. 206, no. 22, pp. 4628-4633, Jun. 2012.
[6] E. Ghali, “Aluminum COATINGS: Description and testing,” in Corrosion Resistance of Aluminum and
Magnesium Alloys: Understanding, Performance, and Testing, 1st ed. New Jersey: John Wiley & Sons, 2012, ch.
14, pp. 496-503.
[image:10.595.73.529.117.326.2][8] A. F. F. Giacobone, S. A. Rodriguez, A. L. Burkart, and R. A. Pizarro, “Microbiological induced corrosion of AA 6061 nuclear alloy in highly diluted media by Bacillus cereus RE 10,” Int. Biodeterior.
Biodegrad., vol. 65, no. 8, pp. 1161-1168, Dec. 2011.
[9] N. M. Huang, S. Radiman, H. N. Lim, P. S. Khiew, W. S. Chiu, K. H. Lee, A. Syahida, R. Hashim, and C. H. Chia, “Gamma-Ray assisted synthesis of silver nanoparticles in chitosan solution and the antibacterial properties,” Chem. Eng. J., vol. 155, no. 1-2, pp. 499-507, Dec. 2009.
[10] A. Ghafari-Nazari, F. Moztarzadeh, S. M. Rabiee, T. Rajabloo, M. Mozafari, and L. Tayebi, “Antibacterial activity of silver photodeposited nepheline thin film coatings,” Ceram. Int., vol. 38, no. 7, pp. 5445-5451, Sep. 2012.
[11] J. Lambert, M. Dumont, J. D. Cote, D. Rfvard, F. Paradis, S. Arsenault, and D. Gaudet, “Anodized metal product with antimicrobial properties and method for producing the same,” WO 2013/155618 A1, Oct. 2013.
[12] T. R. Achiterhoff, K. H. Darcy, J. A. Nalewick, and L. W. Hodges, “Antimicrobial process on metal,” US 2012/0186981 A1, Jul. 2011.
[13] L. D. nardo, G. Candiani, A. Cigada, D. Z. Michiei, and G. Zanchetta, “Method to obtain anodized aluminium surfaces with antibacterial properties,” WO 2013/174502 A2, Nov. 2013.
[14] C. C. Lin and F. J. Lai, “Antimicrobal complex surface and method of fabricating the same,” US 2015/0208662 A1, Jul. 2015.
[15] M. U. Rashid, Md. K. H. Bhuiyan, and M. E. Quayum, “Synthesis of silver nano particles (Ag-NPs) and their uses for quantitative analysis of vitamin C tablets,” Dhaka Univ. J. Pharm. Sci., vol. 12, no. 1, pp. 29-33, Jun. 2013.
[16] Antibacterial Products—Test for Antibacterial Activity and Efficacy, JIS Z 2801, 2010.
[17] A. F. Wady, A. L. Machado, C. C. Foggi, C. A. Zamperini, V. Zucolotto, E. B. Moffa, and C. E. vergani, “Effect of silver nanoparticles solution on Staphylococcus aureus and Candida spp.,” J. Nanomater., vol. 2014, 2014.
[18] A. K. Keshari, R. Srivastava, P. Singh, V. B. Yadav, and G. Nath, “Antioxidant and antibacterial activity of silver nanoparticles synthesized by Cestrum nocturnum,” J. Ayurveda. Integr. Med., Aug. 2018. [19] N. Malanovic and K. Lohner, “Gram-positive bacterial cell envelopes: The impact on the activity of
antimicrobial peptides,” Biochim. Biophys. Acta., vol. 1858, no. 5, pp. 936-946, May 2016.
[20] P. V. Viet, T. T. Sang, N. H. N. Bich, and C. M. Thi, “An improved green synthesis method and Escherichia coli antibacterial activity of silver nanoparticles,” J. Photochem. Photobiol. B, Biol., vol. 182, pp. 108-114, May 2018.
[21] Q. Cai, S. Li, J. Pu, X. Bai, H. Wang, Z. Cai, and X. Wang, “Corrosion resistance and antifouling activities of silver-doped CrN coatings deposited by magnetron sputtering,” Surf. Coat. Technol., vol. 354, pp. 194-202, Nov. 2018.
[22] Ch. Girginov, S. Kozhukharov, D. Kiradzhiyska, and R. Mancheva, “Characterization of porous anodic alumima with AC-incorporated silver,” Electrochim. Acta, vol. 292, pp. 614-627, Dec. 2018.
[23] M. Mehdizade, M. Soltanieh, and A. R. Eivani, “Investigation of anodizing time and pulse voltage modes on the corrosion behavior of nanostructured anodic layer in commercial pure aluminum,” Surf. Coat.
![Table 1. The chemical composition of AA6061-T6 (wt%) [3].](https://thumb-us.123doks.com/thumbv2/123dok_us/8106382.235231/3.595.135.463.456.522/table-chemical-composition-aa-t-wt.webp)