Advantages of Percent Weight Loss
as a Method of Reporting Weight
Loss after Roux-en-Y Gastric Bypass
The Harvard community has made this
article openly available.
Please share
how
this access benefits you. Your story matters
Citation
Hatoum, Ida J., and Lee M. Kaplan. 2012. “Advantages of Percent
Weight Loss as a Method of Reporting Weight Loss after
Roux-en-Y Gastric Bypass.” Obesity (Silver Spring, Md.) 21 (8): 1519-1525.
doi:10.1002/oby.20186. http://dx.doi.org/10.1002/oby.20186.
Published Version
doi:10.1002/oby.20186
Citable link
http://nrs.harvard.edu/urn-3:HUL.InstRepos:11879872
Terms of Use
This article was downloaded from Harvard University’s DASH
repository, and is made available under the terms and conditions
applicable to Other Posted Material, as set forth at
http://
Advantages of Percent Weight Loss as a Method of Reporting
Weight Loss after Roux-en-Y Gastric Bypass
Ida J. Hatoum1,2 and Lee M. Kaplan1,2
1Obesity, Metabolism & Nutrition Institute and Gastrointestinal Unit, Massachusetts General
Hospital, Boston, MA
2Department of Medicine, Harvard Medical School, Boston, MA
Abstract
Objective—Although Roux-en-Y gastric bypass (RYGB) is a generally effective treatment for
severe obesity, weight loss (WL) after this operation is highly variable. Accurate predictors of outcome would thus be useful in identifying those patients who would most benefit from this invasive therapy. WL has been characterized using several different metrics, including the number of BMI units lost (ΔBMI), percent baseline WL (%WL), and percent excess body WL (%EBWL). To identify clinically relevant predictors most sensitively it is necessary to avoid confounding by other factors, including preoperative BMI (pBMI), the strongest known predictor of RYGB-induced WL.
Design and Methods—To determine the WL measure least associated with pBMI, we analyzed
outcomes of 846 patients undergoing RYGB.
Results—Patients in this cohort had an average pBMI of 50.0 kg/m2. At weight nadir, they lost
an average 19.4 kg/m2, 38.7% WL, and 81.2% EBWL. pBMI was strongly and positively associated with ΔBMI at both one year (r=0.56, p=4.7×10−51) and nadir (r=0.58, p=2.8×10−77) and strongly but negatively associated with %EBWL at one year (r=−0.52, p=3.8×10−44) and nadir (r=−0.45, p=7.2×10−43). In contrast, pBMI was not significantly associated with %WL at one year (r=0.04, p=0.33), and only weakly associated at nadir (r=0.13, p=0.0002).
Conclusions—Of the metrics examined, %WL is the parameter describing WL after RYGB
least influenced by pBMI. It thus improves comparison of WL outcomes across studies of patients undergoing surgery and facilitates the most sensitive identification of novel predictors of surgery-induced WL. We therefore recommend that %WL be adopted more broadly in reporting weight loss after RYGB.
It is estimated that 34% of adults in the United States are overweight and an additional 32% have obesity.1 The myriad metabolic, inflammatory, degenerative, cognitive, and neoplastic sequealae of obesity together cost more than $168 billion annually and account for nearly 10% of all healthcare expenditures in the United States.2 Behavioral and
pharmacotherapeutic treatments for severe obesity have been met with limited long-term success.3–6 In contrast, Roux-en-Y gastric bypass (RYGB), the most commonly used surgical therapy for obesity, leads to substantial and sustained weight loss,7 and recent studies demonstrate that this operation works by altering the normal physiological regulation of energy balance.8–10 Despite the overall effectiveness of RYGB, however, not all patients
Correspondence and Request for Reprints: Lee M. Kaplan, Massachusetts General Hospital, 149 13th Street, Room 8219, Charlestown, MA 02129; LMKaplan@partners.org; Phone: 617-726-3768.
NIH Public Access
Author Manuscript
Obesity (Silver Spring)
. Author manuscript; available in PMC 2014 February 01.Published in final edited form as:
Obesity (Silver Spring). 2013 August ; 21(8): 1519–1525. doi:10.1002/oby.20186.
NIH-PA Author Manuscript
NIH-PA Author Manuscript
lose the same amount of weight or obtain the same clinical benefits from this procedure; indeed, several studies have demonstrated a wide and normal distribution of weight loss (WL) outcomes after RYGB.11–14 The drivers of this wide variation in outcomes remain largely unknown, and a growing effort has been made to identify clinical, demographic, psychological, surgical, and genetic predictors of WL after surgery. The identification of novel predictors of WL after RYGB could provide both insight into the biological
mechanisms of action of this procedure, and provide predictive markers that could be used to stratify patients according to their likely change in weight.
In the search for clinically relevant outcome predictors, WL has been characterized using a number of different metrics, including the absolute number of pounds or body mass index (BMI) units lost, weight or BMI achieved after weight loss, the percent baseline weight or BMI loss (%WL), and the percent excess body weight loss (%EBWL). Currently, there is no consensus on the best method for characterizing WL after RYGB, and the arguments for or against any one of these metrics have been dominated by considerations of biological/ mechanistic plausibility, ease of communication to the research and clinical communities, historical precedent and perceived clinical relevance.15–21 Percent EBWL, a metric that is used primarily in describing WL after bariatric surgery,21 describes the percent of weight loss relative to achieving an “ideal” BMI. Recently, it was proposed that %EBWL be the standard metric for reporting WL after bariatric surgery, and be extended to describing outcomes of other interventions for obesity.20 Percent WL is a more frequently used metric in the behavioral and pharmacotherapeutic literature, where pre-treatment BMI and the absolute magnitude of WL tends to be lower. Recent reports suggest that the use of total percent weight loss (%WL) be extended to bariatric populations.22,23 This difference in reporting methods makes results from studies of surgically-induced WL less directly comparable to studies of WL from non-surgical therapies. Because of the wide difference in efficacy between surgery and other interventions this has not been a major problem, but with the development of newer pharmacological and medical device-based therapies with intermediate efficacy, the need for comparison across a broad spectrum of outcomes has become increasingly important.
While these clinical factors are important in choosing how to report WL, it is also important to consider the direct statistical implications of using each metric. Preoperative BMI (pBMI) is one of the strongest known predictors of WL after RYGB when weight is characterized as pounds/BMI lost,24,25 final weight or BMI,26,27 or %EBWL.11,26,28–30 Despite these associations, however, pBMI is not a sufficiently powerful predictor to drive most clinical decision-making, as patients with higher initial BMIs lose less %EBWL yet benefit immensely from RYGB and thus would not be strongly contraindicated for surgery.
Therefore, the strong association between pBMI and WL provides limited clinical utility, yet potentially masks the ability to detect associations between WL and potential novel,
clinically useful, predictors.
To minimize this concern and facilitate our own search for novel outcome predictors, we sought to identify the method of characterizing WL that is least associated with pBMI in a patient population with severe obesity undergoing Roux-en-Y gastric bypass. We found that %WL is the metric in common use that is least influenced by pBMI. For this reason, and because %WL is currently the metric most widely used to report WL after non-surgical therapies, we suggest that it is the optimal metric for characterizing outcomes across the growing spectrum of WL interventions for obesity.
NIH-PA Author Manuscript
NIH-PA Author Manuscript
METHODS
Study Population
Participants were recruited from the population of patients undergoing RYGB at a single academic center that is part of a larger 13-hospital network in the Boston metropolitan area. From February 2000 until April 2007, we obtained consent from 998 (97%) of the patients undergoing RYGB at this center. Operations included both open and laparoscopic RYGB performed by one of two surgeons using the same operative techniques; the surgical methods have been described previously.13 This study was approved by the institutional review board of the Massachusetts General Hospital.
Endpoint and Covariate Assessment
Demographic and clinical information was extracted from the medical record. We identified a patient’s weight nadir, defined as the lowest weight achieved at least 10 months after surgery without coexisting debilitating illness or use of weight-lowering medications. One-year weight was defined as the weight measurement closest to 12 months and within the range of 10–14 months after surgery. Post-operative weights were available for 846 patients (83.3%). Chart-derived nadir weights were validated by telephone interviews in a subset of patients (n=306); there was a 94% concordance between these two sources. Diabetes diagnoses were extracted from patient charts and defined as the presence of any of the following: documentation of diabetes, a fasting glucose measurement ≥ 126 mg/dL, or the use of the anti-diabetes medications insulin or metformin.
Weight loss was characterized at one year and at weight nadir using seven different metrics (Table 1). Residuals were calculated by regressing postoperative BMI (the dependent variable) on preoperative BMI (the independent variable) and outputting the residuals from this model. Because residuals derived from regressing postoperative BMI on preoperative BMI are orthogonal to preoperative BMI, we used these residuals as the benchmark of independence from preoperative BMI. WL characterized by the number of pounds lost was calculated by subtracting the patient’s final weight from his or her baseline weight. As BMI is a function of weight and height, and height is almost always stable over the course of a weight loss study, BMI lost and pounds lost are closely similar methods for measuring weight loss. Percent weight loss (%WL) was calculated by dividing the absolute pounds lost by the patient’s initial weight and is statistically interchangeable with percent BMI change. Percent excess body weight loss (%EBWL) was calculated by dividing the difference between initial BMI and final BMI by the difference between initial BMI and a “normal” target BMI. A BMI of 25 kg/m2, the upper limit of a “normal” BMI, is frequently used as the target, but other standards, including race-specific BMI standards or other “ideal weights” according to the Metropolitan Life Insurance Company life tables, may also be used to represent “normal.” In this study, %EBWL was calculated using a reference normal BMI of 25 kg/m2. Using this definition, a patient with a BMI of 35 kg/m2 has 10 “excess” BMI points, and if this patient were to achieve a BMI of 30, 25, or 20 kg/m2 through weight loss intervention, he or she would have lost 50%, 100%, or 150% of his or her excess weight, respectively.
Statistical Analyses
Patients were divided into seven pBMI groups (35–39.9, 40–44.9, 45–49.9, 50–54.9, 55– 59.9, 60–64.9, and ≥ 65kg/m2). Means for each WL metric were calculated for each pBMI group, and linear trends across the groups were assessed using a test for trend of the median value within each group. Correlations between pBMI and each continuous metric were assessed using Spearman correlations, and 95% Confidence Intervals (CIs) were calculated with bias adjustment. r2 measures were derived from linear regressions, and estimates of the
NIH-PA Author Manuscript
NIH-PA Author Manuscript
r2 95% Confidence Interval (CI) for for each regression model was estimated with a bootstrapping method that used 500 iterations of resampling with replacement. All analyses were performed using SAS statistical software (SAS Institute, Cary, NC).
RESULTS
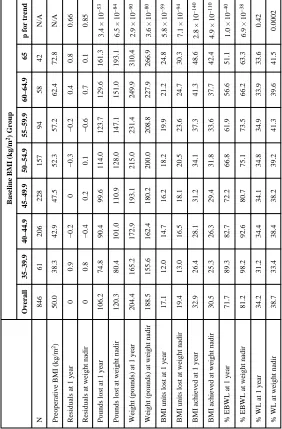
At baseline, participants had an average BMI of 50.0 (SD ± 8.3) kg/m2 and an average age of 44.7 (± 11.5) years; 74.3% were female and 26.2% had diabetes. One year after RYGB, patients lost an average of 17.1 kg/m2, 34.2 % of baseline weight, and 71.7 % of excess body weight. By weight nadir, which on average occurred 28.5 months after surgery, patients lost an average of 19.4 kg/m2, 38.7 % of baseline weight, and 81.2% of excess body weight (Table 2).
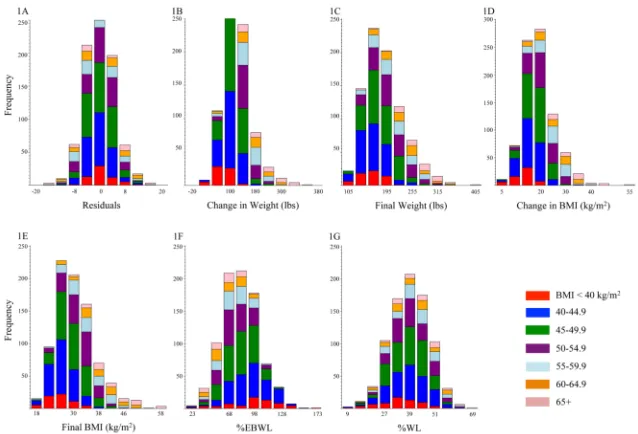
As expected, the residuals derived from regressing postoperative BMI on preoperative BMI showed no difference across pBMI groups (r=0, p=0.9 at both one year and weight nadir; Table 2, Figure 1a). In contrast, there was a strong positive association between absolute WL (pounds lost or gained) and pBMI, with patients in lower BMI groups losing
significantly less weight (r1y = 0.52, 95% CI 0.46–0.58, p1y = 3.4 × 10−53; rnadir = 0.54, 95%
CI 0.50–0.60, pnadir = 6.5 × 10−84; Table 2, Figure 1b). As expected, the same pattern is
observed when change in BMI, final attained weight, or final attained BMI is used (Table 2, Figure 1b–1e). When WL was characterized as %EBWL, the opposite pattern was observed, with patients at a lower pBMI experiencing greater %EBWL at both 1 year and weight nadir (r1y = −0.51, 95% CI −0.56–−0.45, p1y = 1.0 × 10−40; rnadir = −0.43, 95% CI −0.48–−0.37,
pnadir = 6.9 × 10−38; Table 2, Figure 1f). In contrast, there was no association between pBMI
group and %WL at one year (r1y = 0.04, 95% CI −0.04–0.12, p1y = 0.52; Table 2), and only
a weak association between pBMI and %WL at weight nadir (rnadir = 0.13, 95% CI 0.05–
0.19, pnadir = 0.003; Table 2, Figure 1g).
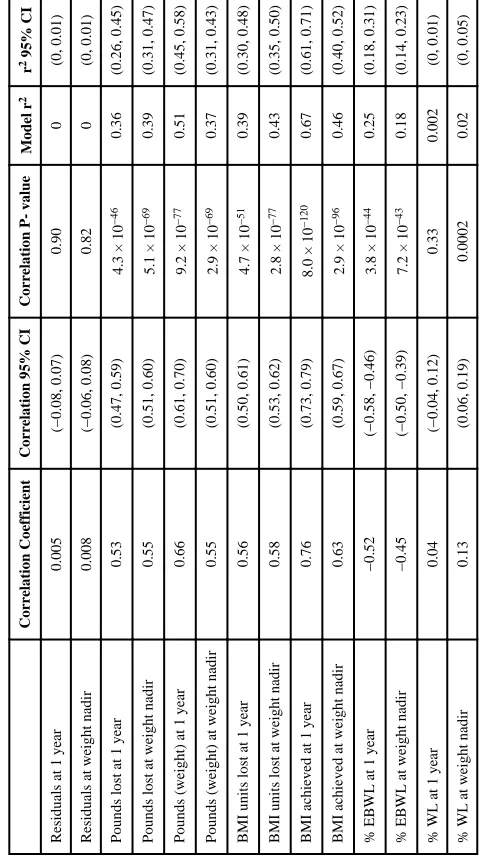
Similar patterns were seen when a continuous characterization of pBMI was used (Table 3). The number of pounds lost was strongly and positively correlated with pBMI at both one year (rSpearman=0.53, 95% CI 0.47–0.59, p = 4.3 × 10−46) and at weight nadir
(rSpearman=0.55, 95% CI 0.51–0.60, p = 5.1 × 10−69); BMI units lost showed a similar
pattern (Table 3). %EBWL was strongly but negatively correlated with pBMI at both one year (rSpearman= −0.52, 95% CI −0.58–−0.46, p = 3.8 × 10−44) and at weight nadir
(rSpearman= −0.45, 95% CI −0.50–−0.39, p = 7.2 × 10−43). In contrast, %WL was not
associated with pBMI at one year (rSpearman= 0.04, 95% CI −0.04–0.12, p = 0.33) and was
only weakly associated with pBMI at weight nadir (rSpearman= 0.13, 95% CI 0.06–0.19, p =
0.0002). While pBMI explains a substantial proportion of the variability in number of pounds lost (r21y = 0.36, 95% CI 0.26–0.45; r2nadir = 0.39, 95% CI 0.31–0.47) and %EBWL
(r21y = 0.25, 95% CI 0.18–0.31; r2nadir = 0.18, 95% CI 0.14–0.23), it explains only a small
percentage of the variability in %WL (r21y = 0.002, 95% CI 0–0.01; r2nadir = 0.02, 95% CI
0–0.05).
DISCUSSION
In this study we found that percent weight loss (%WL) has substantial advantages as a metric for characterizing weight loss after RYGB. Relative to other WL parameterizations, including pounds or BMI units lost, attained weight or BMI, and %EBWL, %WL is least associated with baseline BMI. These findings have several important implications for the identification of novel predictors of WL after RYGB. First, the use of %WL can facilitate comparisons of WL outcomes across studies of different surgical and non-surgical
interventions where patients’ initial BMIs may vary. Second, use of this parameter can allow
NIH-PA Author Manuscript
NIH-PA Author Manuscript
for more sensitive identification of other novel predictors, because it is more independent of the potential masking effects of pBMI.
The identification of novel predictors of WL after RYGB may provide insight into the mechanisms of action of this therapy. In addition, these predictors could be used to develop clinical tools to identify those patients who will likely benefit most (and least) from RYGB, thus improving the risk: benefit profile for this highly effective yet invasive treatment. When searching for such predictors, it is necessary to reduce or eliminate sources of bias, including confounding by pBMI in particular.30 If confounding by pBMI is present, it may be difficult to distinguish between the effect of a potential predictor on WL from the effect of pBMI. For example, diabetes is a known predictor of WL after RYGB.11,13,31,32 It is also known to be strongly associated with BMI.33 It is therefore possible that the observed relationship between diabetes and WL is due at least in part to the influence of pBMI on WL (see Supplementary Information). In other words, while the intent of much current research is to identify predictors of WL, there is an inherent risk of simply identifying predictors of pBMI. One way to eliminate such confounding is to ensure that there is no association between pBMI and WL. The residuals derived from the regression of postoperative BMI on preoperative BMI are, by definition, a measure of weight loss independent of initial BMI and are therefore the gold standard by which more user-friendly metrics should be judged. In the present study these residuals were the only metric completely free of association with pBMI at both one year and weight nadir. Using this metric has several limitations, however. First, residuals are not easily communicated to providers, patients, or non-statistician investigators. Second, if the goal is to identify predictors of WL that can be used to distinguish patients who should or shouldn’t get a particular intervention, residuals will not be able to be used because the outcome (from which the residuals are derived) will not be known at the outset. Thus, residuals are best used for discovery of potential biological associations between predictors and WL, but are not a viable option for widespread adoption in the research and clinical environments.
In contrast to the lack of association observed between the residuals and pBMI, we observed a strong inverse relationship between %EBWL and pBMI. Similar associations between pBMI and the endpoints %EBWL and %WL have been reported previously.22,23 Proponents of %EBWL support its use because it conceptually represents the extent of a patient’s travel from their baseline weight to a “normal” weight. Using this method, “success” or “failure” after bariatric surgery can be interpreted with respect to the patient’s remaining “excess weight” after the procedure. As proposed by Reinhold in 1982,34 a patient’s response to surgery could be described in terms of how much “excess” weight the patient carried above his or her “ideal” weight following the bariatric procedure, as the criteria for surgical indication at the time was being 100% above one’s ideal weight, with a recognized increase in mortality starting at 50% excess weight.35 We now know that increased morbidity and mortality occurs at even lower excess weights. The commonly cited minimum 50% EBWL for “success” after bariatric surgery36 is thus a reinterpretation of the method proposed by Reinhold, and remains a somewhat arbitrary target for “success.” Another proposed benefit to the use of %EBWL considers that there is a biological floor to the amount of weight loss that can be achieved, making it an attractive marker of disease improvement or resolution in patients with severe obesity. It is possible that the observed relationship between pBMI and %EBWL reflects the biology of WL after RYGB – to the extent that a higher pBMI represents a more severe form of obesity, severe obesity may “normalize” less completely after RYGB. A parallel can be drawn with other metabolic conditions, such as systolic blood pressure (SBP), where patients with more extreme levels of SBP are less likely to achieve a normal SBP and are more likely to need aggressive treatment with multiple antihypertensive treatments.37,38 It is also possible, however, that the observed association between pBMI and %EBWL is an artifact of how %EBWL is calculated, leading to skewing of results in
NIH-PA Author Manuscript
NIH-PA Author Manuscript
favor of patients with a lower pBMI, who appear to be more “successful” after RYGB because they have less weight to lose to achieve a “normal” BMI. Conversely, in this study and in previous reports,23,39 patients with a lower pBMI lost less absolute weight relative to other patients, thus appearing less “successful” if absolute pounds are chosen as the WL metric. Whether the association between the WL metric and pBMI is observed for biological or artificial reasons, these metrics increase the potential for strong confounding by pBMI when searching for other novel predictors. Although it may be possible to partly account for the effects of pBMI through adjustment for pBMI using statistical models, a relationship between the potential predictor and pBMI would generate the potential for collinearity, which could result in incorrect estimation of the effect size and standard error of the potential novel predictor.
It is thus advantageous to use a WL metric that both minimizes the association with pBMI (unlike pounds lost or %EBWL) and that is clinically interpretable (unlike the use of residuals). In the present study, %WL demonstrated several statistical advantages over the other methods of characterizing WL. The use of %WL also has several advantages over the use of %EBWL beyond its statistical properties.17 First, %EBWL is based on a somewhat arbitrary target, or “ideal” weight, whether this is defined according to a BMI standard (e.g., a BMI of 25 kg/m2) or another standard such as the Metropolitan Life Insurance Company life tables. It is not intrinsically clear what the “right” target should be, and the choice of target can substantially skew the results, particularly if the starting BMI is relatively low (e.g., <35 kg/m2) as is more often the case with recent studies examining the efficacy of novel drugs, medical devices or the efficacy of surgery specifically for the treatment of DM. These considerations can be further amplified when applied to studies of populations such as East and South Asians, where increased body fat and metabolic effects of obesity are seen at lower BMIs, and clinical trials are consequently targeted to subjects with lower pBMIs. Future studies will be needed to determine whether the relationship between measures of WL and pBMI holds in independent populations with varying baseline BMIs, racial compositions, and demographic distributions.40 The advantages of using %WL will also need to be evaluated for other bariatric procedures that target patients with lower initial BMIs, such as gastric banding and sleeve gastrectomy, as there may be bias in using %WL in patients with lower pBMIs. Second, %WL is a more intuitive metric for the patient and provider than %EBWL, thus potentially facilitating patient-provider communication about the patient’s care path. While number of pounds lost or predicted final weight may be the most easily communicated to the patient, these metrics are strongly influenced by pBMI. Moreover, they can easily be derived from %WL. Finally, %WL is the standard of reporting WL in non-surgical studies, and therefore the use of %WL would facilitate comparison across studies of all types of obesity therapies.
In summary, we have observed that %WL has statistical characteristics that make it the optimal metric for describing and reporting WL after RYGB. Because of its clinical and biological implications along with its inherent simplicity, we recommend that %WL be more widely adopted as the primary metric for reporting WL after RYGB and other bariatric procedures. The use of this metric will allow for the least confounded interpretation of WL, enhance the ability to compare different studies without intensive reanalysis of the primary data, and ease communication of results to patients, providers, public health professionals, and others who need to assess and use comparative effectiveness determinations.
Acknowledgments
Grants: This work was supported by NIH grants DK093257 (IJH), DK088661 (LMK), and DK090956 (LMK).
We thank David Allison for his helpful comments and suggestions. This work was supported by NIH grants DK093257 (IJH), DK088661 (LMK), and DK090956 (LMK).
NIH-PA Author Manuscript
NIH-PA Author Manuscript
List of Abbreviations
RYGB Roux-en-Y gastric bypass
WL weight loss
%EBWL percent excess body weight loss
BMI body mass index
%WL percent weight loss
pBMI preoperative BMI
References
1. Ogden CL, et al. Prevalence of overweight and obesity in the United States, 1999–2004. JAMA. 2006; 295:1549–1555. [PubMed: 16595758]
2. Cawley J, Meyerhoefer C. The medical care costs of obesity: an instrumental variables approach. J Health Econ. 2012; 31:219–230. [PubMed: 22094013]
3. Wing RR. Look AHEAD Research Group. Long-term effects of a lifestyle intervention on weight and cardiovascular risk factors in individuals with type 2 diabetes mellitus: four-year results of the Look AHEAD trial. Arch Intern Med. 2010; 170:1566–1575. [PubMed: 20876408]
4. Gardner CD, et al. Comparison of the Atkins, Zone, Ornish, and LEARN diets for change in weight and related risk factors among overweight premenopausal women: the A TO Z Weight Loss Study: a randomized trial. JAMA. 2007; 297:969–977. [PubMed: 17341711]
5. Bray GA. Medications for weight reduction. Endocrinol Metab Clin North Am. 2008; 37:923–942. [PubMed: 19026940]
6. Kaplan LM. Pharmacologic therapies for obesity. Gastroenterol Clin North Am. 2010; 39:69–79. [PubMed: 20202580]
7. Buchwald H, et al. Bariatric surgery: a systematic review and meta-analysis. JAMA. 2004; 292:1724–1737. [PubMed: 15479938]
8. Stylopoulos N, Hoppin AG, Kaplan LM. Roux-en-Y gastric bypass enhances energy expenditure and extends lifespan in diet-induced obese rats. Obesity (Silver Spring). 2009; 17:1839–1847. [PubMed: 19556976]
9. Shin AC, Zheng H, Pistell PJ, Berthoud HR. Roux-en-Y gastric bypass surgery changes food reward in rats. Int J Obes (Lond). 2011; 35:642–651. [PubMed: 20805826]
10. Romanova IV, et al. Neurobiologic changes in the hypothalamus associated with weight loss after gastric bypass. J Am Coll Surg. 2004; 199:887–895. [PubMed: 15555972]
11. Ma Y, et al. Predictors of weight status following laparoscopic gastric bypass. Obes Surg. 2006; 16:1227–1231. [PubMed: 16989709]
12. Bessler M, et al. Frequency distribution of weight loss percentage after gastric bypass and adjustable gastric banding. Surg Obes Relat Dis. 2008; 4:486–491. [PubMed: 18656830] 13. Hatoum IJ, Stein HK, Merrifield BF, Kaplan LM. Capacity for physical activity predicts weight
loss after Roux-en-Y gastric bypass. Obesity (Silver Spring). 2009; 17:92–99. [PubMed: 18997674]
14. Hatoum IJ, et al. Heritability of the weight loss response to gastric bypass surgery. J Clin Endocrinol Metab. 2011; 96:E1630–3. [PubMed: 21832118]
15. Bray GA, et al. Is it time to change the way we report and discuss weight loss? Obesity (Silver Spring). 2009; 17:619–621. [PubMed: 19322140]
16. Sharma AM, Karmali S, Birch DW. Reporting weight loss: is simple better? Obesity (Silver Spring). 2010; 18:219. [PubMed: 20111026]
17. Karmali S, Birch DW, Sharma AM. Is it time to abandon excess weight loss in reporting surgical weight loss? Surg Obes Relat Dis. 2009; 5:503–506. [PubMed: 19632649]
18. Baltasar A, Deitel M, Greenstein RJ. Weight loss reporting. Obes Surg. 2008; 18:761–762. [PubMed: 18408981]
NIH-PA Author Manuscript
NIH-PA Author Manuscript
19. Deitel M, Greenstein RJ. Recommendations for reporting weight loss. Obes Surg. 2003; 13:159– 160. [PubMed: 12760387]
20. Deitel M, Gawdat K, Melissas J. Reporting weight loss 2007. Obes Surg. 2007; 17:565–568. [PubMed: 17658011]
21. Dixon JB, McPhail T, O’Brien PE. Minimal reporting requirements for weight loss: current methods not ideal. Obes Surg. 2005; 15:1034–1039. [PubMed: 16105403]
22. van de Laar, A. Bariatric Outcomes Longitudinal Database (BOLD) Suggests Excess Weight Loss and Excess BMI Loss To Be Inappropriate Outcome Measures, Demonstrating Better …. Obes
Surg. 2012. at <http://www.springerlink.com/index/J6KQ65V2646129K7.pdf>
23. de Laar A, Caluwé L, Dillemans B. Relative Outcome Measures for Bariatric Surgery. Evidence Against Excess Weight Loss and Excess Body Mass Index Loss from a Series of Laparoscopic Roux-en-Y Gastric Bypass Patients. Obes Surg. 2011; 21:763–767. [PubMed: 21197603] 24. Inge TH, et al. Baseline BMI is a strong predictor of nadir BMI after adolescent gastric bypass. J
Pediatr. 2010; 156:103–108.e1. [PubMed: 19775700]
25. Larsen JK, et al. Personality as a predictor of weight loss maintenance after surgery for morbid obesity. Obes Res. 2004; 12:1828–1834. [PubMed: 15601979]
26. Lynch A, Bisogni C. Understanding Dietary Monitoring and Self-Weighing by Gastric Bypass Patients: a Pilot Study of Self-Monitoring Behaviors and Long-Term Weight Outcomes. Obes Surg. 201210.1007/s11695-012-0705-1
27. Chen EY, et al. Body mass index as a predictor of 1-year outcome in gastric bypass surgery. Obes Surg. 2009; 19:1240–1242. [PubMed: 18839077]
28. Averbukh Y, et al. Depression score predicts weight loss following Roux-en-Y gastric bypass. Obes Surg. 2003; 13:833–836. [PubMed: 14738665]
29. Sauter ER, Mitchell JE, Kliethermes B, Crosby RD. Breast cancer biomarkers predict weight loss after gastric bypass surgery. BMC Res Notes. 2012; 5:82. [PubMed: 22293654]
30. Dallal RM, Quebbemann BB, Hunt LH, Braitman LE. Analysis of weight loss after bariatric surgery using mixed-effects linear modeling. Obes Surg. 2009; 19:732–737. [PubMed: 19277799] 31. Perugini RA, et al. Predictors of complication and suboptimal weight loss after laparoscopic
Roux-en-Y gastric bypass: a series of 188 patients. Arch Surg. 2003; 138:541–5. discussion 545–6. [PubMed: 12742960]
32. Campos GM, et al. Factors associated with weight loss after gastric bypass. Arch Surg. 2008; 143:877–883. discussion 884. [PubMed: 18794426]
33. Lazar MA. How obesity causes diabetes: not a tall tale. Science. 2005; 307:373–375. [PubMed: 15662001]
34. Reinhold RB. Critical analysis of long term weight loss following gastric bypass. Surg Gynecol Obstet. 1982; 155:385–394. [PubMed: 7051382]
35. Seltzer CC. Some re-evaluations of the build and blood pressure study, 1959 as related to ponderal index, somatotype and mortality. N Engl J Med. 1966; 274:254–259. [PubMed: 5902219] 36. Brolin RE, Kenler HA, Gorman RC, Cody RP. The dilemma of outcome assessment after
operations for morbid obesity. Surgery. 1989; 105:337–346. [PubMed: 2922674] 37. Chobanian AV, et al. The Seventh Report of the Joint National Committee on Prevention,
Detection, Evaluation, and Treatment of High Blood Pressure: the JNC 7 report. JAMA. 2003; 289:2560–2572. [PubMed: 12748199]
38. Cushman WC, et al. Success and predictors of blood pressure control in diverse North American settings: the antihypertensive and lipid-lowering treatment to prevent heart attack trial (ALLHAT). J Clin Hypertens (Greenwich). 2002; 4:393–404. [PubMed: 12461301]
39. Baltasar A, et al. Weight loss reporting: predicted body mass index after bariatric surgery. Obes Surg. 2011; 21:367–372. [PubMed: 20683784]
40. Williams KY, Yoo YJ, Patki A, Allison DB. Real data examples in statistical methods papers: Tremendously valuable, and also tremendously misvalued. Statistics and its interface. 2011; 4:267–272. [PubMed: 22132253]
NIH-PA Author Manuscript
NIH-PA Author Manuscript
Figure 1. Weight loss distributions at weight nadir within preoperative BMI groups for different weight loss metrics
Weight loss by preoperative BMI groups < 40 kg/m2 (red), 40–44.9 kg/m2 (blue), 45–49.9 kg/m2 (green), 50–54.9 kg/m2 (purple), 55–59.9 kg/m2 (light blue), 60–64.9 kg/m2 (orange), ≥ 65 kg/m2 (pink) for (A) residuals of the regression of final BMI on preoperative BMI, (B) change in weight (pounds), (C) final weight attained (pounds), (D) BMI lost (kg/m2), (E) final BMI attained (kg/m2), (F) percent excess body weight loss, (G) percent weight loss.
NIH-PA Author Manuscript
NIH-PA Author Manuscript
NIH-PA Author Manuscript
NIH-PA Author Manuscript
[image:11.612.86.264.330.678.2]NIH-PA Author Manuscript
Table 1
Different metrics of weight loss METRIC
ABBREVIATION
FORMULA
Residuals
e = Observed Final BMI −
Pr
edicted Final BMI
Predicted BMI from the equation:
Final BMI = Initial BMI
Weight lost (in pounds or kg)
Δ
pounds,
Δ
kg
Initial Weight
(lbs or kgs
)
− Final Weight
(lbs or kgs
)
Weight achieved (in pounds or kg)
Final Weight (lbs or kgs)
BMI units lost
Δ
BMI
Initial BMI − Final BMI
BMI achieved
Final BMI
Percent excess body weight lost
% EBWL
Percent weight change
NIH-PA Author Manuscript
NIH-PA Author Manuscript
[image:12.612.93.375.250.679.2]NIH-PA Author Manuscript
Table 2
Weight loss metrics by preoperative BMI group
Baseline BMI (kg/m
2) Group
Overall 35–39.9 40–44.9 45–49.9 50–54.9 55–59.9 60–64.9 ≥65
p for trend
N 846 61 206 228 157 94 58 42 N/A
Preoperative BMI (kg/m
2) 50.0 38.3 42.9 47.5 52.3 57.2 62.4 72.8 N/A
Residuals at 1 year
0 0.9 −0.2 0 −0.3 −0.2 0.4 0.8 0.66
Residuals at weight nadir
0 0.8 −0.4 0.2 0.1 −0.6 0.7 0.1 0.85
Pounds lost at 1 year
106.2 74.8 90.4 99.6 114.0 123.7 129.6 161.3
3.4 × 10
−53
Pounds lost at weight nadir
120.3 80.4 101.0 110.9 128.0 147.1 151.0 193.1
6.5 × 10
−84
Weight (pounds) at 1 year
204.4 165.2 172.9 193.1 215.0 231.4 249.9 310.4
2.9 × 10
−90
Weight (pounds) at weight nadir
188.5 155.6 162.4 180.2 200.0 208.8 227.9 266.9
3.6 × 10
−80
BMI units lost at 1 year
17.1 12.0 14.7 16.2 18.2 19.9 21.2 24.8
5.8 × 10
−59
BMI units lost at weight nadir
19.4 13.0 16.5 18.1 20.5 23.6 24.7 30.3
7.1 × 10
−94
BMI achieved at 1 year
32.9 26.4 28.1 31.2 34.1 37.3 41.3 48.6
2.8 × 10
−140
BMI achieved at weight nadir
30.5 25.3 26.3 29.4 31.8 33.6 37.7 42.4
4.9 × 10
−110
% EBWL at 1 year
71.7 89.3 82.7 72.2 66.8 61.9 56.6 51.1
1.0 × 10
−40
% EBWL at weight nadir
81.2 98.2 92.6 80.7 75.1 73.5 66.2 63.3
6.9 × 10
−38
% WL at 1 year
34.2 31.2 34.4 34.1 34.8 34.9 33.9 33.6 0.42
% WL at weight nadir
NIH-PA Author Manuscript
NIH-PA Author Manuscript
[image:13.612.91.331.251.679.2]NIH-PA Author Manuscript
Table 3
Spearman correlations and linear regression model r
2 between each outcome and preoperative BMI (continuous)
Correlation Coefficient
Correlation 95% CI
Correlation P- value
Model r
2
r
2 95% CI
Residuals at 1 year
0.005
(−0.08, 0.07)
0.90
0
(0, 0.01)
Residuals at weight nadir
0.008
(−0.06, 0.08)
0.82
0
(0, 0.01)
Pounds lost at 1 year
0.53
(0.47, 0.59)
4.3 × 10
−46
0.36
(0.26, 0.45)
Pounds lost at weight nadir
0.55
(0.51, 0.60)
5.1 × 10
−69
0.39
(0.31, 0.47)
Pounds (weight) at 1 year
0.66
(0.61, 0.70)
9.2 × 10
−77
0.51
(0.45, 0.58)
Pounds (weight) at weight nadir
0.55
(0.51, 0.60)
2.9 × 10
−69
0.37
(0.31, 0.43)
BMI units lost at 1 year
0.56
(0.50, 0.61)
4.7 × 10
−51
0.39
(0.30, 0.48)
BMI units lost at weight nadir
0.58
(0.53, 0.62)
2.8 × 10
−77
0.43
(0.35, 0.50)
BMI achieved at 1 year
0.76
(0.73, 0.79)
8.0 × 10
−120
0.67
(0.61, 0.71)
BMI achieved at weight nadir
0.63
(0.59, 0.67)
2.9 × 10
−96
0.46
(0.40, 0.52)
% EBWL at 1 year
−0.52
(−0.58, −0.46)
3.8 × 10
−44
0.25
(0.18, 0.31)
% EBWL at weight nadir
−0.45
(−0.50, −0.39)
7.2 × 10
−43
0.18
(0.14, 0.23)
% WL at 1 year
0.04
(−0.04, 0.12)
0.33
0.002
(0, 0.01)
% WL at weight nadir
0.13
(0.06, 0.19)
0.0002
0.02