NEUROENERGETICS
ORIGINAL RESEARCH ARTICLEpublished: 05 November 2012 doi: 10.3389/fnene.2012.00010Inter-trial variability in sensory-evoked cortical
hemodynamic responses: the role of the magnitude of
pre-stimulus fluctuations
Mohamad Saka1, Jason Berwick2and Myles Jones2*
1
Animal Imaging Service Unit, King Fahad Centre for Medical Research, King Abdulaziz University, Jeddah, Saudi Arabia 2
Department of Psychology, The Centre for Signal Processing in NeuroImaging and Systems Neuroscience, University of Sheffield, Sheffield, UK
Edited by:
Bruno Weber, University of Zurich, Switzerland
Reviewed by:
Albert Gjedde, University of Copenhagen, Denmark
Fahmeed Hyder, Yale University, USA
*Correspondence: Myles Jones, Department of Psychology, University of Sheffield, Western Bank, Sheffield S10 STP, UK. e-mail: m.jones@sheffield.ac.uk
Brain imaging techniques utilize hemodynamic changes that accompany brain activation. However, stimulus-evoked hemodynamic responses display considerable inter-trial vari-ability and the sources of this varivari-ability are poorly understood. One of the sources of this response variation could be ongoing spontaneous hemodynamic fluctuations. We recently investigated this issue by measuring cortical hemodynamics in response to sensory stimuli in anesthetized rodents using 2-dimensional optical imaging spectroscopy. We suggested that sensory-evoked cortical hemodynamics displayed distinctive response characteristics and magnitudes depending on the phase of ongoing fluctuations at stimulus onset due to a linear superposition of evoked and ongoing hemodynamics (Saka et al., 2010). How-ever, the previous analysis neglected to examine the possible influence of variability of the size of ongoing fluctuations. Consequently, data were further analyzed to examine whether the size of pre-stimulus hemodynamic fluctuations also influenced the magni-tude of subsequent stimulus-evoked responses. Indeed, in the case of all individual trials, a moderate correlation between the size of the pre-stimulus fluctuations and the magni-tudes of the subsequent sensory-evoked responses were observed. However, different correlations between the size of the pre-stimulus fluctuations and magnitudes of the sub-sequent sensory-evoked cortical hemodynamic responses could be observed depending on their phase at stimulus onset. These analyses suggest that both the size and phase of pre-stimulus fluctuations in cortical hemodynamics contribute to inter-trial variability in sensory-evoked responses.
Keywords: intertrial variability, cortical hemodynamics, optical imaging, barrel cortex, spontaneous fluctuation
INTRODUCTION
The changes in blood flow, volume, and oxygenation that accom-pany brain activation are collectively referred to as the hemo-dynamic response. Cerebral hemohemo-dynamics are of interest to cognitive neuroscience as they form the basis of non-invasive human brain imaging techniques such as Blood Oxygenation Level Dependent (BOLD) fMRI (Kwong et al., 1992;Ogawa et al., 1992). However, stimulus-evoked hemodynamic responses are known to display considerable inter-trial variability (Aguirre et al., 1998); and the sources of this variation are poorly understood. The ubiq-uitous low frequency fluctuations in “resting state” hemodynamics (Biswal et al., 1995;Mayhew et al., 1996;Lowe et al., 1998;Obrig et al., 2000;Spitzer et al., 2001;Greicius et al., 2003;Majeed et al., 2009) could be one possible source of the variation in subsequent stimulus-evoked responses. In the case of ongoing and evoked hemodynamics, a recent study suggests that ongoing hemody-namic activity may contribute to the variation in stimulus-evoked hemodynamic responses (Fox et al., 2006) in a similar fashion to that in which resting cortical activity contributes to the variance in evoked neural responses (Arieli et al., 1996). Fox and colleagues measured task related BOLD signal changes in motor cortex and found inter-trial variability. Subsequent subtraction of coherent
spontaneous BOLD fluctuations from the cortex contralateral to that activated by the task, reduced inter-trial variability and therefore suggested a superposition of evoked and ongoing hemo-dynamics. We previously investigated this phenomenon in a well defined animal model, the whisker barrel somatosensory cortex of the rodent (Saka et al., 2010). This animal model allowed the use of invasive 2-dimensional optical imaging spectroscopy (2D-OIS,
animal model would have resulted in the subtraction of sensory “responses” rather than just coherent spontaneous fluctuations. Therefore, to investigate the origin of the difference in response depending on phase, null trials of identical duration were col-lected where no stimuli were presented. Phase averaged null trials were subtracted from their phase averaged counterparts and the similarity of the resultant time series strongly suggested that the mechanism that resulted in the difference between phase aver-aged trials was a linear superposition of ongoing and evoked cortical hemodynamics (Figure 4). However, this previous analy-sis neglected to examine the possible influence of the size of the pre-stimulus hemodynamic fluctuations. Indeed, if our previous assertion regarding a linear superposition was correct then the size of the pre-stimulus fluctuation should also influence hemo-dynamic response magnitude. Thus to further examine inter-trial variability in sensory-evoked hemodynamic responses in terms of ongoing pre-stimulus fluctuations, subsequent analyses are performed to examine the putative influence of the inter-trial vari-ability in size of pre-stimulus fluctuation and the magnitude of subsequent evoked responses.
MATERIALS AND METHODS
As data has been previously presented (Saka et al., 2010) the experimental methods are explained only briefly here.
ANIMAL PREPARATION (N=6)
Female Hooded Lister rats weighing between 250 and 400 g were kept in a 12 h dark/light cycle environment at a temperature of 22˚C with food and waterad libitum. Prior to surgery, animals were anesthetized with urethane (1.25 g/kg i.p.). Rectal tempera-ture was maintained at 37˚C throughout surgical and experimental procedures using a homeothermic blanket (Harvard). Animals were tracheotomized to allow artificial ventilation and measure-ment of end-tidal CO2. Ventilation parameters were adjusted
to maintain blood gas measurements and end-tidal CO2 within
physiological limits. The femoral vein and artery were cannu-lated to allow drug infusion and measurement of mean arterial blood pressure respectively. Phenylephrine (0.13–0.26 mg/h) was infused to maintain blood pressure between physiological limits (MABP, 100–110 mmHg). Animals were placed in a stereotaxic frame (Kopf Instruments) and the skull overlying the somatosen-sory cortex was thinned to translucency with a dental drill under constant cooling with saline. A plastic “well” was attached to the thinned skull and filled with saline (37˚C) to reduce specularities from the skull surface. All procedures were carried out in accord with Home Office regulations.
2D OPTICAL IMAGING SPECTROSCOPY ESTIMATES OF HEMOGLOBIN CHANGES
Images of the cortical surface were collected with a high-speed CCD camera. The cortex was sequentially illuminated with four wavelengths (two pairs) of light (495±31 and 587±9 nm FWHM; 559±16 and 575±14 nm FWHM) with a Lambda DG-4 high-speed filter changer (Sutter Instrument, Novato, CA, USA) and stabilized 300W xenon arc light source. The wavelengths in each pair are chosen such that they sample a similar tissue volume. However, for each of the two wavelengths in each pair, one is asso-ciated with a greater absorption co-efficient for oxyhemoglobin
than deoxyhemoglobin and the other is associated with a greater absorption co-efficient for deoxyhemoglobin than oxyhemoglo-bin. The camera data collection (30 Hz) was synchronized to filter changing such that each subsequent image was collected with a different wavelength of cortical illumination. This “multi-wavelength” optical imaging data were subject to spectral analysis using a modified Beer Lambert law that corrects for the wave-length dependency of photon path wave-length (Mayhew et al., 1999) and has been used previously to analyze this form of spectroscopic data (Berwick et al., 2005, 2008). This permitted an estimation of changes in total hemoglobin concentration (Hbt), oxyhemoglo-bin concentration (HbO2), and deoxyhemoglobin concentration
(Hbr). As data from each of the four wavelengths of illumination was required for spectral estimates of hemoglobin changes, the effective sampling frequency was that of the camera frame rate divided by 4 (30/4=7.5). The baseline value of cortical hemoglo-bin concentration was set at 104µM which was estimated by a previous MRI study in rodent (Kennerley et al., 2005).
STIMULUS PRESENTATION, PARADIGMS, AND DATA ANALYSIS All stimulus presentation was controlled through a 1401plus (CED Ltd, UK) running custom-written code with stimulus onset time locked to the CCD camera. Electrical stimulation of the whole whisker pad was delivered via stainless steel electrodes inserted in an anterior direction each side of the whisker pad (Mayhew et al., 2000; Jones et al., 2001, 2002, 2004, 2005; Sheth et al., 2003). All electrical stimuli were presented for 3 s at 1 Hz with a 0.3 ms individual pulse width at an intensity of 1.2 mA (Jones et al., 2004, 2005, 2008). No changes in MABP, heart rate, or PCO2
were observed at this stimulus intensity suggesting that the mea-sured hemodynamic response was not contaminated by systemic physiological changes. Trials were 24 s long with a 1 s inter-trial interval. Stimulation occurred on the eight second of each trial. Experimental runs consisted of 30 trials. In each experimental run stimuli were presented or data with identical parameters were collected without presenting stimuli. Six to nine experimen-tal runs (180–270 trials) where stimuli were presented (termed “stimulus-evoked”) were collected for each animal (n=6).
For each animal, trial-averaged images of total hemoglobin concentration changes following stimulus presentation were ana-lyzed using a signal source separation algorithm (Molgedey and Schuster, 1994) as previously described (Zheng et al., 2001). This procedure has been shown on numerous occasions to localize spatially discrete activations of barrel cortex which show excel-lent concordance with cytochrome oxidase histology in tangential (Jones et al., 2001, 2002) and coronal sections (Jones et al., 2004). “Barrel maps” were registered with images of cortical surface for selection of a region of interest (ROI). A parenchymal ROI was selected in the center of the active barrel region avoiding overlying surface vasculature. This ROI was used to provide time series of hemodynamics for each “stimulus-evoked” trial for each animal.
ANALYSES AND RESULTS
INDIVIDUAL TRIAL DATA DISPLAY INTER-TRIAL VARIABILITY AND SPONTANEOUS PRE-STIMULUS FLUCTUATIONS
Saka et al. Cortical hemodynamic fluctuations and sensory-evoked responses
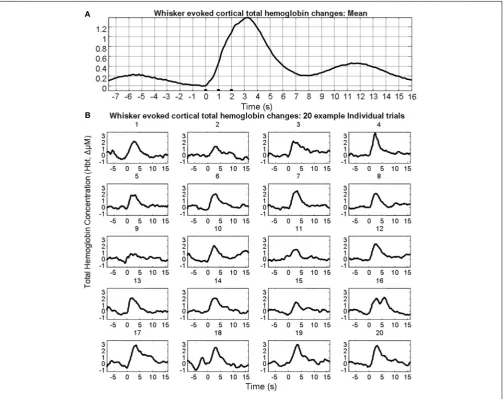
FIGURE 1 | Sensory stimuli evoked hemodynamic responses in contralateral somatosensory cortex. (A)Trial and animal averaged cortical total hemoglobin response to whisker pad stimuli.(B)Example of 20 individual “un-averaged” trials.
cortex that could be observed following trial and animal averag-ing. However, individual trials displayed considerable variability both in terms of evoked responses and pre-stimulus fluctuations (Figure 1B).
METRICS OF THE SIZE OF PRE-STIMULUS FLUCTUATIONS AND RESPONSE MAGNITUDE
Our previous investigation demonstrated that the phase of the pre-stimulus fluctuations in cerebral hemodynamics at stimulus onset influenced the magnitude of subsequent stimulus-evoked hemodynamics (Saka et al., 2010). However, the analysis neglected to examine whether the magnitude of the pre-stimulus fluctua-tion influenced the magnitude of the sensory-evoked response. To investigate these issues further analyses were performed on the data set presented in (Saka et al., 2010). As the pre-stimulus fluctu-ations in total hemoglobin concentration are oscillatory in nature, examining the magnitude of the time series at a particular time point would not accurately characterize the size of the fluctuation.
As such, the standard deviation of the fluctuation of the entire pre-stimulus time period (8 s) was chosen as the metric of the size of the pre-stimulus fluctuation. The standard deviation has the advantage of being expressed in the same units as the data (unlike variance) and is more insensitive to DC deviations from zero than the root mean square (RMS). However, similar results can be obtained regardless of which metric is chosen (variance, standard deviation, RMS, data not shown). The standard devia-tion of 8 s pre-stimulus of each trial was calculated as a measure of the magnitude of the pre-stimulus fluctuation (Figure 2). The peak of the response following stimulus presentation was taken as a metric of response magnitude (Figure 2).
ASSOCIATION BETWEEN SIZE OF PRE-STIMULUS FLUCTUATIONS AND RESPONSE MAGNITUDE
FIGURE 2 | Metrics of individual trials of sensory-evoked total hemoglobin concentration changes that were used for subsequent analyses.
FIGURE 3 | Magnitude of whisker evoked Total Hemoglobin Concentration (Hbt) responses compared to the size of ongoing pre-stimulus fluctuations for each individual trial.
cortical hemodynamic responses. The size of the pre-stimulus fluc-tuations was modestly (R=0.44) but significantly (p<0.0001) correlated with response magnitude (Figure 3).
PHASE OF SPONTANEOUS PRE-STIMULUS HEMODYNAMIC FLUCTUATIONS AT STIMULUS ONSET
In our previous investigation this linear superposition of ongoing and evoked hemodynamics resulted in different evoked response magnitude because depending on the phase of the ongoing fluc-tuation at stimulus onset, the flucfluc-tuation was either rising or descending. If the ongoing fluctuation was descending at stim-ulus onset, the ongoing fluctuation “subtracted” from the evoked response, resulting in responses of smaller magnitude. For other phases where the ongoing fluctuations were rising, the ongoing fluctuation“added”to the response, resulting in responses of larger magnitude. This phenomenon of linear superposition of evoked and ongoing cortical hemodynamics was suggested by comparing “phase averaged” stimulus-evoked trials with trials collected in the absence of stimuli. The results of this analysis are displayed again to aid the reader. In short, trials were assigned to one of four groups (0–90˚; 90–180˚; 180–270˚; 270–360˚) based on the phase of pre-stimulus hemodynamic fluctuation at pre-stimulus onset. A Hilbert
transform (Matlab™function “Hilbert”) was used to calculate the phase of the ongoing pre-stimulus fluctuations in total hemoglo-bin concentration (Le Van Quyen et al., 2001;Pikovsky et al., 2001;
Haslinger et al., 2006;Le Van Quyen and Bragin, 2007;Saka et al., 2010). The magnitude of the stimulus-evoked increases in Hbt was smallest in the 0–90˚ group, followed by in the 270–360˚ group, and 90–180˚ groups and was largest in the 180–270˚ group (Figure 4). Data from trials in which no stimuli were presented were also aver-aged based on the phase of their Hbt fluctuations at a time point that corresponded to stimulus onset (8 s in each trial) in the stimu-lus presentation trials. This resulted in “phase averaged” time series that were identical to phase averaged stimulus-evoked responses during the “pre-stimulus” period (compareFigures 4A,B). How-ever, the time series differed after stimulus presentation with the phase averaged null trials providing a useful indication of the aver-age “behavior” of the hemodynamics for each phase group had a stimulus not occurred. To demonstrate that these differences in stimulus-evoked responses in each phase group were due to super-position of ongoing and evoked hemodynamics, phase averaged “nulls” were subtracted from “phase averaged” stimulus-evoked responses. This subtraction resulted in four similar time series that closely resembled the time series of the mean of all trials without phase averaging (Figure 4C). In the previous investigation tri-als were taken from all animtri-als and grouped together based on their phase at stimulus onset (Saka et al., 2010). Before conduct-ing subsequent analyses, the data was examined in each animal to confirm that this phenomenon was evident in each individual animal (Figure 5).
ASSOCIATION BETWEEN THE SIZE OF PRE-STIMULUS FLUCTUATIONS AND RESPONSE MAGNITUDE VARIES DEPENDING ON THE PHASE OF THE PRE-STIMULUS FLUCTUATIONS AT STIMULUS ONSET
Saka et al. Cortical hemodynamic fluctuations and sensory-evoked responses
FIGURE 4 | Linear superposition of sensory-evoked and ongoing cortical total hemoglobin concentration changes (Hbt). (A)Hbt responses to sensory stimuli were grouped based on the phase of their pre-stimulus fluctuations at stimulus onset and averaged.(B)Hbt trial data without
presentation of sensory stimuli (“nulls”) are grouped based on the phase of their pre-stimulus fluctuations at the same time point within each trial and averaged.(C)Subtraction of the phase averaged stimulus-evoked responses from their phase averaged null counterpart results in four similar time series.
descended at stimulus onset thus subtracting from the stimulus-evoked response resulted in the smallest stimulus-evoked response (compare Figure 4BwithFigure 4A). As such, in this phase group it would be expected that the magnitude of the pre-stimulus fluctuation would be negatively correlated with response size. Indeed if the magnitude of the pre-stimulus fluctuations for each trial in this phase group are examined there is a modest negative correlation (r= −0.25,p<0.0001,Figure 6A). For trials in the fourth group (180–270˚) the ongoing fluctuation “ascended” following stimulus presentation and peaked at a similar time to the evoked response (compareFigure 4BwithFigure 4A). Consequently, the largest response occurred in this phase group as the “largest” addition of ongoing and evoked hemodynamics could occur (Figure 4). Indeed the correlation between the pre-stimulus fluctuation mag-nitude and evoked response magmag-nitude was greatest in this phase
group (Figure 6D). In the second (270–360˚) and third group (90– 180˚) the ongoing fluctuations are positive during the time period of the evoked response although they do not peak at an identi-cal time point to the evoked response (compareFigure 4Bwith Figure 4A). As such, a more modest correlation would be expected than for trials than in the fourth group (180–270˚). Indeed the correlations were r=0.31,p<0.0001 andr=0.55, p<0.0001 respectively (Figures 6B,C).
ASSOCIATION BETWEEN THE SIZE OF PRE-STIMULUS FLUCTUATIONS CAN BE INCREASED IF THE “POLARITY” OF THE SIZE METRIC IS ALTERED DEPENDING ON PHASE GROUP
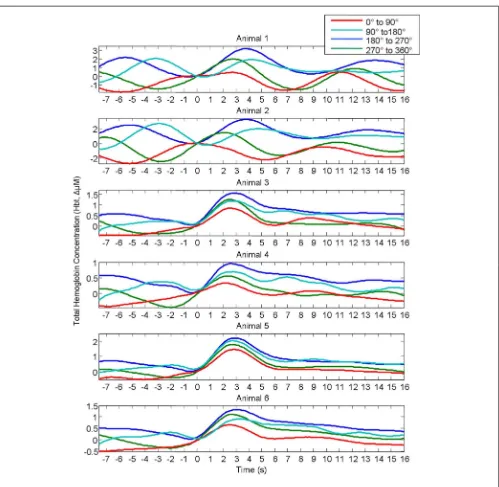
FIGURE 5 | Rather than grouping all individual trials together from all animals, Hbt responses to sensory stimuli in each individual animal were grouped based on the phase of their pre-stimulus fluctuations at stimulus onset and averaged.In each individual animal responses differ depending on phase group.
and fourth group (180–270˚) these values were left unaltered. However, as the pre-stimulus magnitudes in the first phase group (0–90˚) were negative we altered the polarity (i.e., multiplied by −1) of the pre-stimulus fluctuation sizes for this group. We then re-calculated the correlation co-efficient between pre-stimulus fluctuation size and response magnitude for individual trials from all phase groups (Figure 7). This resulted in a higher corre-lation co-efficient (r=0.64) than was observed before altering the polarity of the pre-stimulus size values in the first group (r=0.44).
Saka et al. Cortical hemodynamic fluctuations and sensory-evoked responses
FIGURE 6 | Magnitude of whisker evoked Total Hemoglobin Concentration (Hbt) compared to the size of ongoing pre-stimulus fluctuations for each individual trial for each phase group. (A)Magnitude of evoked Hbt responses compared to the size of ongoing pre-stimulus fluctuations for each individual trial in “Phase group 1” (0–90˚).(B)Magnitude of evoked Hbt responses compared to the size of ongoing pre-stimulus
fluctuations for each individual trial in “Phase group 2” (270–360˚).(C)
Magnitude of evoked Hbt responses compared to the size of ongoing pre-stimulus fluctuations for each individual trial in “Phase group 3” (90–180˚).
(D)Magnitude of evoked Hbt responses compared to the size of ongoing pre-stimulus fluctuations for each individual trial in “Phase group 4” (180–270˚). Trials from each individual animal are shown as different colors.
group (Figure 8). Phase group 3 (90–180˚) was slightly (∼18%)
but significantly higher (one way ANOVAF=3.680, Bonferroni corrected post hoc testsp<0.05) than the other phase groups This slight difference is most likely due to the pre-stimulus period not being infinite in length. However, experiments were designed to maximize the number of trials that could be col-lected in each experimental subjects and as such the shortest pre-stimulus period was selected that would provide estimates of phase and size of fluctuations (Saka et al., 2010). Notwith-standing, to address these two possible caveats we re-analyzed data following normalizing each animals response magnitudes and size of pre-stimulus fluctuations between zero and unity for each phase group (Figure 9). Significant correlations between the size of the pre-stimulus fluctuation and the magnitude of the response were still apparentt in phase groups (1, 3, and 4) but not the group that was associated with the most modest correlation, phase group 2.
DISCUSSION
FIGURE 7 | Magnitude of evoked Hbt responses compared to the magnitude of ongoing pre-stimulus fluctuations for each individual trial following reversal of polarity of pre-stimulus values in phase group 1 (0–90˚).
FIGURE 8 | Bar chart displaying the mean size of the pre-stimulus fluctuations in Hbt in each trial in each phase group.Error bars are SD.
would have ascended had a stimulus not been presented, there is a positive correlation which varies in its degree depending on phase. In contrast to the result of analyses presented here and inSaka et al. (2010) a recent conference report suggested that neither phase or magnitude of pre-stimulus BOLD fMRI fluctuations are related to the size of sensory-evoked hemodynamic signals ( Her-man et al., 2010). However, given the manner in which both phase of the pre-stimulus fluctuations influences whether the size of the
fluctuation is positively or negatively correlated with the response size, it may be difficult to discern the association between the pre-stimulus fluctuation and the subsequent evoked response. Even if phase is examined in isolation, the relationship is not straight-forward as the response magnitude increases in this order: group 1 (0–90˚); group 2 (270–360˚); group 3 (90–180˚); and group 4 (180–270˚). Consequently if investigators attempt to examine cor-relations between phase or size of pre-stimulus fluctuations and subsequent responses then it may be difficult to observe such asso-ciations even if they are present within the data set. Indeed, as different analysis methodology to that presented (Fox et al., 2006) also suggests that a mechanism associated with inter-trial variabil-ity in stimulus-evoked hemodynamics is a linear superposition of evoked and ongoing hemodynamics, then both phase and size of the pre-stimulus fluctuation would be expected to be associ-ated with the magnitude of the subsequent evoked hemodynamic response.
Given the influence of ongoing hemodynamic fluctuations on the magnitude of sensory-evoked hemodynamic responses, the question arises as to whether individual trials of hemodynamics based imaging data are useful markers of inter-trial variabil-ity of evoked activvariabil-ity. The correlation co-efficient calculated in the present study corresponds to an R2 of 0.4, thus leaving a
larger proportion of inter-trial variability in hemodynamics to be explained by sources other than pre-stimulus hemodynamic fluctuations.Sheth et al. (2003)measured neural and cortical total hemoglobin responses to sensory stimuli in an identical animal model to that used here. They found that for individual trials the relationship between whisker evoked activity and hemodynam-ics corresponded to aR2=0.36. Therefore, if the study ofSheth
et al. (2003)and the present investigation are taken in tandem, it appears that∼80% of the variance in measured hemodynamic
response magnitude could be explained. Given that each of the techniques will not be without some measurement error, this seems appropriate. The obvious limitation with the current and previous investigation (Saka et al., 2010) is that no measurements of neural activity were made. As such, the degree to which inter-trial variability in magnitudes of evoked activity and pre-stimulus hemodynamic fluctuations influence the magnitude of evoked hemodynamics in the same data set remains to be described. Furthermore, the factors influencing the phase and magnitude of pre-stimulus fluctuations also need to be elucidated. We have previously extensively discussed the possible neural and “vascu-lar” origins of spontaneous hemodynamics (Saka et al., 2010). Notwithstanding, further work with combinations of electrophys-iological and optical techniques (e.g.,Boorman et al., 2010) will be required before inter-trial variability in hemodynamics is fully understood.
[image:8.595.46.293.326.573.2]Saka et al. Cortical hemodynamic fluctuations and sensory-evoked responses
FIGURE 9 | Magnitude of whisker evoked Total Hemoglobin Concentration (Hbt) compared to the size of ongoing pre-stimulus fluctuations for each individual trial for each phase group.For each animal, for each phase group size the sizes of ongoing pre-stimulus fluctuations and magnitudes of responses were normalized between zero and unity.(A)Magnitude of evoked Hbt responses compared to the size of ongoing pre-stimulus fluctuations for each individual trial in “Phase group 1”
(0–90˚).(B)Magnitude of evoked Hbt responses compared to the size of ongoing pre-stimulus fluctuations for each individual trial in “Phase group 2” (270–360˚).(C)Magnitude of evoked Hbt responses compared to the size of ongoing pre-stimulus fluctuations for each individual trial in “Phase group 3” (90–180˚).(D)Magnitude of evoked Hbt responses compared to the size of ongoing pre-stimulus fluctuations for each individual trial in “Phase group 4” (180–270˚). Trials from each individual animal are shown as different colors.
evoked fMRI response may also contain “information” not only about evoked activity but also prior ongoing activity. Given the temporal lag for hemodynamics to peak following both spon-taneous ongoing and evoked activity it could be the case that hemodynamics at a single time point reflect neural activity for several preceding seconds. Indeed, several recent reports sug-gest that attributes of pre-stimulus neural activity as measured by EEG are predictive of the magnitude of subsequent evoked fMRI responses (Becker et al., 2011;Scheeringa et al., 2011). These studies demonstrated that both phase (Scheeringa et al., 2011) and power (Becker et al., 2011; Scheeringa et al., 2011) of the pre-stimulus ongoing EEG Alpha rhythm influenced subsequent fMRI responses. In the case of Alpha power, this influence on the magnitude of evoked fMRI responses, was due to a linear superpo-sition of evoked and the aspects of spontaneous fMRI fluctuations that could be attributed to ongoing pre-stimulus alpha waves. The phase of alpha waves has also been found to be relevant to cog-nition such as whether subjects perceive a visual stimulus (Busch et al., 2009). Low frequency oscillations in neural activity that may be germane to spontaneous fluctuations in fMRI have also suggested to be important for perception (Monto et al., 2008), behavior, and even conscious awareness (VanRullen and Koch,
2003). For instanceMonto et al. (2008)showed that the phase of low frequency EEG fluctuations could also determine whether or not subjects could detect a somatosensory stimuli. This has lead some authors to suggest that low frequency fluctuations may be away of selecting between sensory events (Schroeder and Lakatos, 2009).
The present study extends and confirms previous findings of a linear superposition of evoked and ongoing cortical hemodynam-ics (Fox et al., 2006;Saka et al., 2010) by suggesting that the size, in addition to the phase, of pre-stimulus hemodynamic fluctua-tions are associated with subsequent evoked response magnitude. A greater understanding of the relationships between evoked and ongoing activity, ongoing activity and spontaneous fluctuations in hemodynamics and fMRI signals, and evoked and ongoing fMRI signals are required to accurately interpret individual trials of fMRI data.
ACKNOWLEDGMENTS
REFERENCES
Aguirre, G. K., Zarahn, E., and D’Esposito, M. (1998). The vari-ability of human, BOLD hemo-dynamic responses.Neuroimage 8, 360–369.
Arieli, A., Sterkin, A., Grinvald, A., and Aertsen, A. (1996). Dynam-ics of ongoing activity: explanation of the large variability in evoked cortical responses. Science 273, 1868–1871.
Becker, R., Reinacher, M., Freyer, F., Villringer, A., and Ritter, P. (2011). How ongoing neuronal oscillations account for evoked FMRI variability. J. Neurosci. 31, 11016–11027.
Berwick, J., Johnston, D., Jones, M., Martindale, J., Martin, C., Ken-nerley, A. J., et al. (2008). Fine detail of neurovascular coupling revealed by spatiotemporal analy-sis of the hemodynamic response to single whisker stimulation in rat barrel cortex. J. Neurophysiol. 99, 787–798.
Berwick, J., Johnston, D., Jones, M., Martindale, J., Redgrave, P., McLoughlin, N., et al. (2005). Neurovascular coupling investi-gated with two-dimensional optical imaging spectroscopy in rat whisker barrel cortex. Eur. J. Neurosci.22, 1655–1666.
Biswal, B., Yetkin, F. Z., Haughton, V. M., and Hyde, J. S. (1995). Functional connectivity in the motor cortex of resting human brain using echo-planar MRI.Magn. Reson. Med.34, 537–541.
Boorman, L., Kennerley, A. J., John-ston, D., Jones, M., Zheng, Y., Red-grave, P., et al. (2010). Negative blood oxygen level dependence in the rat: a model for investigating the role of suppression in neu-rovascular coupling.J. Neurosci.30, 4285–4294.
Busch, N. A., Dubois, J., and Van-Rullen, R. (2009). The phase of ongoing EEG oscillations predicts visual perception. J. Neurosci. 29, 7869–7876.
Devor, A., Dunn, A. K., Andermann, M. L., Ulbert, I., Boas, D. A., and Dale, A. M. (2003). Coupling of total hemoglobin concentration, oxy-genation, and neural activity in rat somatosensory cortex. Neuron 39, 353–359.
Devor, A., Hillman, E. M., Tian, P., Waeber, C., Teng, I. C., Ruvin-skaya, L., et al. (2008). Stimulus-induced changes in blood flow and 2-deoxyglucose uptake dissociate in ipsilateral somatosensory cortex.J. Neurosci.28, 14347–14357.
Fox, M. D., Snyder, A. Z., Zacks, J. M., and Raichle, M. E. (2006). Coher-ent spontaneous activity accounts for trial-to-trial variability in human evoked brain responses.Nat. Neu-rosci.9, 23–25.
Golanov, E. V., Yamamoto, S., and Reis, D. J. (1994). Spontaneous waves of cerebral blood flow asso-ciated with a pattern of electrocor-tical activity. Am. J. Physiol.266, R204–R214.
Greicius, M. D., Krasnow, B., Reiss, A. L., and Menon, V. (2003). Func-tional connectivity in the rest-ing brain: a network analysis of the default mode hypothesis. Proc. Natl. Acad. Sci. U.S.A.100, 253–258.
Haslinger, R., Ulbert, I., Moore, C. I., Brown, E. N., and Devor, A. (2006). Analysis of LFP phase pre-dicts sensory response of bar-rel cortex. J. Neurophysiol. 96, 1658–1663.
Herman, P., Sanganahalli, B. G., Sachdev, R. N. S., McCormick, D., and Hyder, F. (2010). Effect of fluctuations in BOLD signal on trial-to-trial variability of BOLD responses. Soc. Neurosci. Abstr. 178.16.
Jones, M., Berwick, J., Hewson-Stoate, N., Gias, C., and Mayhew, J. (2005). The effect of hypercapnia on the neural and hemodynamic responses to somatosensory stimulation. Neu-roimage27, 609–623.
Jones, M., Berwick, J., Johnston, D., and Mayhew, J. (2001). Concur-rent optical imaging spectroscopy and laser-Doppler flowmetry: the relationship between blood flow, oxygenation, and volume in rodent barrel cortex. Neuroimage 13, 1002–1015.
Jones, M., Berwick, J., and May-hew, J. (2002). Changes in blood flow, oxygenation, and volume fol-lowing extended stimulation of rodent barrel cortex.Neuroimage15, 474–487.
Jones, M., Devonshire, I. M., Berwick, J., Martin, C., Redgrave, P., and May-hew, J. (2008). Altered neurovas-cular coupling during information-processing states.Eur. J. Neurosci.27, 2758–2772.
Jones, M., Hewson-Stoate, N., Mar-tindale, J., Redgrave, P., and May-hew, J. (2004). Nonlinear coupling of neural activity and CBF in rodent barrel cortex.Neuroimage22, 956–965.
Kennerley, A. J., Berwick, J., Martin-dale, J., Johnston, D., Papadakis, N., and Mayhew, J. E. (2005). Con-current fMRI and optical measures
for the investigation of the hemo-dynamic response function.Magn. Reson. Med.54, 354–365. Kwong, K. K., Belliveau, J. W., Chesler,
D. A., Goldberg, I. E., Weisskoff, R. M., Poncelet, B. P., et al. (1992). Dynamic magnetic resonance imag-ing of human brain activity dur-ing primary sensory stimulation. Proc. Natl. Acad. Sci. U.S.A. 89, 5675–5679.
Le Van Quyen, M., and Bragin, A. (2007). Analysis of dynamic brain oscillations: methodologi-cal advances. Trends Neurosci. 30, 365–373.
Le Van Quyen, M., Foucher, J., Lachaux, J., Rodriguez, E., Lutz, A., Martinerie, J., et al. (2001). Comparison of Hilbert transform and wavelet methods for the analysis of neuronal synchrony.J. Neurosci. Methods111, 83–98.
Logothetis, N. K., Pauls, J., Augath, M., Trinath, T., and Oeltermann, A. (2001). Neurophysiological investi-gation of the basis of the fMRI signal. Nature412, 150–157.
Lowe, M. J., Mock, B. J., and Soren-son, J. A. (1998). Functional con-nectivity in single and multislice echoplanar imaging using resting-state fluctuations. Neuroimage 7, 119–132.
Majeed, W., Magnuson, M., and Keil-holz, S. D. (2009). Spatiotemporal dynamics of low frequency fluc-tuations in BOLD fMRI of the rat. J. Magn. Reson. Imaging 30, 384–393.
Mayhew, J., Johnston, D., Berwick, J., Jones, M., Coffey, P., and Zheng, Y. (2000). Spectroscopic analysis of neural activity in brain: increased oxygen consumption following acti-vation of barrel cortex.Neuroimage 12, 664–675.
Mayhew, J., Zheng, Y., Hou, Y., Vuk-sanovic, B., Berwick, J., Askew, S., et al. (1999). Spectroscopic analy-sis of changes in remitted illumi-nation: the response to increased neural activity in brain.Neuroimage 10, 304–326.
Mayhew, J. E., Askew, S., Zheng, Y., Por-rill, J., Westby, G. W., Redgrave, P., et al. (1996). Cerebral vasomotion: a 0.1-Hz oscillation in reflected light imaging of neural activity. Neuroim-age4, 183–193.
Molgedey, L., and Schuster, H. G. (1994). Separation of a mixture of independent signals using time delayed correlations.Phys. Rev. Lett. 72, 3634–3637.
Monto, S., Palva, S., Voipio, J., and Palva, J. M. (2008). Very slow EEG fluctuations predict the dynamics of
stimulus detection and oscillation amplitudes in humans.J. Neurosci. 28, 8268–8272.
Obrig, H., Neufang, M., Wenzel, R., Kohl, M., Steinbrink, J., Einhaupl, K., et al. (2000). Spontaneous low frequency oscillations of cere-bral hemodynamics and metabolism in human adults. Neuroimage 12, 623–639.
Ogawa, S., Tank, D. W., Menon, R., Ellermann, J. M., Kim, S. G., and Merkle, H., et al. (1992). Intrinsic signal changes accompanying sen-sory stimulation: functional brain mapping with magnetic resonance imaging.Proc. Natl. Acad. Sci. U.S.A. 89, 5951–5955.
Pikovsky, A., Rosenblum, M., and Kurths, J. (2001). Synchronization – A Universal Concept in Nonlin-ear Sciences. Cambridge: Cambridge University Press.
Saka, M., Berwick, J., and Jones, M. (2010). Linear superposition of sensory-evoked and ongoing cortical hemodynamics. Front. Neuroenergetics 2:23. doi:10.3389/fnene.2010.00023 Scheeringa, R., Mazaheri, A., Bojak, I.,
Norris, D. G., and Kleinschmidt, A. (2011). Modulation of visu-ally evoked cortical FMRI responses by phase of ongoing occipital alpha oscillations. J. Neurosci. 31, 3813–3820.
Schroeder, C. E., and Lakatos, P. (2009). Low-frequency neuronal oscillations as instruments of sensory selection. Trends Neurosci.32, 9–18. Sheth, S., Nemoto, M., Guiou, M.,
Walker, M., Pouratian, N., and Toga, A. W. (2003). Evaluation of cou-pling between optical intrinsic sig-nals and neuronal activity in rat somatosensory cortex. Neuroimage 19, 884–894.
Shmuel, A., and Leopold, D. A. (2008). Neuronal correlates of spontaneous fluctuations in fMRI signals in mon-key visual cortex: implications for functional connectivity at rest.Hum. Brain Mapp.29, 751–761. Spitzer, M. W., Calford, M. B., Clarey,
J. C., Pettigrew, J. D., and Roe, A. W. (2001). Spontaneous and stimulus-evoked intrinsic optical signals in primary auditory cor-tex of the cat. J. Neurophysiol.85, 1283–1298.
VanRullen, R., and Koch, C. (2003). Is perception discrete or continuous? Trends Cogn. Sci.7, 207–213. Zheng, Y., Johnston, D., Berwick, J.,
Saka et al. Cortical hemodynamic fluctuations and sensory-evoked responses
Conflict of Interest Statement: The authors declare that the research was conducted in the absence of any com-mercial or financial relationships that could be construed as a potential con-flict of interest.
Received: 14 June 2012; accepted: 16 October 2012; published online: 05 November 2012.
Citation: Saka M, Berwick J and Jones M (2012) Inter-trial variability in sensory-evoked cortical hemodynamic responses:
the role of the magnitude of pre-stimulus fluctuations. Front. Neuroenerg. 4:10. doi: 10.3389/fnene.2012.00010 Copyright © 2012 Saka, Berwick and Jones. This is an open-access article dis-tributed under the terms of the Creative