This is a repository copy of Selenium speciation in framboidal and euhedral pyrites in shales..
White Rose Research Online URL for this paper: http://eprints.whiterose.ac.uk/86587/
Version: Accepted Version
Article:
Matamoros-Veloza, A, Peacock, CL and Benning, LG (2014) Selenium speciation in framboidal and euhedral pyrites in shales. Environmental Science and Technology, 48 (16). 8972 - 8979. ISSN 0013-936X
https://doi.org/10.1021/es405686q
[email protected] https://eprints.whiterose.ac.uk/ Reuse
Unless indicated otherwise, fulltext items are protected by copyright with all rights reserved. The copyright exception in section 29 of the Copyright, Designs and Patents Act 1988 allows the making of a single copy solely for the purpose of non-commercial research or private study within the limits of fair dealing. The publisher or other rights-holder may allow further reproduction and re-use of this version - refer to the White Rose Research Online record for this item. Where records identify the publisher as the copyright holder, users can verify any specific terms of use on the publisher’s website.
Takedown
If you consider content in White Rose Research Online to be in breach of UK law, please notify us by
Selenium speciation in framboidal and euhedral pyrites in shales
1
2
Adriana Matamoros-Veloza*, Caroline L. Peacock and Liane G. Benning*
3
Cohen Geochemistry Laboratory, School of Earth and Environment, University of Leeds,
4
Leeds LS2 9JT, U.K
5
6
ABSTRACT
7
The release of Se from shales is poorly understood because its occurrence, distribution and
8
speciation in the various components of shale are unknown. To address this gap we
9
combined bulk characterisation, sequential extractions, and spatially resolved µ-focus
10
spectroscopic analyses and investigated the occurrence and distribution of Se and other
11
associated elements (Fe, As, Cr, Ni, and Zn) and determined the Se speciation at the µ -scale
12
in typical, low bulk Se containing shales. Our results revealed Se primarily correlated with
13
the pyrite fraction with exact Se speciation highly dependent on pyrite morphology. In
14
euhedral pyrites, we found Se(-II) substitutes for S in the mineral structure. However, we also
15
demonstrate that Se is associated with framboidal pyrite grains as a discrete, independent
16
FeSex phase. The presence of this FeSex species has major implications for Se release,
17
because FeSex species oxidise much faster than Se substituted in the euhedral pyrite lattice.
18
Thus, such an FeSex species will enhance and control the dynamics of Se weathering and
19
release into the aqueous environment.
20
Se
S
S
S
INTRODUCTION
22
Selenium (Se) is an essential micronutrient but only within a very narrow concentration
23
range, above which it is toxic.(1) Selenium is an antioxidant that prevents tissue damage and
24
aids growth and metabolic processes,(2) however, an intake dose above 450 µg/day Se can
25
disrupt dermal and neurological processes and ultimately be fatal.(3-4) The use of Se
26
contaminated groundwaters for drinking and Se contaminated soils for agricultural purposes
27
introduces Se into the human food chain. Se poisoning has been reported at several locations
28
with extreme cases in China (Yutangba),(5) India (Punjab) and in Colombia (Villeta).(6-8) In
29
order to help prevent future health hazards related to Se toxicity, we need to improve our
30
understanding of the factors and mechanisms that control its fate and mobility in the
31
environment.
32
A variety of geological and geochemical factors have been suggested as possible controls for
33
the release of Se from rocks (e.g., rock type, weathering environment, groundwater
34
composition, organic matter content, Fe or Se speciation etc.). (5,9-10) In Se-enriched surface
35
environments, shales are an important source of Se to soils. (5,8,11-12) However, the transfer of
36
Se from shale rocks into soils and groundwaters (5) and ultimately to humans via the food
37
chain(6) is poorly constrained. Furthermore, the role of geological settings or specific
38
geochemical reactions leading to the sequestration of Se in shale components are also poorly
39
understood. This is because Se chemistry is highly complex. Selenium occurs in four
40
principal oxidation states -II, 0, IV, VI, but Se(-I) compounds have also been found in nature
41
and Se(II) compounds can be produced synthetically. Se has also six stable isotopes and is
42
therefore of interest as a palaeo-environmental proxy.(12) The most oxidized species, Se(IV)
43
and Se(VI), occur as the oxyanions selenite (SeO3=) and selenate (SeO4=), and they are the
44
most soluble, reactive, bioavailable and therefore the most toxic Se species. Depending on
45
their molecular bonding environment, different Se species have been suggested to be
associated (either surface adsorbed or structurally incorporated) with various possible Se
47
hosting phases.(13-15) In shales, the three main host components of Se are inferred to be
48
silicates, organic matter (OM) or sulfides (primarily pyrite). Organic matter (kerogen
49
fraction) has been suggested as a Se host in shales that are exceptionally Se and carbon rich,
50
and linked to coal beds.(15) However, neither the importance of OM as a Se host, nor a clear
51
correlation between Se and OM in typical black shales, with average lower Se concentrations,
52
have so far been demonstrated. Conversely, several studies proposed pyrite as the possible Se
53
host mineral in shales,(5, 8, 16, 17) yet a mechanistic or speciation related explanation is still
54
lacking. Experimental studies (18-21) suggested that Se is likely either adsorbed / reduced on
55
pre-formed pyrite grains or structurally incorporated into the sulfide phase. (22-23) However, a
56
detailed mechanistic reaction pathway that addresses the uptake of Se into pyrite during
57
pyrite growth, and a Se speciation and detailed structural and molecular bonding environment
58
regardless of pyrite formation pathways, is still lacking. This is despite the fact that pyrite is a
59
well-known sink for metals and, specifically, the accumulation of Se in shales may be used as
60
a tool to interpret palaeo-ocean chemical signals. (12, 21)
61
To better understand Se sequestration and speciation in shales, we examined the distribution
62
of Se and other elements (Fe, As, Cr, Ni, and Zn) in typical shales using bulk geochemical
63
and sequential extractions techniques and combined these with a detailed quantification of the
64
Se speciation in shale-associated pyrite grains at the µ-scale using synchrotron-based µ-X-ray
65
fluorescence (µ-XRF) and µ-X-ray absorption spectroscopy (µ-XAS). Our objectives were:
66
(1) to quantify the speciation and chemical environment of Se in shales (2) to demonstrate a
67
link between Se occurrence, distribution and sulfide morphology and (3) to derive likely
68
chemical pathways for both the accumulation and release of Se in / from shales.
69
EXPERIMENTAL
70
Samples, bulk characterisation and Se analyses
We characterized five shale samples from West Yorkshire, UK(24-25) (samples identified as
72
UK-1 to UK-5; Table S1). Powdered and homogenized samples were analysed for their
73
mineralogical composition (by X-ray diffraction, XRD), major elemental composition (by
74
bulk X-ray fluorescence, XRF), and trace element concentrations (by digestion and
75
inductively coupled plasma mass spectrometry, ICP-MS). Furthermore, we used elemental
76
analyses to determine total and organic carbon, total and reduced inorganic sulfur, and full
77
digestion and hydride generation atomic absorption spectroscopy (HG-AAS) to determine the
78
bulk Se content in each sample. The morphologies of sulfide grains in each sample were
79
identified using electron microscopy and Se concentrations in ~20-40 individual pyrite
80
grains, and a few control points (2-3) on the silicate and organic matter, were analysed by
81
electron microprobe (EMPA). Full details on the geological settings, the formation conditions
82
(i.e., redox etc.) and all methods employed are given in the Supplementary Information (SI).
83
Sequential extractions and total digestions
84
To quantify the Se concentrations associated with different shale fractions, we applied
85
various extraction protocols using a progressively stronger reagents that extract Se associated
86
with specific mineral and/or organic fractions.(16) Protocol A, consisted of a modified
six-87
fraction scheme(17): water soluble (H2O – Se(IV), Se(VI), organic-Se), ligand exchangeable
88
(K2HPO4/KH2PO4– Se(IV) in oxides and clays), base soluble (NaOH - tightly bound Se(IV)
89
and selenides), elemental selenium (Na2SO3– Se(0)), acetic acid soluble (CH3COOH- Se in
90
calcite and gypsum) and residual (HF/H2O2/HNO3 – Se in sulfides, recalcitrant organic
91
matter and in silicates). Protocol B, followed a four-fraction scheme:(26) water
92
soluble/exchangeable (H2O – Se(IV), Se(VI), organic-Se), oxides (NH2OH.HCl - hydrous
Fe-93
Mn oxides), sulfides/organics (KClO3) and residual (HF/H2O2/HNO3 – silicates, carbonates
94
and gypsum). We also carried out a one-step extraction / reduction with Cr(II)Cl2(27) to
quantify Se in diselenides and sulfides. The solutions resulting from each extraction step were
96
analysed for their Se contents using HG-AAS.(16)
97
Se speciation
98
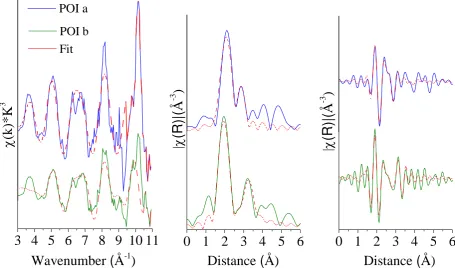
Based on the results from the bulk and sequential analyses described above, we selected the
99
two samples with the highest bulk Se contents (UK-1 and UK-2) for the Se speciation
100
analyses using synchrotron-based µ-XRF and µ-XAS. Polished sections of both samples and
101
eleven standards (prepared as pressed pellets with 6% Se in boron nitride; CAS numbers and
102
chemical formulas in Table S2 in SI) representing four Se oxidation states and Se-organic
103
species were analysed on beamline I18 at the Diamond Light Source Ltd, UK (full details of
104
beamline set up in SI).
105
Using µ-XRF we endeavoured to map in each sample ~ 3-5 areas of interest (100x100 µm,
106
150x150 µm or 350x450 µm). These areas contained various pre-identified pyrite
107
morphology assemblages and in each map the distribution of Se, Fe, Ni, Cu, Zn and As was
108
measured. The µ-XRF beam spot size was 5x6 µm, and the maps were collected using a step
109
size of 5 µm, and an integration time of 1000 ms. Despite multiple attempts we were only
110
able to collect statistically relevant data for sample UK-2, because the fluorescence signal to
111
quantify Se in sample UK-1 was too low. In the various areas of interest in sample UK-2 we
112
identified multiple points of interest (POI) representing either euhedral or framboidal pyrite
113
grains. At each of these POI twelve µ-X-ray absorption near edge spectra (µ-XANES)
114
collected at the same x and y coordinates confirmed there was no beam-induced sample
115
damage or changes in Se oxidation state as a result of µ-XANES measurement (Figure S1).
116
We then selected 14 specific POI that showed strong correlations between Se and the other
117
measured elements and recorded at each of these POI four µ-XANES scans with a step size
118
of 0.4 eV and beam spot size of 5x6 µm. From these 14 POI (Table S3 in SI) only four gave
119
a Se absorption edge jump above 0.1 and we selected two POI for further µ -EXAFS analyses.
POIa was a typical euhedral pyrite grain and POIb represented framboidal pyrite grains. At
121
both POI we collected 16 µ-EXAFS scans at the Se K-edge.
122
The µ-XANES spectra were averaged, normalized, calibrated and compared with standards
123
using the inflection point of the first derivative, the position of the white line and the second
124
peak of the fingerprint as a reference. The energy of the monochromator was calibrated with
125
an Au foil and the K-edge energy for trigonal Se(0) was determined to be 12650 eV. Before
126
processing and analysis, our XANES and EXAFS data were calibrated to the theoretical
127
value for Se(0) of 12658 eV. The µ-EXAFS spectra were averaged, background subtracted
128
and fitted to various theoretical models. Initial fits using Se-C or Se-Se(28) bond distances
129
were unsuccessful and thus organic and elemental Se were discarded from the subsequent
130
fits. The remaining possibilities were either Se(-I) or Se(-II) most likely in sulphides and we
131
included several atoms (Fe, S and Se) and variable numbers of shells at close proximity to Se,
132
similar to the approach of Ryser et al.(29) Specifically, we trial fitted our spectra using the
133
models of pyrite(30) and marcasite(30) (FeS2) and also ferroselite(31) (FeSe2) but fits to
134
marcasite were not successful. We did not fit our spectra to dzharkenite (a ferroselite
135
polymorph FeS2)(29) because this model has Se-Se distances of 2.28Å and our very first tests
136
showed no fit to Se-Se distances for the first shell. Further details of the XANES and
µ-137
EXAFS data analysis are presented in sections 9 and 10 in the SI.
138
RESULTS
139
Bulk composition and Se distribution in the various shale fractions
140
The elemental and mineralogical analyses of all samples (Tables S4-S6 and Figure S2 in SI)
141
revealed the presence of high proportions of silicates (~44-96 %), and medium to low
142
contents of sulfides (~1-5 % pyrite, confirmed by the ~1-3 % reduced inorganic S contents)
143
and low total organic carbon contents (TOC = 2-5 %). Sample UK-5 was lacking pyrite (or
reduced S) and besides silicates, the second dominant phase was calcite. The bulk Se
145
concentrations varied between ~0.8 and ~10 µg/g with the highest values found in samples
146
UK-1 (3.13 ppm), UK-2 (9.77 ppm) and UK-5 (3.84 ppm). All samples were enriched in
147
trace elements (Table S7 in SI) and Se significantly correlated with Ni (correlation
148
coefficient: 0.79), Cu (0.76), Cr (0.83) and V (0.81).
149
Se distribution
150
The sequential extraction results (Table 1, Figure S3 and S4 in SI) are particularly
151
interesting for the samples with highest bulk Se concentrations. The base soluble and residual
152
fractions (protocol A) and the sulfide and organic fractions (protocol B) showed between
153
~74-118% of the total bulk Se associated with sulfides or organic matter (Table 1, Figure S4
154
in SI). Sample UK-5 contained no inorganic sulfur or pyrite and was not further pursued. In
155
UK-1 and UK-2, the next extraction revealed that 50 and 74% respectively of the total Se was
156
sulfide associated, yet the remaining Se was not solely associated with organic matter (Table
157
1 and Figure S4 in SI).
158
Se in individual pyrite grains and the matrix
159
Samples UK-1 to UK-4 all contained pyrite as both euhedral and framboidal morphologies.
160
The Se concentration in individual framboidal or euhedral grains was typically ~ 1-3 orders
161
of magnitude higher than the bulk concentration (Table 2, and Tables S8 in SI). Selenium in
162
“non-pyrite” control points (i.e., silicates and organic matter; total of 12 analyses in the 4
163
pyrite containing samples) was below detection, corroborating that pyrite was the prime
164
carrier of Se and cross-confirming the sequential extraction data (Table 1). Not surprisingly,
165
sample UK-2 (highest bulk Se content) showed the highest mean Se concentration in
166
individual grains (670 ppm). Although Se concentrations varied greatly between the two
167
morphologies or within the same morphological type in a single sample, overall Se
concentrations tended to be higher in euhedral grains (Table 2 and Table S8 in SI). Because
169
of the close link between shale pyrite weathering and Se release,(8,12,22-23,29) hereafter we
170
focussed our Se µ-XAS analyses solely on samples UK-1 and UK-2. These represent typical
171
shales containing pyrite and organic matter (Table S6 in SI) and the highest bulk Se
172
concentrations among the samples studied.
173
Elemental distributions and correlations at the µ-level
174
From the five µ-XRF elemental maps in sample UK-2, two areas of interest (Figure S5 in SI)
175
were selected for higher resolution µ-XRF mapping (Figure 1) and revealed statistically
176
significant correlations between Se, Fe, As, Ni and Cu (Figure S6 and Table S9 in SI) in the
177
pixels on or in close vicinity to pyrite grains.
178
Se oxidation states
179
The µ-XANES spectra of the 14 POI in the highest resolution µ-XRF maps in sample UK-2
180
revealed spectral fingerprints (inflection point of the first derivative, position of the white line
181
peak at the absorption edge) qualitatively similar to the seleno-L-cysteine, Se sulfide,
182
elemental Se and synthetic ferroselite(29) standards (Figure S7 and S8). Two particular areas
183
with framboidal (POIa) and euhedral grains (POIb) were selected for further µ-XANES
184
analyses (Figure 2). The X-ray energy at the inflection point in both POIa and POIb
185
(12658.5 eV) was very close to that in the Se(-II, 0) standards (12658.0 eV). The X-ray
186
energies at the peak of the white line (12660.6 eV for POIa and 12660.2 eV for POIb) were
187
also very similar to the standards (12660.2 eV for seleno-L-cysteine; 12660.2 eV for
188
elemental Se(0); 12659.7 eV for Se(-II) sulfide). On visual inspection, the spectral
189
fingerprints of POIa and POIb were very similar to the Se(-II) sulfide standard, and also
190
showed close similarity to the elemental Se(0) standard. POIa and POIb were however, less
191
similar to seleno-L-cysteine. Comparing with the synthetic ferroselite spectra, (29) the overall
fingerprint was similar. We did not align the Ryser et al. (29) spectrum with our spectra as the
193
details of beamline set up were unavailable, although, to the best of our knowledge, the
194
ferroselite spectrum was collected with a step size of 0.7 eV.(29) Despite the similarities
195
between POIa and POIb and Se(-II) sulfide, Se(-I) ferroselite and elemental Se(0), it was not
196
possible to determine the oxidation state, or the local coordination environment, of Se in our
197
samples as the uncertainty of the data at the XANES region was 0.4 eV and the XANES
198
spectra for the Se(-II) sulfide, Se(-I) ferroselite and elemental Se(0) standards are all visually
199
similar. Based on our comparisons we concluded from the µ-XANES data that the possible
200
Se oxidation states at both POI were Se(-II), Se(-I) or Se(0). Further differentiation in Se
201
speciation was achieved by fitting the µ-EXAFS data.
202
Se chemical environment and bonding characteristics
203
The µ-EXAFS spectra in k-space (Figure 3) indicated a similar local coordination
204
environment of Se for both POI (see also Figure S9 in SI with overlaid POI spectra). The
205
spectra are similar over the entire k-space range, with features at ~ 4.2, 5.7 and 6.5 Å-1
206
apparent in both spectra. However, the Fourier transforms indicate that Se was not present in
207
exactly the same bonding environment in POIa and b. Sample spectra exhibited noisier and
208
more complex oscillations compared to the standards (Figure 3 and in Figure S7 in SI) due
209
to the lower concentration of Se (max 670 ppm in euhedral grains; Table 2). The fingerprints
210
in k-space between both POI and the synthetic ferroselite,(29) showed that both spectra were
211
comparable in phase but with smaller oscillatory amplitudes at low wavenumbers. The
212
sample spectra were clearly out of phase with the seleno-L-cysteine, Se sulfide and elemental
213
Se standards (Figure S7 and S10 in SI).
214
Our fit of the POIa spectrum consisted of four single scattering paths (Table 3 and Figure 3)
215
with bond distances consistent with those of S-S and S-Fe in pyrite (where S-S1=2.18 Å,
S-216
Fe1=2.26 Å, S-S2=3.07 Å, and S-S2=3.32 Å) (30), but invoking a substitution of S by Se (30)
that resulted in a local expansion of 8 % in the first shell (Se-S1) and 4 % in all the others.
218
The sum of the modelled bond distances (11.351 Å) is very close to that of the pyrite
219
structure (10.830 Å), however it is expanded as a result of S substitution with Se, where Se
220
has a larger atomic radii compared to S. POIb data were fitted (Table 3) using five single
221
scattering paths, four corresponding to the theoretical structure of ferroselite(31) (Se-Fe1=2.35
222
Å, Se-Fe2=2.38 Å, Se-Se2=3.40 Å and Se-Se3=3.58 Å) and one single scattering path
(Se-223
S=3.07 Å) corresponding to the pyrite structure.(30) The first two Se-Fe paths contributed
224
entirely to the first peak of the Fourier transform (involving 3 Fe atoms, Table 3) and the
225
remaining two Se-Se paths plus the Se-S path contributed to the second peak (individual path
226
contributions in Figure S11 in SI). The Se-Fe bond distances (average 2.31 Å) are shorter
227
than in the theoretical structure of ferroselite(31) (average 2.37 Å, Se-Fe=2.35Å with one Fe
228
and Se-Fe=2.38Å with 2 Fe) and are also shorter than in the fit to synthetic ferroselite
229
reported by Ryser et al. (29) (Se-Fe average 2.38 Å). We attribute our somewhat short Se-Fe
230
bond distance to the fact that we are fitting a complex natural sample that likely slightly
231
differs in crystal structure to a theoretical model or indeed a synthetic precipitate. In fact,
232
Ryser et al. (29), when fitting Se in their sample, fit to a ferroselite polymorph (dzharkenite)
233
with a first shell attributed to Se-Se at an average bond distance of 2.28 Å but our fit showed
234
no Se-Se bonds in the first shell.
235
We performed Se speciation analysis on POI clearly identified as pyrite and expected the
236
local coordination environment to reflect structural Se substitution for S as previously
237
suggested. (22-23) However, our µ-EXAFS analysis (Table 3 and Figure 3) suggested that the
238
Se coordination environment in pyrite was dependent on the pyrite morphology. In euhedral
239
grains (POIa) Se was substituted for S in the pyrite structure as previously suggested, but in
240
framboidal grains (POIb) the local environment of Se was akin to Se in a discrete
ferroselite-241
like species (FeSex).
Table 1. Concentration of Se (µg/g) in the principal fractions in the shale samples as derived through application of protocol A and B and the
243
Cr(II)Cl2 extraction; in brackets shown are the % Se in each fraction as a fraction of the total bulk Se.
244
Protocol A - Se(µg/g), (%)a Protocol B - Se(µg/g), (%)a Se(µg/g)
Base soluble Residual Sulfides + Organics
Bulk Se µg/g
Tightly bound Se(IV), organic
and inorganic selenides
Sulfides, recalcitrant
organic matter, silicates
% OM+Sulfidesb Sulfides and Organics
Se in Sulfides Cr(II)Cl2
UK1 3.13 2.48 (79) 0.29 (9.9) 88 3.70 (118) 1.57 (50)
UK2 9.77 6.51 (67) 2.80 (29) 96 9.43 (97) 7.22 (74)
UK3 1.29 0.71 (55) 0.25 (19) 74 1.00 (77) 0.59 (46)
UK4 0.83 0.27 (33) 0.49 (59) 92 0.78 (94) 0.17 (20)
UK5 3.87 3.47 (90) 0.17 (4.4) 94 3.63 (94) a Percentage of Se in the extraction in relation to the bulk Se, %= (Fraction *100)/Bulk Se
245
b
Sum of % Se base soluble + residual
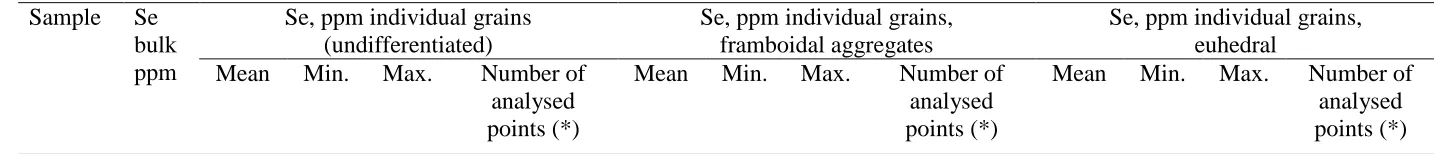
246
Table 2. EMPA analysis of Se (ppm) in individual pyrite grains (with morphological splits) compared to bulk Se concentrations (UK-5
247
contained no pyrite; see also SI Table S3 and S4). Left, middle and right panels include basic statistics for Se concentrations with no
248
differentiation in morphology, vs. framboidal and euhedral pyrites, respectively.
249
Sample Se bulk ppm
Se, ppm individual grains (undifferentiated)
Se, ppm individual grains, framboidal aggregates
Se, ppm individual grains, euhedral
Mean Min. Max. Number of analysed points (*)
Mean Min. Max. Number of analysed points (*)
[image:12.842.58.775.440.517.2]UK-1 3.13 255 100 561 29 (<DL=5) 192 110 300 15 (<DL=5) 661 100 561 14
UK-2 9.77 365 110 670 42 (<DL=8) 309 110 510 27 (<DL=6) 413 190 670 15 (<DL=2)
UK-3 1.29 171 110 310 20 (<DL=12) 171 110 310 20 (<DL=12) - - - 0
UK-4 0.83 164 120 200 26 (<DL= 17) - - - 12 (<DL= 12) 164 120 200 11 (<DL=2)
*DL= Limit of Detection, 90 ppm; points below DL were excluded from the statistical analyses.
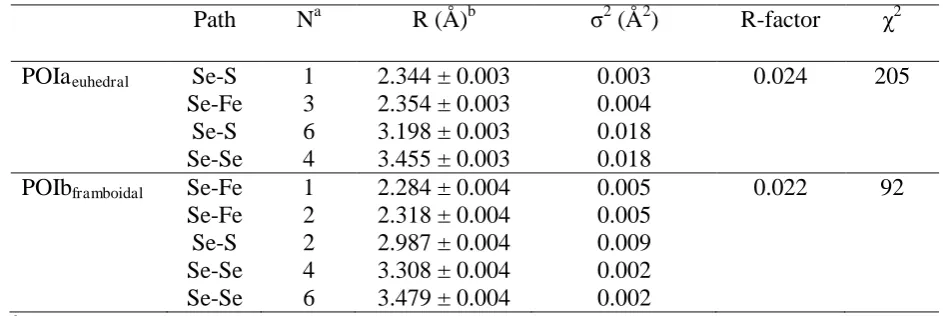
Table 3. Local coordination environment of Se at POIa and b as determined by Se K-edge
251
µ-EXAFS analysis.
252
Path Na R (Å)b 2 (Å2) R-factor 2
POIaeuhedral Se-S 1 2.344 ± 0.003 0.003 0.024 205
Se-Fe 3 2.354 ± 0.003 0.004
Se-S 6 3.198 ± 0.003 0.018
Se-Se 4 3.455 ± 0.003 0.018
POIbframboidal Se-Fe 1 2.284 ± 0.004 0.005 0.022 92
Se-Fe 2 2.318 ± 0.004 0.005
Se-S 2 2.987 ± 0.004 0.009
Se-Se 4 3.308 ± 0.004 0.002
Se-Se 6 3.479 ± 0.004 0.002
a
Degeneracy (coordination number for single paths)
253
b
Inter-atomic distances
255
Figure 1. Ligth microphotographs of the -XRF areas of interest and corresponding µ-XRF
256
elemental maps around POIa (top) and POIb (bottom). The enlarged areas next to them were
257
imaged using the microscope on the beamline set at 45 degrees, hence the slight offset.
258
Similarly, the distortion between these enlarged area images and the X-ray maps is due to the
259
fact that the beamline camera and the incident X-ray beam see the sample at different
incident angles. In the enlarged image and the X-ray maps for POI b the dotted lines are just
261
to guide the eye and show the distortion.
262
263
12650 12660 12670
Se0 Elemental selenium
N
orm
al
iz
ed a
bs
orba
nc
e
Se(-II) Selenium sulfide
Energy (eV)
Seleno-L-cysteine
UK-2 POI a
UK-2 POI b Se(-I) Ferroselite (Ryser et al. 2005)
[image:16.595.94.345.157.540.2]264
Figure 2. Se K-edge -XANES spectra from POI a and b and selected standards. We also 265
included the Se(-I) ferroselite standard from Ryser et al. (29) but note that the spectral position
266
in this spectrum is offset, yet the general shape and amplitude of the spectrum can be
267
compared with our data.
268
(k)*K
3
|
(R
)|
(
Å
-3
)
|
(R
)|
(
Å
-3
)
0 1 2 3 4 5 6
0 1 2 3 4 5 6
3 4 5 6 7 8 9 10 11
POI b
Distance
(
Å)
Distance
(
Å)
Wavenumber
(
Å
-1)
Fit POI a
[image:17.595.78.534.75.343.2]270
Figure 3. Averaged k3-weighted (left plot) experimental data and fits (dashed lines) for POI
271
a (top) and POIb (bottom), real part of the Fourier transform of the spectra (middle) and fits
272
using a k-weight of 3 (right).
273
DISCUSSION
275
Se in shales and in the pyrite fraction
276
The UK samples are typical shale rocks with relatively low bulk Se concentrations (<1 to ~
277
10 µg/g). Sequential extractions, microprobe analyses and µ -XRF data clearly demonstrated
278
that the main Se host in these samples was pyrite, with sequential extraction also suggesting
279
minor Se associated with organic matter. As such our results strengthen previous data (32-34)
280
that reported Se in carbonaceous shales highly associated with pyrite and organic matter. In
281
the highest bulk Se samples (UK-1 and UK-2), 50 and 74% of the Se (Table 1) was
282
associated with pyrite, and µ-XRF maps only showed high Se values on pyrite and low Se
283
values in the organic matter or silicates matrix, corroborating the minor Se-organic matter
284
association. The strong µ-scale correlations between Se, As, Ni and Cu in the pyrite grains
285
also confirm the Se-pyrite link, as these metalloids and metals are most often solely enriched
286
in pyrite and not in organic matter.(32, 35) Of crucial importance, our results also show that
287
variations in total Se concentrations in typical shales do not solely depend on total S and
288
organic C contents, but in addition there is a clear link between Se concentration and pyrite
289
grain morphology (Table 2 and Table S6). Microprobe analyses showed that euhedral pyrites
290
contained overall far higher concentrations of Se compared to framboidal pyrites (Table 2
291
and Table S8 in SI) and that in fact no (< 90 ppm detection limit) Se was associated with any
292
organic matter or silicate grains. There is an apparent mismatch between the proportion of Se
293
associated with non-pyrite fractions in the sequential exactions (Table 1) and the absence of
294
Se in the non-pyrite matrix measured with the microprobe. This is because sequential
295
extractions measure bulk Se which is diffusely distributed in the non-pyrite matrix, while
296
microprobe point analyses will only show high values in localised grains (i.e., pyrite), where
297
Se is highly concentrated. In Matamoros et al.(16) we demonstrated that even if organic C
298
contents (2-5 %) were higher than pyrite contents (1-3 %), Se was still preferentially
associated with pyrite. Thus the data in our current study, combined with literature
300
knowledge about pyrite formation pathways(35-40) helps us understand how Se is sequestered
301
into, and released from, pyrite in shales.
302
Pyrite formation in shales and links to Se speciation
303
The grain-level concentrations and speciation of Se depended on whether pyrite was present
304
in framboidal or euhedral morphology (Table 2, Table 3 and Table S8). This difference can
305
be attributed to variations in chemical environments and formation pathways of the two
306
morphologies, or the effects of diagenesis.(41)
307
In natural settings framboidal pyrite is known to form rapidly at the chemocline where Fe and
308
S sources are readily available.(36-38) Here Se will be present as an oxic species, in either
309
aqueous or sorbed form.(18-20) Framboids are difficult to synthesise in the laboratory(39) and no
310
experimental evidence on Se-framboidal interactions is available. Some experimental studies
311
used iron sulfides (e.g., mackinawite,(42) pyrite(18-20, 43)) and sorbed Se onto them. When
312
synthetic pyrite was used, the Se was co-reduced leading to the formation of ferroselite
313
FeSe(-I)x.(18,42,44) Our current Se-edge µ-XAS data on natural framboids shows an
314
independent ferroselite-like FeSe(-I)x species as the dominant Se form associated with our
315
framboids (Figure 3). Combining the experimental evidence with our µ-XAS data suggests
316
that co-reduction during framboid formation must be the dominant pathway to producing
317
ferroselite in natural framboidal pyrites formation environments.
318
Euhedral pyrite grains form more slowly via the supply of low levels of external, less reactive
319
Fe and Se.(35,45-48) The source for these Fe/Se species is diffusive transport, followed by their
320
reduction and subsequent sequestration into the euhedral crystal structure.(23,49) Our µ–XAS
321
data (Figure 3) clearly shows a Se for S replacement in our euhedral pyrite, supporting the
slow growth by coupled diffusion / reduction, which also leads to higher average Se
323
concentrations in euhedral grains (Table 2).
324
If such euhedral grains formed through framboidal aggregate re-crystallization,(36,46-47) we
325
would expect Se to retain the ferroselite, FeSe(-I)x speciation as in the framboids. However,
326
this is not the case as our euhedral POIa µ-XAS evidences Se replacing S in the pyrite
327
structure (Figure 3 and Table 3).
328
We demonstrated that Se speciation in pyrite in shales is dependent on pyrite morphology but
329
further spatially resolved speciation studies in other shale samples are necessary to evaluate if
330
such a morphology-dependent speciation is universal, or only linked to pyrites formed
331
through similar sedimentary processes. (47-48)
332
The formation and importance of FeSex species in framboidal pyrite.
333
In modern marine sediments the most frequent pyrite morphology is framboidal (50) and we
334
demonstrate Se in this morphology to exists as ferroselite, which is thermodynamically stable
335
over a wide range of pH and low oxygen conditions (Figure S12 left in SI).
336
The formation of ferroselite has been studied experimentally under both abiotic and biotic
337
conditions. Naveau et al. (18) investigated the adsorption of aqueous Se (IV) and Se(-II) onto
338
natural and synthetic pyrites and showed that Se is first reduced in solution and then it
339
adsorbs onto the pyrite surface. This reduction must be counterbalanced by the oxidation of
340
reduced iron species in pyrite. Charlet et al.(43) demonstrated that ferroselite (FeSe2) and Se(0)
341
can form when reacting synthetic nanophase pyrite with Se(IV) and Se(VI) solutions.
342
However, in another study from the same group (19) the reduction of aqueous Se(IV) by pyrite
343
was corroborated, but the formation of ferroselite was excluded, instead elemental selenium
344
was suggested as the Se species at slightly acidic and neutral pH (4.5 - 6.6). The ability of
345
other ferrous minerals (e.g., green rust, mackinawite, siderite or troilite) to reduce aqueous
Se(IV) and Se(VI) to elemental Se and selenides has been inferred to be coupled to the
347
oxidation of S(-II)/Fe(II) to S(0)/Fe(III) in such phases.(20,42-44,53-54) Other evidence suggests
348
microbial metabolic processes may be responsible for the formation of selenides(53-54) and
349
ferroselite in particular. Herbel et al.(53) using XAS analyses of selenite-respiring bacteria
350
showed initially a microbial reduction of selenite to elemental Se and a further reduction to
351
Se(-II) species and the formation of FeSex precipitates.
352
Combining these observations with our results, we suggest that in our shale sample the FeSex
353
species formed coevally with the framboids at the chemocline where microbial processes
354
dominate and through reduction of local aqueous Se. During subsequent diagenesis or
355
weathering FeSex will be highly soluble at low pH and intermediate redox conditions (Figure
356
S12 in SI), thus allowing for easy Se release and subsequent transport or re-adsorption onto
357
other minerals.
358
Implications for Se release
359
Our Se mobility data from the sequential extractions showed Se easily liberated from oxides,
360
clay minerals and carbonates. When reacting our samples with mildly acidic reagents
361
(Protocol A: water, exchangeable, Se(0) and acetic extractions – Figure S3 in SI) 10 % of the
362
total Se was easily released. In a weathering environment characterised by slightly acid to
363
neutral pH’s, this will certainly release Se from shales into local groundwaters. The largest
364
proportion of Se however, was associated with pyrite, which is the largest and most reactive
365
Se host phase in shales. Oxidative pyrite weathering from shales together with dissolution of
366
the more soluble FeSex will therefore control the delivery of Se to aquifers and/or soils.
367
Specifically, such dissolution processes result in the redistribution of iron into Fe
368
oxyhydroxides (e.g., ferrihydrite) or Fe oxyhydroxide sulfates (e.g., schwertmannite) and the
369
production of sulfuric acid leading to acidic(55) soils. The associated Se species (FeSex and Se
370
in the euhedral pyrite structure) will co-oxidise to form elemental Se and with further
oxidation these will convert to more toxic and bioavailable selenite or selenate species(6,8)
372
(Figure S12 right in SI). Selenite species behave analogously to As species(56-58) when
373
interacting with minerals and thus once in the aqueous medium, selenite may re-adsorb onto
374
FeOOH particles at acidic pH conditions, or remain bioavailable as free aqueous species in
375
aquifers and thus be transferred to the human food chain with harmful effects.
376
The rates at which the different pyrite morphologies are oxidised during shale weathering
377
will govern the release rates of Se, because framboidal pyrites (made of microcrysts with a
378
large surface area) are weathered faster than euhedral often larger pyrites crystals. Thus, in
379
shales with high framboidal pyrite contents(50) that are oxidatively weathered, Se release will
380
be maximal where secondary iron minerals that can sequester the released Se are limited
381
and/or where ambient pH is neutral to alkaline.
382
Se as potential proxy for past environmental conditions
383
Framboid size distribution is an often used proxy for redox conditions in marine
384
sediments(50). Recently, the use of Se isotopes was suggested as another powerful
palaeo-385
environmental proxy.(5,12,59) Specifically, Mitchell et al.(12) suggested a link between bulk
386
Se/TOC ratios (mol/mol) and Se isotopic values as a first step towards such a proxy. They
387
also noted that the lack of Se speciation information is hindering the full use of Se isotopes as
388
a palaeo-proxy. We did not analyse the Se isotope compositions in our shales, but our bulk
389
Se/TOC ratios (Table S6 in SI) varied between 2.48 × 10⁻⁶ and 8.74 × 10⁻⁵, which lie within
390
the typical range suggested for shales(12) Our data shows a clear link between Se and pyrite
391
and a clear difference in Se speciation in framboidal and euhedral grains. Such a host-fraction
392
differentiation and a morphology-resolved speciation analyses, albeit difficult and time
393
consuming, could much improve the use of Se as a palaeo-environmental proxy. Therefore,
394
we infer that to demonstrate the power of Se as a potential proxy in both modern and ancient
395
settings, measuring only bulk Se isotopic values of rocks are insufficient. In a first step
towards a better Se palaeo-proxy, we propose that bulk Se isotopic analyses need to be
397
combined with spatially and morphologically resolved Se speciation analyses as described in
398
the current study. A further step – that may currently not yet be feasible technologically -
399
would be a spatially and host-fraction differentiated and also pyrite morphology-resolved Se
400
isotopic fingerprinting, combined with co-resolved Se speciation analyses. Such a combined
401
approach would indeed pave the way to a very powerful Se palaeo-oceanographic proxy.
402
ASSOCIATED CONTENT
403
Supporting Information
404
Sample details; bulk characterisation; Se distribution from sequential extractions and trace
405
elements; euhedral and framboidal pyrite microprobe analyses; correlation plots of µ-XRF
406
areas; details of µ-XANES and µ-EXAFS analyses; thermodynamic modelling. This
407
information is available free of charge via the Internet at http://pubs.acs.org.
408
CORRESPONDING AUTHOR
409
*E-mail: [email protected]; [email protected]; phone: +44 113
410
3435220; fax: +44 113 3435259.
411
ACKNOWLEDGMENTS
412
We acknowledge funding from a Dorothy Hodgkin/EPSRC Scholarship for AMV and from
413
the UK Science and Technology Council (STFC) for beamtime (Grant EC 870 to LGB). The
414
authors wish to thank Fred Mosselmans, Tina Geraki and Loredana Brinza from Diamond
415
Light Source Ltd for their tireless assistance and support during XAS data collection and
416
processing.
417
REFERENCES
418
(1) Schrauzer, G.N. Selenomethionine. A review of its nutritional significance,
419
metabolism and toxicity. J Nutr. 2000,130,1653-1656.
(2) British Nutrition Foundation;
421
http://britishnutrition.org.uk/home.asp?siteld= 43§ionld= s
422
(3) Vinceti, M., Nacci, G., Rocchi, E., Cassinadri, T. , Vivoli,R. Marchesi, C., Bergomi,
423
M. Mortality in a population with long term exposure to inorganic selenium via
424
drinking water. J Clin Epidemiol. 2000, 53,1062-1068.
425
(4) Nuttall, K.L. Review: Evaluating Selenium Poisoning. Ann of Clin Lab Sci. 2006,
426
36(4), 409-420.
427
(5) Zhu, J., Johnson, T.M., Clark, S.K, Zhu, X., Wang, X. Selenium redox cycling during
428
weathering of Se-rich shales: A selenium isotope study. Geochim Cosmochim Ac.
429
2014, 126, 228-249.
430
(6) Winkel, L., Johnson, A., Lenz, M., Grundi, T., Leupin, O.X., Amini, Manouchehr,
431
Charlet, L. Environmental Selenium Research - from Microscopic Processes to Global
432
Understanding. Environ Sci Technol. 2011, 46(2), 571-579.
433
(7) U.S. Department of Human Health and Services. Toxicological profile for selenium,
434
P.H. Service and A.f.T.S.a.D. Registry, Editors. Department Health and Human
435
Services. Public Health Service. Agency for Toxic Substances and Disease Registry.
436
2003.
437
(8) Plant, J.A. Kinniburgh, P.L., Smedley, P.L., Fordyce, F.M. and Klinck, B.A. Arsenic
438
and Selenium In: Holland, H.D. and K.K. Turekian. Treatise on geochemistry. Vol. 9
439
Amsterdam ; London: Elsevier-Pergamon. 2003.
440
(9) Bar Yosef, B. Selenium desorption from Ca-kaolinite. Commun Soil Sci and Plan.
441
1987, 18(7), 771-771.
442
(10) Zawislanski, P.T., Benson, S.M., Terberg, R., Borglin. S.E. Selenium speciation,
443
solubility, and mobility in land-disposed dredged sediments. Environ Sci Technol.
444
2003, 37,2415-2420.
445
(11) Allaway, W. H., Cary, E. E., Ehlig, C.F. The cycling of low levels of selenium in soils,
446
plants and animals, Chapter 17 in "Selenium in Biomedicine", Muth, O. H., Oldfield, J.
447
E. and Weswig, P. H. (Eds.), AVI Publishing, Westport, CT. 1967.
448
(12) Mitchell, K., Mason, P.D.R., Van Capellen, P., Johnson, T.M., Gill, B.C., Owens, J.D.,
449
Diaz, J., Ingall, E.D., Reichart, G.J., Lyons, T.W. Selenium as paleo-oceanographic
450
proxy: A first assessment. Geochim Cosmochim Ac. 2012, 89, 302-317.
451
(13) Fordyce, F.M., Guangdi, Z., Green, K., Xinping, L. Soil, grain and water chemistry in
452
relation to human selenium-responsive diseases in Enshi District, China. Appl
453
Geochem. 2000, 15(1), 117-132.
454
(14) Qin, H., Zhu, J., Su, H. Selenium fractions in organic matter from Se-rich soils and
455
weathered stone coal in selenosis areas of China. Chemosphere. 2012, 86(6), 626-633.
456
(15) Wen, H., Carignan, J., Qiu, Y., Liu, S. Selenium speciation in kerogen from two
457
chinese selenium deposits:environmental implications. Environ Sci Technol. 2006,
458
40(4), 1126-1132.
(16) Matamoros-Veloza, A., Newton, R.J. and Benning, L.G. (2011). What controls
460
selenium release during shale weathering? Appl Geochem. 2011, 26, S222-S226.
461
(17) Kulp, T.R. and Pratt, L.M. Speciation and weathering of selenium in upper cretaceous
462
Chalk and shale from South Dakota and Wyoming, USA. Geochim Cosmochim Ac.
463
2004, 68(18), 3687-3701.
464
(18) Naveau, A., Monteil-Rivera, F., Guillon, E., Dumonceau, J. Interactions of Aqueous
465
Selenium (-II) and (IV) with Metallic Sulfide Surfaces. Environ Sci Technol. 2007,
466
41(15), 5376-5382.
467
(19) Kang, M., Chen, F., Wu, S., Yang, Y., Bruggeman, C., Charlet, L. Effect of pH on
468
Aqueous Se(IV) Reduction by Pyrite. Environ Sci Technol. 2011, 45 (7), 2704-2710.
469
(20) Breynaert, E., Bruggeman, C., Maes, A. XANES-EXAFS Analysis of Se solid-phase
470
reaction products formed upon contacting Se(IV) with FeS2 and FeS. Environ Sci
471
Technol. 2008, 42, 3595-3601.
472
(21) Mitchell, K. Couture, R.M., Johnson, T.M., Mason, P.R.D.. Van Cappellen, P.
473
Selenium sorption and isotope fractionation: Iron(III) oxides versus iron(II) sulfides.
474
Chem Geol. 2013, 342, 21-28.
475
(22) Strawn, D., Doner, H., Zavarin, M., McHugo, S. Microscale investigation into the
476
geochemistry of arsenic, selenium, and iron in soil developed in pyritic shale materials.
477
Geoderma. 2002, 108, 237- 257.
478
(23) Presser, T.S and Swain, W.C. Geochemical evidence for selenium mobilization by the
479
weathering of pyritic shale, San Joaquin Valley, California, USA. Appl Geochem. 1990,
480
5, 703-717.
481
(24) Brumhead D. Geology Explained in the Yorkshire Dales and on the Yorkshire Coast.
482
David and Charles, London. 1979.
483
(25) Fisher, Q.J., Wignall, P.B. Palaeoenvironmental controls on the uranium distribution in
484
an Upper Carboniferous black shale (Gastrioceras listeri Marine Band) and associated
485
strata. Chem Geol. 2001, 175, 605-621.
486
(26) Lussier C., Veiga, V., Baldwin, S. The geochemistry of selenium associated with coal
487
waste in the Elk River Valley, Canada. Environ Geol. 2003, 44, 905-913.
488
(27) Newton, R.J., Bottrell, S.H., Dean, S.P., Hatfield, D., Raiswell, R. An evaluation of the
489
use of the chromous chloride reduction method for isotopic analyses of pyrite in rocks
490
and sediment. Chem Geol. 1995, 125,317-320.
491
(28) Calvo, C., Gillespie, R.J.,Vekris, J.E., Ng, H.N. Title Structure of monoclinic
sulphur-492
selenium Se3S5. Acta Crystallogra B. 1978, B34:911-912.
493
(29) Ryser, A.L., Strawn, D.G., Marcus, M.S., Johnson-Maynard, J.L., Gunter, M.E.,
494
Moller, G. Micro-spectroscopic investigation of selenium-bearing minerals from the
495
Western US Phosphate Resource Area. Geochem T. 2005, 6(1), 1-11.
(30) Brostigen, G. and Kjekshus, A. Redetermined crystal structure of FeS2 (pyrite). Acta
497
Chem Scand. 1969, 23, 2186-2188.
498
(31) Bur'yanova Z. and Komkov, A.I. Ferroselite-a new mineral. Dokl Akad Nauk SSSR.
499
1955, 105,812-813 (Russian); Chemical Abstract. 1955, 50, 9239.
500
(32) Tuttle, M.L.W.,Breit, G.N., Goldhaber, M.B. Weathering of the New Albany Shale,
501
Kentucky: II. Redistribution of minor and trace elements. App Geochem. 2009, 24,
502
1565-1578.
503
(33) Morse, J.W. and Luther, G.W. Chemical influences on trace metal sulfide interactions
504
in anoxic sediments. Geochim Cosmochim Ac. 1999, 63(19-20), 3373-3378.
505
(34) Diehl, S.F., Goldhaber, M.B., Koenig, A.E., Tuttle, M.L.W., and Ruppert, L.F.
506
Concentration of arsenic, selenium, and other trace elements in pyrite in appalachian
507
coals of alabama and kentucky. National Meeting of the American Society of Mining
508
and Reclamation, June 19-23, 2005. Published by ASMR, 3134 Montavesta Rd.,
509
Lexington, KY 40502. 2005.
510
(35) Berner, Z.A., Puchelt, H., Nöltner, T. and Kramar, U.T.Z. Pyrite geo-chemistry in the
511
Toarcian Posidonia Shale of south-west Germany: Evidence for contrasting
trace-512
element patterns of diagenetic and syngenetic pyrites. Sedimentology. 2013, 60, 548–
513
573.
514
(36) Goldhaber, M.B. Sulfur-rich sediments in Treatise on Geochemistry (7) Sediments,
515
diagenesis and Sedimentary rocks. Elsevier Pergamon. 2003.
516
(37) Wilkin, R.T., Barnes, H.L., Brantley, S.L. The size distribution of framboidal pyrite in
517
modern sediments: An indicator of redox conditions. Geochim Cosmochim Ac. 1996,
518
60(20), 3897-3912.
519
(38) Wilkin, R.T, Arthur, M.A., Dean, W.E. History of water-column anoxia in the Black
520
Sea indicated by pyrite framboid size distributions. Earth Planet Sc Lett. 1997, 148 (5),
521
17-525.
522
(39) Wilkin, R.T. and Barnes H.L. Pyrite formation by reactions of iron monosulfides with
523
dissolved inorganic and organic sulfur species. Geochim Cosmochim Ac. 1996, 60(21),
524
4167-4179.
525
(40) Benning, L.G., Wilkin, R.T., Barnes, H.L. Reaction pathways in the FeS system below
526
100°C. Chem Geol, 2000, 167(1-2), 25-51.
527
(41) Love, L.G. Micro-organic material with diagenetic pyrite from the Lower Proterozoic
528
Mount Isa Shale and a Carboniferous shale. Proceeding of the Yorkshire Geological
529
Society. 1965, 35, 187-202.
530
(42) Scheinost, A.C. and Charlet, L. Selenite reduction by mackinawite, magnetite and
531
siderite: XAS characterization of nanosized redox products. Environ Sci Technol.2008,
532
4,1984-1989.
(43) Charlet, L., Kang, M., Bardelli, F., Kirsch, R., Géhin, A., Grenèche, J.M., Chen, F.
534
Nanocomposite Pyrite–Greigite Reactivity toward Se(IV)/Se(VI). Environ Sci Technol.
535
2012, 46 (9), 4869-4876.
536
(44) Howard, J. H. Geochemistry of selenium: formation of ferroselite and selenium
537
behavior in the vicinity of oxidizing sulfide and uranium deposits. Geochim
538
Cosmochim Ac. 1977, 41, 1665 -1678.
539
(45) Raiswell, R. and Plant, J. The incorporation of trace elements into pyrite during
540
diagenesis of black shales, Yorkshire, England. Econ Geol. 1980, 15, 684-699.
541
(46) Wang, Q. and Morse, J. W. Pyrite formation under conditions approximating those in
542
anoxic sediments. I. Pathway and morphology. Mar Chem. 1996, 52, 99-121.
543
(47) Morse, J.W. and Wang, Q. Pyrite formation under conditions approximating those in
544
anoxic sediments. Mar Chem. 1997, 57(3-4), 187-193.
545
(48) Murowchick, J.B. and Barnes, H.L. Effects of temperature and degree of
546
supersaturation on pyrite morphology. Am Mineral. 1987, 72, 1241-1250.
547
(49) Diener, A., Neumann, T., Kramar, U. Schild, D. Structure of selenium incorporated in
548
pyrite and mackinawite as determined by XAFS analyses. J Contam Hydrol. 2012,
549
133, 30-39.
550
(50) Wignall, P.B. and Newton, R. Pyrite framboid diameter as a measure of oxygen
551
deficiency in ancient mudrocks. Am J Sci. 1998, 298, 537-552.
552
(51) Scheinost, A.C, Kirsch, R., Banerjee, D., Fernandez-Martinez, A., Zaenker, H., Funke,
553
H., Charlet, L. X-ray absorption and photoelectron spectroscopy investigation of
554
selenite reduction by Fe-II-bearing minerals. J Contam Hydrol. 2008, 102(3-4),
228-555
245.
556
(52) Bruggeman, C., Maes, A., Vancluysen, J., Vandemussele, P. Selenite reduction in
557
Boom clay: effect of FeS2, clay minerals and dissolved organic matter. Environ Pollut.
558
2005,137, 209-221.
559
(53) Herbel, M.J., Blum J.S., Oremland, R.S, Borglin, S.E. Reduction of elemental selenium
560
to selenide: Experiments with anoxic sediments and bacteria that respire Se-oxyanions.
561
Geomicrobiol J. 2003, 20, 587-602.
562
(54) Bacon, M. and Ingledew, W.J. The reductive reactions of Thiobacillus ferrooxidans on
563
sulphur and selenium. FEMS Microbiol Lett. 1989, 58, 189-194.
564
(55) Lavergren, U. Black shale as a metal contamination source. The ESS Bulletin. 2005,
565
3(1):18-31.
566
(56) Dudas, M.J. Enriched levels of arsenic in post-active sulphate soils in Alberta. Soil Sci
567
Soc Am J. 1984, 48(6), 1451-1452.
568
(57) Nickson, R., McArthur, J., Burgess, W., Ahmed,K. M., Ravenscroft, P., Rahman, M.
569
Mechanism of arsenic release to groundwater, Bangladesh and West Bengal. App
570
Geochem. 2000, 15, 403-413.
(58) British Geological Survey Report WC/00/19. Arsenic contamination of groundwater
572
in Bangladesh. Kinninburgh, D G and Smedley, P L Editors. 2001.
573
(59) Sageman, B.B. and Lyons, T.W. Geochemistry of fine-grained sediments and
574
sedimentary rocks. In: Holland, H.D. and K.K. Turekian. Treatise on geochemistry.
575
Vol. 7 Amsterdam ; London: Elsevier-Pergamon. 2003.