This is a repository copy of Engineering of light confinement in strongly scattering
disordered media.
White Rose Research Online URL for this paper:
http://eprints.whiterose.ac.uk/89269/
Version: Accepted Version
Article:
Riboli, F, Caselli, N, Vignolini, S et al. (9 more authors) (2014) Engineering of light
confinement in strongly scattering disordered media. Nature Materials, 13. 720 - 725. ISSN
1476-1122
https://doi.org/10.1038/nmat3966
[email protected] Reuse
Unless indicated otherwise, fulltext items are protected by copyright with all rights reserved. The copyright exception in section 29 of the Copyright, Designs and Patents Act 1988 allows the making of a single copy solely for the purpose of non-commercial research or private study within the limits of fair dealing. The publisher or other rights-holder may allow further reproduction and re-use of this version - refer to the White Rose Research Online record for this item. Where records identify the publisher as the copyright holder, users can verify any specific terms of use on the publisher’s website.
Takedown
If you consider content in White Rose Research Online to be in breach of UK law, please notify us by
Engineering of light confinement in strongly scattering disordered
media.
Francesco Riboli1,2,a,*, Niccolò Caselli1,2, Silvia Vignolini1,2,b, Francesca Intonti1,2, Kevin
Vynck1,c, Pierre Barthelemy1,d, Annamaria Gerardino3, Laurent Balet4, Lianhe H. Li4,
Andrea Fiore4,e, Massimo Gurioli1,2 and Diederik S. Wiersma1,2.
1 European Laboratory for Non-linear Spectroscopy, Via N. Carrara 1 50019 Sesto Fiorentino (FI), Italy
2 Department of Physics, University of Florence, Via G. Sansone 1, 50019 Sesto Fiorentino (FI), Italy
3 Institute of Photonics and Nanotechnology, CNR, Via C. Romano 42, 00156 Roma, Italy
4Ecole Polytechnique Fédérale de Lausanne, Institute of Photonics and Quantum Electronics,
CH-1015 Lausanne, Switzerland
*email: [email protected]
Present address:
a Department of Physics, University of Trento, via Sommarive 14, 38123 Povo (TN), Italy
b Melville Laboratory for Polymer Synthesis, Department of Chemistry, University of Cambridge,
Lensfield Road, Cambridge CB2 1EW, United Kingdom.
c Laboratoire Photonique, Numérique et Nanosciences (LP2N), UMR 5298, CNRS - IOGS - Université
Bordeaux, Institut d'Optique d'Aquitaine, 33400 Talence, France
dQuantum Transport, Kavli Institute of Nanoscience, TU Delft, Lorentzweg 1,2628 CJ Delft,The
Netherlands
e COBRA Research Institute, Eindhoven University of Technology, 5600 MB Eindhoven, The
Netherlands
Disordered photonic materials can diffuse and localize light through random multiple
scattering, offering opportunities to study mesoscopic phenomena, control
light-matter interaction, and provide new strategies for photonic applications. Light
transport in such media is governed by photonic modes characterized by resonances
with finite spectral width and spatial extent. Considerable steps have been made
recently towards the control over transport using wavefront shaping techniques. The
selective engineering of individual modes, however, has only been addressed
confinement and the mutual interaction of modes in a two-dimensional disordered
photonic structure. The strong light confinement is achieved at the fabrication stage
by an optimization of the structure and an accurate and local tuning of the modes
resonance frequency is achieved via post-fabrication processes. To show the
versatility of our technique, we selectively control the detuning between overlapping
localized modes and observe both frequency crossing and anti-crossing behaviours,
thereby paving the way for the creation of open transmission channels in strongly
scattering media.
The ability to mold the flow of light at the wavelength scale has been largely investigated in
photonic-crystal-based devices, a class of materials in which the propagation of light is driven
by interferences between multiply Bragg scattered waves and whose energy dispersion is
described by a photonic band diagram [1]. Light propagation in such structures is defined by
Bloch modes, which can be engineered by varying the structural parameters of the material
[2-4]. In disordered media, both the direction and phase of the propagating waves are
randomized in a complex manner, making any attempt to control light propagation
particularly challenging. Disordered media are currently investigated in several contexts,
ranging from the study of collective multiple scattering phenomena [5,6] to cavity quantum
electrodynamics and random lasing [7,8], to the possibility to provide efficient solutions in
renewable energy [9], imaging [10], and spectroscopy-based applications [11].Transport in
such systems can be described in terms of photonic modes, or quasi-modes, which exhibit
characteristic spatial profiles and spectra [12,13]. In diffusive systems,these modes are
spatially and spectrally overlappingwhile in the regime of Anderson localization, they
become spatially and spectrally-isolated [14]. Unlike Bloch modes in periodic systems,the
precise formation of photonic modes in a single realization of the disorder is unpredictable.
Control over light transport can be obtained by shaping the incident wave to excite only a
theoretically that isolated modes could be selectively tuned and possibly coupled to each
other by a local fine modification of the dielectric structure [19,20].
In this Article, we demonstrate experimentally the ability to fully control the spectral
properties of an individual photonic mode in a two-dimensional disordered photonic structure
[21], in a wavelength range that is relevant for photonic research driven applications. A
statistical analysis of individual spatially-isolated random photonic modes is performed by
multi-dimensional near-field imaging, leading to a detailed determination of intensity
fluctuations, decay lengths and mode volumes. We then demonstrate that individual modes
can be fine-tuned either by near-field tip perturbation or by local sub-micrometer-scale
oxidation of the semiconductor slab [22]. The resonant frequency of a selected mode is
gradually shifted until it is in perfect spectral superposition with the frequency of other two
modes, located a few micrometers apart and spatially overlapping with the tuned mode. On
spectral resonance, we observe frequency crossing and anti-crossing behaviours,
respectively, the latter indicating mode interaction.This provides the experimental
proof-of-principle that optically isolated regions can be connected [23], offering new possibilities in the
control of light propagation in disordered media.
The samples under consideration are 320nm thick GaAs planar dielectric waveguides,
optically activated by the inclusion of three layers of In-As quantum dots (QDs) at the center
of the slab and patterned with disordered distributions of circular holes with varying
parameters, see the SEM images in Figures 1 (a) and (b). The system is studied by using a
commercial Near Field Scanning Optical Microscope (SNOM), used in illumination/collection
geometry at room temperature. Further experimental details on the sample design,
fabrication and near field imaging are given in the Methods section.
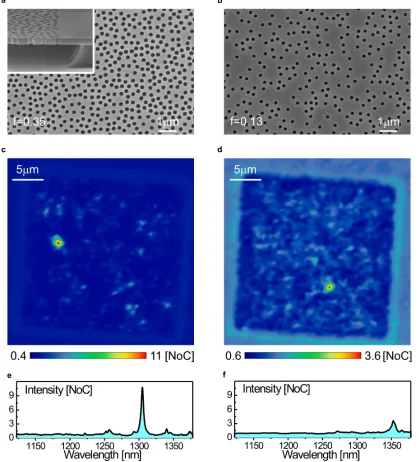
Figures 1 (c) and (d) show typical Photo-Luminescence (PL) near-field intensity maps at
fixed emission wavelength for samples with f=0.35 and f=0.13 respectively (f is the filling
fraction, defined as the ratio between the area occupied by the scatterers and the total area
corresponding to the highest intensity spots in Figures 1 (c) and (d) are shown in Figures 1
(e) and (f), respectively). The main difference between the two spectra normalized to the
average intensity is the peak amplitude value. In fact, the PL spectrum of the sample with
f=0.35 supports a peak 10 times more intense than the average value, while the PL spectrum
of the sample with f=0.13 exhibits a peak with an intensity 3.5 times the average value. While
such intensity distributions and spectra provide useful local information about two single
peaks, a statistical analysis of a large dataset is required to understand the mesoscopic
properties of individual samples, and in particular the influence of the hole filling fraction and
diameter to the properties of the underlying modes.
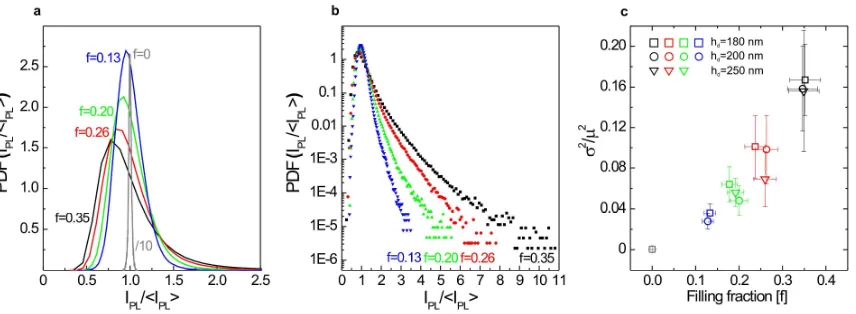
Figures 2 (a) and (b) show the Probability Density Function (PDF) of the near-field PL
intensity normalized to the PL average value (IPL/<IPL>). Each distribution has been evaluated
taking into account all intensity maps within the experimental spectral range
(between =1.15 m and =1.38 m). Increasing the filling fraction leads to more asymmetric
(Fig. 2 (a)) and heavy-tailed (Fig. 2 (b)) PDFs with notably a higher probability to observe
high intensity peaks. For instance, peaks with a normalized intensity of about IPL/<IPL>=4 are
about 100 times more probable in samples with f=0.35 that in those with f=0.2. The onset of
the occurrence of rare yet very bright peaks can be quantified by the normalized
variance 2/2 of the PDF (where 2 and are the variance and the mean intensity of the
distribution, respectively). Figure 2 (c) shows that 2/2 increases by at least a factor of five
by increasing the filling fraction from f=0.13 to f=0.35. The influence of the hole diameter (hd)
on the normalized variance is less evident as shown by the three behaviours
of 2/2 highlighted with squares, circles and triangles that correspond to hd=180nm,
hd=200nm, hd=250nm, respectively. The PL fluctuations of the integrated quantum sources
are primarily driven by the Local Density of States (LDOS) fluctuations [24,25], which in turn
are related to the light transport properties of the system but also to the near-field interaction
between sources and scatterers [26-28]. In our experimental configuration the interplay
of the SNOM tip and the light transport in the disordered medium, does not allow to
quantitatively relate the slopes of the PDF tails with the dimensionless conductance
[24,29,30] and to quantify the contribution of the light transport properties and
source-scatterer near-field interaction to such fluctuations. Nevertheless, the appearance of longer
tails for samples with increasing filling fraction is a signature of the increased confinement of
the photonic quasi-modes. On the other hand, the weak dependence of the fluctuations on
the hole diameter shows that such disordered systems are structurally independent (within
the measurement spectral window), to possible scatterer size-dispersion.
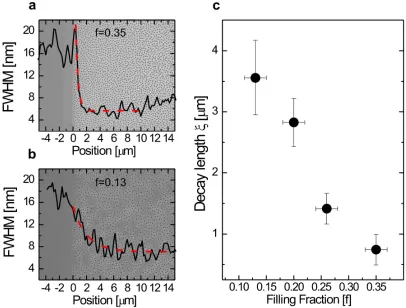
To retrieve information onto the average spatial extension of the photonic modes, we exploit
the fact that their quality factor should decrease in proximity to the sample borders due to
in-plane leakage. Basically, the more confined modes will feel the sample borders at shorter
distances from it. The average mode decay length may then be evaluated by investigating
how the mode spectral width depends on distance to the border [31]. Figures 3 (a) and (b)
show the full width at half maximum (FWHM) of the averaged frequency autocorrelation
function of the near-field spectra, collected in spatial strips parallel to the sample border as a
function of distance to the border. The average FWHM decreases very rapidly for samples
with f=0.35 (hd=200 nm), reaching a constant value at a distance of 3-4 m away from the
border, while for samples with f=0.13 (hd=200 nm) the decay is much slower, reaching a
constant value at a distance of about 10-12 m. Figure 3 (c) shows the decay length, as
calculated from an exponential fit to the FWHM decrease with distance to the border, as a
function of the density of scatterers. The samples with f=0.35 supports modes with decay
length of about =0.8 m with a ratio (L/2)/=15, where L=25 m is the sample size, while for
f=0.13 the decay length is about =3.5 m with a ratio (L/2)/=3.5. The FWHM of frequency
autocorrelations in the middle of the samples is related to the spectral width of localized
modes, that provide their average intrinsic quality factor Q =0/=440+/-80 for f=0.35
larger than the in-plane losses (inherent to the finite size of the sample), as we have verified
by the comparison between 2D and 3D FDTD calculations.
Having identified a proper set of design parameters to create disordered structures that
support strongly confined modes, we proceed to a post-processing step that allows
fine-tuning the resonant wavelength of such modes. The technique we exploit is based on the
local modification of the dielectric environment in the proximity of the maximum intensity of
the modes. From a sample in the regime of the strongest confinement, at f=0.35 and
hd=200nm, we demonstrate the ability to (i) perform a gentle and reversible spectral tuning
on a single localized mode and to (ii) engineer the wavelength splittings of selected pairs of
modes that show a crossing or an anti-crossing feature, depending on the mutual spatial
overlap and therefore on the mode interaction strength [32].
The gentle and reversible engineering is achieved by exploiting the perturbation induced by
the SNOM tip, which modifies the local dielectric environment where multiple light scattering
takes place [31]. For a dielectric uncoated SNOM tip, the induced spectral shift is towards
lower energies and the amplitude given by /=(max0)/is proportional to the modal
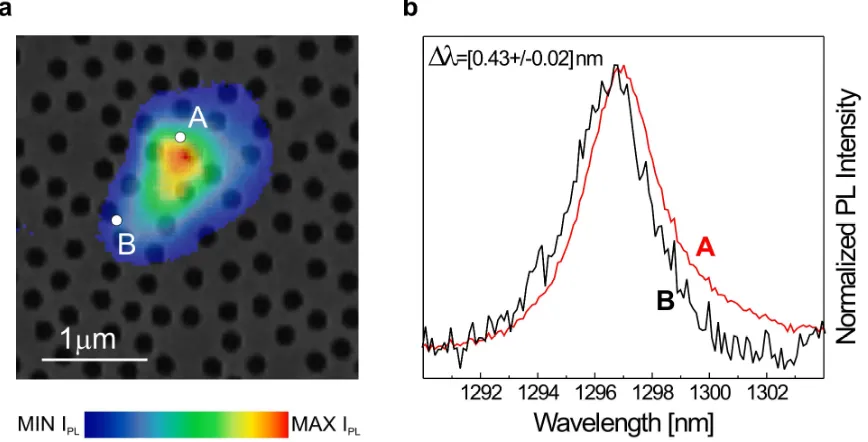
volume Veff of the localized mode and to the SNOM tip polarizability [33,34]. Figure 4 (a)
shows the intensity image of an isolated mode that extends over a region of a few
micrometers, while Figure 4 (b) shows the normalized intensity spectra taken close to the PL
maximum intensity of the mode (point A) and on the PL low intensity tail (point B). The
amplitude of the observed spectral shift is =(0.43+/-0.02) nm, which represents a small
fraction of the mode linewidth (~3 nm), but demonstrates that a dielectric perturbation in
the near-field is able to slightly modify the resonant frequency of a disordered mode. This
spectral shift allows also to give an estimation of the modal volume of the localized mode
Veff~0.2 m3 [35], a value consistent both with the SNOM mode image (Fig. 4 (a)) and with
the statistical estimation of the decay length (Fig. 3 (c)).
In order to control the modes in a broader spectral range, we exploit the post-fabrication
modifies the dielectric environment by reducing the effective GaAs membrane thickness and
by increasing the effective pore diameter [22]. This technique has been successfully used to
gently blue-shift the resonance frequency of photonic-crystal-based cavities and has also
been theoretically proposed as a way to change the nature of the modes in a strongly
disordered system [19]. We carefully choose a set of three modes that are spatially close but
detuned in frequency to demonstrate the ability to engineer the spectral and spatial
properties of the modes.
Figures 5 (a), (b) and (c) show the intensity PL distribution of the three modes (mode A,
mode B and mode C)before starting the laser assisted oxidation process. The PL distribution
of each mode is characterized by a main intensity peak surrounded by speckles with lower
intensities. The spatial regions highlighted by the white (red) dotted lines, identify the spatial
overlap between the A and B (B and C) modes. The laser exposition is made in
correspondence to the maximum intensity of mode B (white circle). Figures 5 (e) and (g)
show the temporal evolution as a function of the laser exposure time of the normalized PL
spectra averaged over the BC and AB overlap regions, respectively. The lower PL intensity
in BC with respect to AB (demonstrated by the larger signal to noise ratio in the normalized
spectra) reflects the smaller spatial overlap between the modes. Figure 5 (f) shows the
evolution of the resonant wavelengths of modes A, B and C as a function of the laser
exposure time t. Let us first consider the time evolution of the mode B respect to the mode
C.The wavelength of mode B (B) blue-shifts monotonically while that of mode C (C) stays
at the unperturbed value within the experimental uncertainty. After 310 minutes of exposure,
the spectral overlap between the two modes is maximized. By further oxidizing the dielectric
membrane, the two resonances spectrally cross until they go out of resonance at t=465
minutes. The spatial overlap between modes B and C is quite small, thus determining a
coupling strength much smaller than the broadening of the individual modes [19]. The two
modes are likely to be in the weak coupling regime, explaining why a frequency anti-crossing
with a larger spatial overlap, which means a shorter spatial separation. This is exactly the
case of mode A and mode B, which have a larger spatial overlap respect to the previous
case (BC). The time evolution of the A and B wavelengths reported in Figure 5 (f) shows that
the local oxidation induces mode anti-crossing. Indeed, the splitting between the mode
resonant wavelengths as a function of the exposure time (AB=A-B) initially decreases,
reaching the minimum around t=170 min and then increasing again (see panel (d)).The
amplitudes of the two interacting modes in the overlap region reach the same value at the
time of minimum splitting (see the evolution of the PL spectra in panel (g)). The black solid
line in panel (d) is the result of the fit of the experimental splitting with the expected strong
coupling behaviour [36]. The minimum experimental splitting 0
AB, gives the interaction
strength g by 0
AB=2g=(3.55+/-0.25) nm. To satisfy the strong coupling condition, 0AB has to
be compared with the FWHM of the modes that is =(3.00+/-0.08) nm; we find that 0
AB ≥
that means that the two modes are just at the onset of strong coupling. Our observation of
both frequency crossing and anti-crossing behaviours represents the first step towards the
creation of chains of hybridized localized random modes, better known as necklace states,
observed in 1D-systems [37] and predicted for higher dimensions [23].
In conclusion, we have shown that it is possible to obtain and engineer strongly confined
modes in two-dimensional disordered structures in the near-infrared wavelength regime.
More strikingly, we have demonstrated the possibility to largely engineer the spectrum and
the interaction of random modes by a fine-tuning of the disordered system in post-fabrication
processes. Our results open new routes for addressing mesoscopic transport phenomena in
random media. As an example, the control of the optical confinement and of the coupling
between modes could be used to exploit 2D necklace states for designing transmission
channels. In addition, random photonic materials have been proposed as an alternative
platform to develop both classical and quantum photonic devices, and, in this framework, our
achievements constitute an important step towards the control of disorder-based photonic
Acknowledgements
We gratefully acknowledge M. Burresi, for discussions and for critically reading the
manuscript, F. Pratesi and G. M. Conley for discussions. This work is financially supported
by the Eu NoE Nanophotonics for Energy Efficiency, the ERC through the Advanced Grant
PhotBots and ENI S.p.A.
Author contributions
FR designed and engineered the samples. MG conceived the post fabrication tuning of
random modes. NC, FI, FR and SV performed the experiments. FR and NC performed the
data analysis with help from MG, KV, FI, PB and DSW. AG, LL, LB and AF fabricated the
samples. FR and MG wrote the paper with support from KV, FI, NC and with appraisals and
inputs from DSW. FR, KV, PB, DSW and MG contributed to the theoretical analysis. All
authors contributed to the general discussion.
References
[1] Joannopoulos, J. D., Johnson, S. G., Winn, J. N. & Meade, R. D. Molding the Flow of
Light 2nd edn. (Princeton University Press 2008).
[2] Akahane, Y., Asano, T., Song, B. S. & Noda, S. High-Q photonic nanocavity in a
two-dimensional photonic crystal. Nature 425, 944-947, (2003).
[3] Yanik, M. F. & Fan, S., Stopping light all optically. Phys. Rev. Lett. 92, 083901, (2004).
[4] Tran, N. V., Combrié, S. & De Rossi, A. Directive emission from high-Q photonic crystal
cavities through band folding. Phys. Rev. B. 79, 041101(R), (2009).
[5] Strudley, T., Zehender, T., Blejean, C., Bakkers, E. P. A. M. & Muskens, O. Mesoscopic
light transport by very strong collective multiple scattering in nanowire mats. Nature Photon.
7, 413 (2013).
[7] Sapienza, L. et al. Cavity quantum electrodynamics with Anderson-localized modes.
Science 327, 1352-1355 (2010).
[8] Noh, H. et al. Control of lasing in biomimetic structures with short range order. Phys. Rev
Lett.. 106, 183901 (2011).
[9] Vynck, K., Burresi, M., Riboli, F. & Wiersma, D. S. Photon management in
two-dimensional disordered media. Nature Mater. 11, 1017-1022 (2012).
[10] Bertolotti, J. et al. Non-invasive imaging through opaque scattering layers. Nature 491,
232-234 (2012).
[11] Redding, B., Liew, S., F., Sarma, R. and Cao, H. Compact spectrometer based on a
disordered photonic chip. Nature Photon. 7, 746 (2013).
[12] Sheng, P. Introduction to Wave Scattering, Localization and Mesoscopic Phenomena 2nd
edn. (Springer 2010).
[13] Ching, E. S. C. et al. Quasinormal-mode expansion for waves in open systems. Rev.
Mod. Phys. 70, 1545-1554 (1998).
[14] A. Z. Genack and S. Zhang, “Wave interference and modes in random media”, Chapter
9 in Tutorials in Complex Photonic Media, eds. M. A. Noginov et al. (SPIE Publications,
2009).
[15] Popov, S., M. et al. Measuring the Transmission Matrix in Optics: An Approach to the
Study and Control of Light Propagation in Disordered Media. Phys. Rev. Lett. 104, 100601
(2010).
[16] Mosk, A., Lagendijk, A., Lerosey, G. & Fink, M. Controlling waves in space and time for
imaging and focusing in complex media. Nature Photon. 6, 283 (2012).
[17] Leonetti, M., Conti, C. & Lopez, C. Switching and amplification in disordered lasing
resonators. Nature Commun. 4, 1740 (2013).
[18] Bachelard, B., Andreasen, J., Gigan, S. & Sebbah, P. Taming random lasers
through active spatial control of the pump. Phys. Rev. Lett. 109, 033903 (2012).
[20] Vanneste, C. & Sebbah, P. Complexity of two-dimensional quasimodes at the transition
from weak scattering to Anderson localization. Phys. Rev. A. 79, 041802(R) (2009).
[21] Riboli, F. et al. Anderson localization of near-visible light in two dimensions. Opt. Lett.
36, 127-129 (2011).
[22] Intonti, F. et al. Mode tuning of photonic crystal nanocavities by photoinduced
non-thermal oxidation. Appl. Phys. Lett. 100, 033116 (2012).
[23] Pendry, J. B. Quasi-extended electron states in strongly disordered systems. J. Phys. C
20, 733 (1987).
[24] Mirlin, A. D., Statistic of energy levels and eigenfunctions in disordered systems. Phys.
Rep. 326, 259 (2000).
[25] van Tiggelen, B., A. & Skipetrov, S., E. Fluctuations of local density of states and C0
speckle correlations are equal. Phys. Rev. E 73, 045601(R), (2006).
[26]Cazé, A., Pierrat, R. & Carminati, R. Near-field interactions and nonuniversality in
speckle patterns produced by a point source in a disordered medium, Phys. Rev. A 82,
043823 (2010).
[27] Sapienza, R. et al. Long-tail statistics of the Purcell factor in disordered media by near
field interaction. Phys. Rev. Lett. 106, 163902 (2011).
[28] Birowosuto, M. D., Skipetrov, S. E. Vos, W. L. & Mosk, A. P. Observation of spatial
fluctuations of the local density of states in random photonic media. Phys. Rev. Lett. 105,
013904 (2010).
[29] Garcia, P. D., Stobbe, S., Sollner, I. & Lodahl, P. Nonuniversality intensity correlations in
a two-dimensional Anderson-localizing random medium. Phys. Rev. Lett. 109, 253902
(2012).
[30] Nieuwenhuizen, Th. M. & van Rossum, M. C. W. Intensity distributions of waves
transmitted through a multiple scattering medium. Phys. Rev. Lett. 74, 2674–2677 (1995).
[31] Laurent, D., Legrand, O., Sebbah, P.,Vanneste, C. & Mortessagne, F. Localized modes
[33] Koenderink, A., F., Kafesaki, M., Buchker, B., C. & Sandoghdar, V. Controlling the
resonance of a photonic crystal microcavity by near-field probe. Phys. Rev. Lett. 95, 153904
(2005).
[34] Intonti, F. et al. Spectral tuning and near-field imaging of photonic crystal microcavities.
Phys. Rev. B, 78, 041401(R), (2008).
[35] Spasenovic, M., Beggs, D., M., Lalanne, P., Krauss, T., F. & Kuipers, L. Measuring the
spatial extent of individual localized photonic states. Phys. Rev. B, 86, 155153 (2012).
[36] Intonti, F. et al. Nanofluidic control of coupled photonic crystal resonator. Appl. Phys.
Lett. 96, 141114, (2010).
[37] Bertolotti, J., Gottardo, S., Wiersma, D. S., Ghulinyan, M., Pavesi, L. Optical necklace
FIGURE 1:Near field imaging of localized modes. a-b, Scanning Electron Microscopy
(SEM) images of disordered samples with f=0.35 and f=0.13 and hole diameters hd=215 nm
and hd=185 nm, respectively. The inset of panel (a) shows the suspended photonic
membrane clamped at its edges. c-d, Near field photo-luminescence images for samples
with f=0.35 and f=0.13, at the wavelength of the main peak of the near-field spectra reported
in (e) and (f) respectively. The near-field spectra have been picked up in correspondence of
the most intense spatially-localized peak and normalized to the average photoluminescence
wavelength spectra range from the minimum to the maximum of the Normalized number of
[image:15.595.78.506.128.285.2]counts [NoC].
FIGURE 2:Statistical distributions of the PL intensity. a-b, Probability Density Function
of the near-field intensities for different values of the filling fraction (f=0, f=0.13, f=0.2, f=0.26,
f=0.35) and hd=200 nm. Each curve has been evaluated taking into account 512 near-field
intensities maps within the wavelength range 1.15 m - 1.37 m. Each map is composed by
104 pixels. The PL intensities (I
PL) are normalized to the PL average value of the
photoluminescence of the respective sample (=<IPL>). The linear scale (a), shows also the
distribution for f=0 (divided by a factor of 10), i.e. the slab without any holes, exhibiting the
minor fluctuations due to the In-Ga-As quantum dots themselves. c, Variance (2) of PDFs
for different scatterers diameter, normalized to the average value . The error bar of 2/2
has been evaluated by calculating this quantity for different ranges of wavelengths, while for
the filling fractions the uncertainty comes from the dispersion of the hole diameters evaluated
FIGURE 3:Decay lengths of localized modes. a-b, Average spectral width of near-field
frequency peaks as a function of the penetration depth inside the sample (black line). The
border of the samples is located at position x=0 m. The red dotted line is an exponential fit
to the data. The FWHM of the average autocorrelation function was calculated within a
vertical strip parallel to the border of the sample. The size of the strip was 200 nm in the
x-direction and 9 m in the y-x-direction and contains 45 near-field spectra. c, Average decay
lengths of photonic modes versus filling fraction, evaluated by fitting the decay of the average
spectral width with an exponential function (red dotted line in (a) and (b)). The errors are
evaluated by performing the above analysis along the four edges of each sample. The slight
increase of the FWHM in the bulk of the sample with f=0.35 is likely to be due to small
increase in the hole diameter caused by a proximity effect of the electron beam during the
writing stage. This effect is present at the center of the sample with high hole density and
FIGURE 4:Reversiblespectral tuning of localized modes. a, Maps of the PL intensity of
the modes obtained by a Lorentzian fit of the local spectra. The color bar ranges from the
maximum intensity to the minimum PL intensity. The spatial extension of the mode is
consistent with the estimated decay length shown in Figure 3 (c). b, Normalized near-field
spectra of the mode shown in panel (a), evaluated close to the maximum PL intensity (point
A) and on a point showing low PL signal (point B). The mode shift is caused by the presence
of the SNOM tip in the near-field of the mode, that induces a dielectric perturbation to the
near field electric distribution of the mode. The observed maximum shift is 0.43 nm. The
FIGURE 5:Local engineering of localized modes. a-c, Intensities of modes A, B and C
before starting the laser assisted local oxidation (t=0 min). The color bar of the images
ranges from MIN=0 to MAX=1 for mode B and mode C, and from MIN=0 to MAX=0.6 for
mode A. The white circle indicates the position of the SNOM tip during the photo-induced
oxidation of the GaAs membrane. The regions lying within the white (red) dotted lines identify
the spatial overlap between the modes A and B (B and C). Panel (e) and (g) show the
evolution of the normalized PL spectra mediated within the overlap regions (BC and AB,
respectively), as a function of the laser exposure time. The average intensity of the modes
within these regions is typically 10-15 times smaller than the average PL intensity of the
maxima of each mode. Panel (f) shows the evolution of the resonant wavelength of the three
modes evaluated in the overlap regions as a function of the exposure time t. The
separation between the resonant wavelengths of modes A and B (AB=A-B) reaches a
minimum value of 0
resonant wavelength of mode B crosses that of mode C at about t=310 min. The black solid
line in panel (d) shows the fit of the experimental splitting with the expected trend for strong
coupling.
Methods
Two-dimensional disordered photonic samples: structural parameters and growth
process.
The disordered photonic system is realized on a GaAs planar dielectric waveguide 320
nm-thick suspended in air and clamped at its edges (Figure 1(a) and (b)), resulting in a square
pad with lateral size L=25 m. The planar waveguide is optically activated by the inclusion of
three layers of high-density InAs quantum-dots (QDs), grown by molecular beam epitaxy.
The QDs are buried in the middle plane of the slab, homogeneously distributed all over the
sample and emit in a broad range of wavelengths, from 1.15 m to 1.38 m. The
homogeneous and high density QDs distribution (about 103/m2) guarantees that the bright
spots in the intensity maps are in correspondence to underlying localized modes generated
by multiple light scattering and are not caused by the fluctuation of the QD density.
Electron-beam lithography, Reactive Ion Etching (RIE) and wet etching allowed to pattern the
waveguide with a random distribution of circular holes. We realized samples with hole
density ranging from f=0.13 to f=0.35 and hole diameter (hd) ranging from hd=180 nm to hd=
250 nm. Deviations of the structural parameters from the nominal ones have been measured
with a Scanning Electron Microscope and are within 5% for hole diameters and 10% for the
filling fraction. In order to avoid merging between adjacent holes during the growth process
(proximity effects), we imposed a minimum distance (1.3 hole diameter) between centers of
Experimental setup: multidimensional near field imaging.
The experimental apparatus is a commercial SNOM (Twinsnom, Omicron). The SNOM is
used in an illumination/collection geometry: QDs are excited through the SNOM tip with a
780 nm diode laser, and the PL signal is collected again through the same tip. The PL signal
is dispersed in a spectrometer and detected by an InGaAs array. This allows to record
point-by-point (with a combined spatial and spectral resolution of 200 nm and 0.5 nm, respectively)
the local PL emission spectrum of the QDs. Spatial and spectral resolution can be improved
up to 50 nm and 0.11 nm respectively, when necessary. These measurements provide
therefore at the same time the spectral information, spatial distributions of the optical modes
and structural information of the sample via the mechanical feedback signal of the SNOM.
The large amount of data we are able to gather within a single experimental scan (more that
2·105 wavelength spectra, each one composed by 512 pixels), allows us to study the
statistical properties of the near field intensity of photonic modes.
A crucial aspect in illumination/collection SNOM based setups is the fact that the PL intensity
collected by the near-field tip results directly from (i) the excitation efficiency of the QDs,
which is driven by the local density of optical states (LDOS) at the excitation wavelength
(=780nm), (ii) QDs light emission efficiency, driven by the LDOS at the emission wavelength
(ranging from =1150nm to =1380nm) and (iii) the collection efficiency of the near field
probe. We thus expect the near field PL intensity measurements to indicate the location and
extent of the photonic modes of the system, albeit not their exact intensity distribution.
To obtain intensity maps that reproduce in more detail the spatial profile of the modes, we
used the well established tip induced perturbation technique [31,33-35]. The amount of the
spectral shift is directly proportional to the intensity of the local electric field and to the
polarizability of the dielectric probe (SNOM tip), and inversely proportional to the modal
volume Veff of the localized mode. The polarizability of our tip, and therefore the
measurement calibration of the modal volume from the spectral shift, has been determined
reconstruct high fidelity intensity maps of localized modes and to give a careful estimation of
the modal volume, Veff~0.2m3, a value consistent with themeasured decay length
(~0.8m). The spatial distributions of mode A, mode B and mode C correspond to the
amplitude of a Lorentzian fit of the mode PL spectra, as usually done for exploiting the tip