This is a repository copy of Kinetics of CH OO reactions with SO , NO , NO, H O and ₂ ₂ ₂ ₂ CH CHO as a function of pressure₃ .
White Rose Research Online URL for this paper: http://eprints.whiterose.ac.uk/121551/
Version: Accepted Version
Article:
Stone, D orcid.org/0000-0001-6710-4021, Blitz, M, Daubney, L et al. (2 more authors) (2014) Kinetics of CH OO reactions with SO , NO , NO, H O and CH CHO as a function ₂ ₂ ₂ ₂ ₃ of pressure. Physical Chemistry Chemical Physics, 16 (3). pp. 1139-1149. ISSN
1463-9076
https://doi.org/10.1039/C3CP54391A
© the Owner Societies 2014. This is an author produced version of a paper published in Physical Chemistry Chemical Physics. Uploaded in accordance with the publisher's self-archiving policy.
[email protected] https://eprints.whiterose.ac.uk/ Reuse
Items deposited in White Rose Research Online are protected by copyright, with all rights reserved unless indicated otherwise. They may be downloaded and/or printed for private study, or other acts as permitted by national copyright laws. The publisher or other rights holders may allow further reproduction and re-use of the full text version. This is indicated by the licence information on the White Rose Research Online record for the item.
Takedown
If you consider content in White Rose Research Online to be in breach of UK law, please notify us by
Kinetics of CH
2OO reactions with SO
2, NO
2, NO, H
2O and CH
3CHO as a function of
1pressure
2
Daniel Stone,aMark Blitz,a,b*Laura Daubney,aNeil Howes,aPaul Seakinsa,b
3
a
School of Chemistry, University of Leeds, Leeds, UK 4
b
National Centre for Atmospheric Science, University of Leeds, Leeds, UK 5
Email:[email protected] 6
7
Abstract
8
Kinetics of CH2OO Criegee intermediate reactions with SO2, NO2, NO, H2O and CH3CHO and CH2I 9
radical reactions with NO2 are reported as a function of pressure at 295 K. Measurements were 10
made under pseudo-first-order conditions using flash photolysis of CH2I2/O2/N2 gas mixtures in the 11
presence of excess co-reagent combined with monitoring of HCHO reaction products by
laser-12
induced fluorescence (LIF) spectroscopy and, for the reaction with SO2, direct detection of CH2OO 13
by photoionisation mass spectrometry (PIMS). Rate coefficients for CH2OO + SO2 and CH2OO + 14
NO2are independent of pressure in the ranges studied and are (3.42 ± 0.42) × 10-11 cm3s-1(measured 15
between 1.5 and 450 Torr) and (1.5 ± 0.5) × 10-12 cm3 s-1 (measured between 25 and 300 Torr),
16
respectively. The rate coefficient for CH2OO + CH3CHO is pressure dependent, with the yield of 17
HCHO decreasing with increasing pressure. Upper limits of 2 × 10-13cm3s-1 and 9 × 10-17cm3 s-1are
18
placed on the rate coefficients for CH2OO + NO and CH2OO + H2O, respectively. The upper limit 19
for the rate coefficient for CH2OO + H2O is significantly lower than has been reported previously, 20
with consequences for modelling of atmospheric impacts of CH2OO chemistry. 21
22
1. Introduction
23
Criegee intermediates, carbonyl oxide biradicals with the general formula CR2OO, are principally produced
24
in the atmosphere following ozonolysis of unsaturated volatile organic compounds (VOCs) and are key 25
species in the tropospheric oxidation of both biogenic and anthropogenic compounds.1, 2 The exothermicity 26
of ozonolysis reactions leads to production of vibrationally excited Criegee intermediates with sufficient 27
energy to undergo unimolecular decomposition to products including OH and HO2,3-6 representing a
28
significant source of these important oxidising species in certain important environments.7-9 However, 29
collisional quenching of the nascent excited Criegee intermediate by N2or O2, to produce stabilised Criegee
30
reactions of stabilised Criegee intermediates have the potential to impact atmospheric budgets of NOx(NOx
32
= NO + NO2), NO3, O3, HOx (HOx = OH + HO2), SO2, H2SO4, sulfate aerosol and secondary organic
33
aerosol (SOA).5, 10-17 34
Despite their potential importance in atmospheric chemistry, and thus in the assessment and prediction of 35
issues such as air quality and climate change, direct observations of Criegee intermediates have only 36
recently been achieved.10-12, 18-20 Kinetics and product yields of Criegee intermediate reactions currently 37
used in atmospheric models are subject to large uncertainties, owing to the reliance of previous 38
investigations on indirect techniques involving measurements of stable species in complex ozonolysis 39
experiments, in which there are several potential sources and sinks of the measured species.1, 2 Welzet al.10 40
reported the first direct measurements of Criegee intermediate kinetics, where the photolysis of CH2I2in the
41
presence of O2 was used to generate the CH2OO Criegee intermediate at low pressure (4 Torr) and, using
42
synchrotron photoionisation mass spectrometry (PIMS) at the Advanced Light Source (ALS), demonstrated 43
unequivocally that the Criegee intermediate, CH2OO, was being monitored:
44
CH2I2 + h CH2I + O2 (R1)
45
CH2I + O2 CH2OO + I (R2a)
46
While reactions of CH2OO with NO and water vapour were reported to be slow, the reactions of CH2OO
47
with SO2 and NO2 were shown to be significantly faster than indicated by the indirect methods. Rate
48
coefficients for both CH2OO + SO2 and CH2OO + NO2, measured at a pressure of 4 Torr and temperature
49
of 298 K, were both approximately 1000 times greater than previously assigned, implying a more 50
significant role of Criegee intermediate chemistry in the atmosphere than expected. 51
The ability to produce CH2OO following photolysis of CH2I2 in the presence of O210 has also facilitated
52
spectroscopic investigations of CH2OO in the infrared19and ultraviolet,20and has been used to demonstrate
53
the production of NO3in the reaction of CH2OO with NO2.21 Subsequent work at the ALS has investigated
54
the reactions of CH2OO with acetone, acetaldehyde and hexafluoroacetone at low pressures,11 with
55
theoretical investigation22of the reaction between CH2OO and acetaldehyde (CH3CHO) indicating pressure
56
dependence of the reaction and collisional stabilisation of nascent reaction adducts to produce secondary 57
ozonides (SOZs) at higher pressures which subsequently decompose to generate organic acids. 58
Taatjes et al.12 have also recently demonstrated production of the CH3CHOO Criegee intermediate
59
following photolysis of CH3CHI2 in the presence of O2. The structure of the CH3CHOO Criegee
60
intermediate gives rise to the possibility of syn- and anti- conformers, with the conformers sufficiently 61
different in energy, and with a barrier to conversion, leading to the potential for their behaviour as distinct 62
species. Using the synchrotron PIMS technique, Taatjeset al.12were not only able to identify both the syn-63
andanti-CH3CHOO conformers, but were also able to assign separate rate coefficients for reactions of the
towards both SO2and H2O compared to thesyn-conformer, with rate coefficients for reactions of both
syn-66
andanti- conformers with SO2greater than previously expected.12
67
Field observations in a boreal forest in Finland have provided further evidence for rapid reactions between 68
Criegee intermediates and SO2, with measurements identifying the presence of oxidising species other than
69
OH which are able to oxidise SO2to SO3and ultimately to produce H2SO4.23 The presence of the unknown
70
oxidising species was shown to be related to emissions of biogenic alkenes, and it was postulated that 71
Criegee intermediates may be responsible, with laboratory measurements of H2SO4 production during
72
alkene ozonolysis reactions in the presence of SO2 and OH scavengers providing further support for the
73
action of Criegee intermediates as atmospheric oxidants of SO2.23
74
Implementation of increased Criegee intermediate + SO2 reaction rates in atmospheric models has been
75
shown to improve model simulations of H2SO4 in forested regions in Finland and Germany,14 and global
76
modelling has shown that while global production of H2SO4increases by only 4 %, there are increases of up
77
to 100 % in the boundary layer in tropical forests.15 Further modelling work has shown that reactions of 78
Criegee intermediates with SO2 can compete with OH + SO2 in a number of regions, and that Criegee +
79
SO2reactions may be the dominant removal mechanism for SO2in certain areas and are major contributors
80
to sulfate aerosol formation on a regional scale.17 Air quality modelling over the U.S. displayed limited 81
impacts of increased Criegee + SO2 reaction rates on sulfate aerosol production in this region, but the
82
impacts were shown to be highly dependent on the competition between Criegee + SO2and Criegee + H2O,
83
with a combination of increased Criegee + SO2 and decreased Criegee + H2O reaction rates leading to
84
enhanced sulfate aerosol concentrations.16 However, such studies have largely been based on the low 85
pressure data for CH2OO + SO2 reported by Welz et al.10 and there is considerable uncertainty regarding
86
the upper limit for CH2OO + H2O.2, 17
87
Theoretical work has provided support for rapid reactions between Criegee intermediates and SO2,13, 24with
88
reactions proceeding via the initial barrierless formation of a cyclic secondary ozonide, and has enabled 89
prediction of potential effects of pressure.13 For CH2OO + SO2, it has been predicted that the reaction
90
products at atmospheric pressure will be a mixture of HCHO + SO3 (~68 %), formyl sulfinic ester
91
(HC(O)OS(O)OH) (~15 %) and a singlet bisoxy diradical (CH2(O)O) + SO2 (~17 %).13 In contrast,
92
reactions of larger Criegee intermediates, including CH3CHOO, at ambient pressures are expected to result
93
in production of stabilised secondary ozonide species, with little formation of SO3, and therefore little
94
impact on H2SO4 and sulfate aerosol.13 Investigation of the reaction products and pressure dependence of
95
Criegee intermediate reactions is thus essential to the accurate determination of their atmospheric impacts. 96
The yield of CH2OO Criegee intermediates following CH2I2photolysis in O2was studied by Huanget al.25,
97
and in our previous work,26 as a function of pressure. Both investigations indicate that the initial reaction 98
between CH2I radicals and O2(R2) produce a chemically activated species, CH2IO2#, which decomposes at
low pressures to produce CH2OO + I (R2a), but is also collisionally stabilised at higher pressures to
100
produce the CH2IO2peroxy radical (R2b).
101
CH2I2 + h CH2I + I (R1)
102
CH2I + O2 CH2IO2# (R2)
103
CH2IO2# CH2OO + I (R2a)
104
CH2IO2# + M CH2IO2+ M (R2b)
105
Our previous work26 indicates a yield of ~18 % CH2OO following photolysis of CH2I2 in air at 760 Torr,
106
with recent results from Huang et al.27 in reasonable agreement. This result has potential significance for 107
modelling of atmospheric chemistry in iodine-rich regions,28-31 and also indicates potential for pressure 108
dependent studies of CH2OO kinetics using photolysis of CH2I2in O2.
109
In this work, we report kinetics of CH2OO reactions with SO2, NO2, NO, H2O and CH3CHO at pressures
110
between 25 and 450 Torr at a temperature of 295 K, using photolysis of CH2I2/O2/N2 mixtures under
111
pseudo-first-order conditions combined with monitoring of the HCHO reaction products by laser-induced 112
fluorescence (LIF) spectroscopy, and, for the CH2OO + SO2 reaction at ~1.5 Torr, direct monitoring of
113
CH2OO by photoionisation mass spectrometry (PIMS). We also report kinetics of the CH2I + NO2reaction
114
at pressures between 25 and 300 Torr at 295 K. 115
116
2. Experimental
117
2.1 Laser-Induced Fluorescence Experiments
118
Apparatus and experimental procedures for the laser-induced fluorescence (LIF) experiments have been 119
described elsewhere in detail,26, 32 therefore only a brief description is given here. Kinetics of CH2OO
120
reactions were studied by monitoring of HCHO reaction products by LIF spectroscopy. Radicals were 121
generated by the laser flash photolysis of CH2I2/O2/N2gas mixtures (R1-R2) with the addition of excess
co-122
reagent (NO2, NO, SO2, H2O or CH3CHO) to ensure pseudo-first-order conditions. Experiments to
123
investigate CH2I + NO2 kinetics were performed in the absence of O2, while those to investigate CH2OO +
124
NO2 were performed using a limited range of NO2 concentrations in order to avoid production of HCHO
125
through the reaction of CH2I with NO2(see Section 3.1), whilst maintaining pseudo-first-order conditions.
126
CH2I2(Sigma-Aldrich, 99 %) was used as a dilute gas in N2either by filling a glass bulb containing liquid
127
CH2I2with N2or by bubbling a slow flow of N2through liquid CH2I2. Reagents (NO, NO2, SO2, CH3CHO)
128
were prepared at known concentrations in N2and stored in glass bulbs. NO (BOC Special Gases, 99.5 %)
%), NO2(Sigma-Aldrich, 99.5 %), SO2(Sigma-Aldrich, 99.9 %), N2(BOC, 99.99 %) and O2(BOC, 99.999
131
%) were used as supplied. Water vapour was added to the gas mixture by bubbling a known flow of N2gas
132
through a bubbler containing deionised water at a known temperature. Gases were mixed in a gas manifold 133
and passed into a six-way cross reaction cell at known flow rates (determined by calibrated mass flow 134
controllers). The pressure in the reaction cell was monitored by a capacitance manometer (MKS 135
Instruments, 626A) and controlled by throttling the exit valve to the reaction cell. The total gas flow rate 136
through the reaction cell was adjusted with total pressure to maintain an approximately constant gas 137
residence time in the cell (~0.1 s). All experiments were performed at T = (295 ± 2) K unless stated 138
otherwise. 139
For experiments using NO2, NO, CH3CHO or H2O as co-reagents, initiation of chemistry within the cell
140
was achieved using an excimer laser (KrF, Tui ExciStar M) operating at = 248 nm with typical laser 141
fluence in the range 30 – 80 mJ cm-2. Experiments in which SO2 was present as the co-reagent were
142
performed at a photolysis wavelength of 355 nm (typical fluence ~ 150 mJ cm-2), generated by frequency 143
tripling the output of a Nd:YAG laser (Spectron Laser Systems) to avoid potential multi-photon photolysis 144
of SO2at shorter wavelengths.33-35
145
Production of HCHO was monitored by laser-induced fluorescence (LIF) of HCHO at ~ 353.1 nm.36 146
Approximately 2 to 4 mJ pulse-1of laser light at ~ 353.1 nm was generated by a dye laser (Lambda Physik, 147
FL3002) operating on DMQ/dioxirane dye and pumped by a 308 nm excimer laser generating ~ 50 mJ 148
pulse-1 (XeCl, Lambda Physik LPX100). The output of the dye laser was passed through the reaction cell 149
in an orthogonal axis to the 248 nm / 355 nm photolysis laser output, with HCHO fluorescence detected in 150
the visible region of the spectrum by a channel photomultiplier (CPM, Perkin-Elmer C1943P) orthogonal to 151
both the photolysis laser and the LIF excitation laser beams. A Perspex filter was used to prevent scattered 152
laser light from the photolysis laser and the LIF excitation laser reaching the CPM. The HCHO 153
fluorescence signal was monitored as a function of time following photolysis of CH2I2by varying the time
154
delay between firing the photolysis laser and the LIF excitation laser through use of a delay generator (SRS 155
DG535). Results from between 5 and 20 photolysis shots were typically averaged prior to analysis. 156
157
2.2 Photoionisation Mass Spectrometry Experiments
158
Photoionisation mass spectrometry (PIMS) experiments were performed in this work to determine the 159
kinetics of CH2OO + SO2 at low pressure (~1.5 Torr) and 295 K by direct monitoring of CH2OO in
160
reactions performed under pseudo-first-order conditions. The PIMS apparatus has been described 161
previously in detail32, 37, 38 and only a brief description is given here. Gas mixtures of CH2I2/O2/N2 and
162
CH2I2/O2/N2/SO2 were prepared in a gas handling line, with reagents and reagent preparation as described
163
70 cm in length)viacalibrated mass flow controllers. The pressure in the reaction flow tube was monitored 165
by a capacitance manometer (MKS Instruments, 626A) and controlled by throttling the exit valve to the 166
flow tube. 167
Chemistry was initiated by a pulsed excimer laser (Lambda Physik, Compex 205) at a wavelength of 248 168
nm, with typical fluence of ~50 mJ cm-2, through reactions R1 and R2. A representative sample from the 169
reaction mixture effused into a high vacuum chamber (< 10-5 Torr, maintained by diffusion and turbo 170
pumps) via a 1 mm pinhole situated in the sidewall of the reaction flow tube. Components of the gas 171
mixture were photoionised using 118 nm vacuum ultraviolet (VUV) laser light (typically 1011 photons 172
pulse-1), generated by frequency tripling of the third harmonic of a Nd:YAG laser (Continuum Powerlite, 173
8010) in a Xe gas cell, and passed across the effusing gas flow within 2-3 mm of the sampling pinhole. 174
VUV light of 118 nm (equivalent to 10.5 eV) is sufficiently energetic to ionise CH2OO (threshold = 10.02
175
eV), but is below the threshold required to ionise other isomers at m\z = 46 (dioxirane, threshold = 10.82 176
eV; formic acid, threshold = 11.33 eV).10 Ions were sampled by the time of flight mass spectrometer (TOF-177
MS, Kore Technology Ltd.), and detected by an electron multiplier. The ion signals were amplified and 178
boxcar averaged on an oscilloscope and then stored on the control computer. The ion signals were 179
monitored as a function of time following photolysis of CH2I2 by varying the time delay between the
180
excimer laser and the Nd:YAG laser, used to generate the VUV radiation, through use of a delay generator 181
(SRS DG35). These kinetic traces consisted of typically 200 time points, with typically between 10 and 25 182
shot averaging per time point. 183
184
3. Results and Discussion
185
3.1 Photolysis of CH2I2/O2/N2mixtures 186
Figure 1 shows the HCHO fluorescence signal following photolysis of CH2I2/O2/N2 mixtures (i.e. in the
187
absence of any additional co-reagent), resulting in production of HCHO through reactions R1-R6:26, 32 188
CH2I2 + h CH2I + O2 (R1)
189
CH2I + O2 CH2OO + I (R2a)
190
CH2I + O2 + M CH2IO2+ M (R2b)
191
CH2OO + I HCHO + IO (R3)
192
CH2IO2 + I CH2IO + IO (R4)
193
CH2IO2+ CH2IO2 2 CH2IO + O2 (R5)
Previous work in this laboratory26has shown that the yields of CH2OO and CH2IO2 from R2 are dependent
196
on pressure, owing to initial formation of the excited species CH2IO2#, which can either decompose to
197
produce the CH2OO Criegee intermediate and iodine atoms (R2a) or can be collisionally stabilised to
198
produce the peroxy radical CH2IO2 (R2b). Since subsequent reactions of both CH2OO and CH2IO2 in the
199
absence of any additional co-reagent result in production of HCHO, there is no change in the total HCHO 200
yield as a function of pressure following photolysis of CH2I2/O2/N2mixtures.
201
Production of HCHO in reactions R1-R6 can be approximated by Equation 1:26, 32 202
k
t
k
t
k
k
k
S
t
k
S
S
t loss g'loss ' g ' g 1 loss 0 ,
HCHO
exp
exp
exp
(Equation 1)203
where SHCHO,t is the HCHO signal at time t, S0 is the height of the HCHO signal at time zero, S1 is the
204
maximum HCHO signal, k'gis the pseudo-first-order rate coefficient for HCHO growth, and klossis the rate
205
coefficient representing the slow loss of HCHO from the detection region via diffusion. Although the 206
HCHO growth through reactions R1-R6 is not strictly first-order, our previous work26 demonstrates that 207
Equation 1 can faithfully reproduce the HCHO growth kinetics. In the presence of excess co-reagent (e.g. 208
SO2, NO2) the kinetics of HCHO production from CH2OO are under pseudo-first-order conditions. Figure
209
1 shows the fits to HCHO production in the absence and presence of additional co-reagent, indicating the 210
fidelity of the fit to the analytical equation. 211
In the absence of any additional co-reagent, the first-order rate coefficient approximating the production of 212
HCHO, k'g, was found to vary from ~300 s-1 to ~3500 s-1, depending on the concentration of CH2I2, and
213
thus of I atoms, in the system, in keeping with the work of Welz et al.10 and Taatjeset al.11 Some initial 214
HCHO production was observed owing to multi-photon photolysis of CH2I2 and the subsequent rapid
215
reaction of3CH2with O2, withS0typically no greater than 5 – 10 % ofS1.39-43
216
217
3.2 CH2OO + SO2 218
The reaction of CH2OO with SO2(R7) was investigated in separate experiments using the PIMS method to
219
monitor CH2OO and the LIF method to monitor HCHO production.
220
CH2OO + SO2 HCHO + SO3 (R7)
221
Experiments using the PIMS method were performed at a total pressure of 1.5 Torr. Figure 2 shows a 222
typical decay for CH2OO observed in the presence of excess SO2, with the pseudo-first-order rate
223
coefficient for CH2OO decay found by least-squares fitting to Equation 2:
k
t
k
t
k
k
k
S
S
t ' ' samplingsampling sampling max
,
CH2OO
exp
exp
(Equation 2)225
whereSCH2OO,t is the CH2OO ion signal at timet,Smaxis the maximum CH2OO ion signal,k'is the
pseudo-226
first-order rate coefficient for CH2OO decay, andksamplingis the rate coefficient representing the transport of
227
molecules in the reactor to the ionisation region (~30,000 s-1, described in detail by Baeza-Romeroet al.38). 228
The bimolecular rate coefficient for CH2OO + SO2(k7) determined using the PIMS method at 1.5 Torr was
229
(3.6 ± 0.5) × 10-11 cm3s-1(Figure 3), similar to the value of (3.9 ± 0.7) × 10-11cm3s-1at 4 Torr reported by 230
Welzet al.10and several orders of magnitude greater than the values typically used in atmospheric models. 231
The LIF experiments monitoring HCHO production from CH2OO + SO2were performed over the pressure
232
range 50 – 450 Torr, with SO2concentrations in the range 2.4 × 10¹⁴to 1.6 × 1015cm-3. The HCHO growth
233
(Figure 4) was observed to display biexponential behaviour, with no decrease in the total HCHO yield 234
compared to experiments performed in the absence of any co-reagent, indicating complete titration of both 235
CH2OO and CH2IO2to HCHO. Kinetic parameters were determined by fitting to Equation 3:
236
k
t
k
t
k
k
k
f
S
t
k
t
k
k
k
k
f
S
t
k
S
S
t ' g2 loss loss ' g2 ' g2 1 ' g1 loss loss ' g1 ' g1 1 loss 0 , HCHOexp
exp
)
1
(
exp
exp
exp
(Equation 3) 237where SHCHO,t is the HCHO signal at time t, S0 is the height of the HCHO signal at time zero, S1 is the
238
maximum HCHO signal, k'g1is the pseudo-first-order rate coefficient for the fast HCHO growth,k'g2is the
239
pseudo-first-order rate coefficient for the slower HCHO growth, f is the fractional contribution of the fast 240
growth process to the total HCHO yield (hence (1-f) is the fractional contribution of the slower growth 241
process to the total HCHO yield), andklossis the rate coefficient representing the slow loss of HCHO from
242
the detection region via diffusion. For the SO2 experiments (conducted using a photolysis wavelength of
243
355 nm) there was no contribution fromS0(i.e. S0= 0).
244
The initial fast growth of HCHO displayed a linear dependence on [SO2], while the slower growth was
245
independent of [SO2] and at a similar rate to the observed HCHO production in the absence of any
246
additional co-reagent. The yields of HCHO from the faster growth process were consistent with production 247
from CH2OO + SO2, while those from the slower process were consistent with production from reactions of
248
CH2IO2 (i.e. reactions R4-R6). We thus determine k7 from linear fits of k'g1 (Equation 3) against [SO2].
249
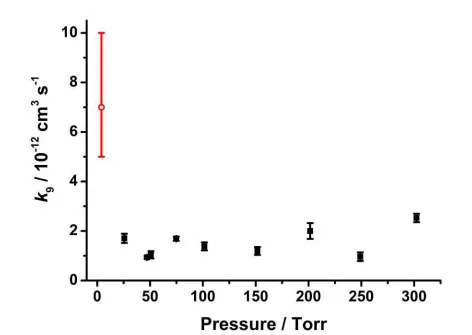
Figure 5 and Table 1 show the values ofk7 as a function of pressure. No significant dependence of k7 on
251
pressure was observed, with an average value of (3.42 ± 0.42) × 10-11cm3s-1for all experiments (PIMS and 252
LIF) described in this work (all errors are 1 unless stated otherwise). Moreover, there is no significant 253
change in the HCHO yield from the reaction of CH2OO with SO2as a function of pressure, indicating there
254
is little stabilisation of reaction products. These results are consistent with the low pressure results obtained 255
by Welzet al.10 and theoretical work by Vereeckenet al.13, and support arguments for an increased role of 256
CH2OO + SO2 in the atmosphere. Taatjes et al.12 have also shown that the reaction of the C2 Criegee
257
intermediate, CH3CHOO, with SO2 at a pressure of 4 Torr is also significantly faster than previously
258
expected, potentially indicating an increased role for CH3CHOO + SO2 in the atmosphere. However,
259
theoretical calculations predict that reactions of larger Criegee intermediates will exhibit pressure 260
dependence,13 and that production of SO3 in reactions of larger Criegee intermediates at atmospheric
261
pressures is unlikely owing to stabilisation of SO2-Criegee intermediate complexes to produce secondary
262
ozonide species, thus reducing the impacts of SO2 + Criegee intermediate reactions on H2SO4 and sulfate
263
aerosol production.13 Field observations and laboratory studies by Mauldin et al.23 indicate that larger 264
Criegee intermediates, such as those produced in the ozonolysis of monoterpenes, do impact on 265
atmospheric concentrations of H2SO4through oxidation of SO2, but that the impacts may not be as great as
266
those reported for CH2OO, potentially owing to stabilisation of reaction products. Further work is thus
267
required to investigate the effects of pressure on the reactions of larger Criegee intermediates. Moreover, 268
modelled impacts of increases in the rates of Criegee intermediate reactions with SO2are highly dependent
269
on the competition with rates of Criegee intermediate reactions with water vapour. We thus investigate 270
CH2OO + H2O in Section 3.6.
271
272
3.3 CH2I + NO2 273
Production of HCHO following photolysis of CH2I2/NO2/N2 mixtures was examined as a function of
274
pressure to facilitate assessment of the competition between CH2I + O2 (R2) and CH2I + NO2 (R8) in
275
CH2OO + NO2experiments (Section 3.4).
276
CH2I + NO2 HCHO + products (R8)
277
The production of HCHO could be described by Equation 1 (above), where k'g = k8[NO2], with
278
concentrations of NO2between 1 × 10¹⁴and 9 × 1014cm-3. Pseudo-first-order rate coefficients (k'g) were in
279
the range ~5000 to 45,000 s-1, and typically large compared to the rate coefficients describing HCHO 280
production in the absence of any additional co-reagent (Section 3.1). The bimolecular rate coefficient k8
281
was determined from plots ofk'gagainst [NO2] at each pressure (Figure S1), and was found to increase with
282
increasing pressure (Figure S2 and Table S1), with a corresponding decrease in the HCHO yield as the 283
A previous investigation of CH2I + NO2at pressures of 2 to 5 Torr gave a value ofk8= (2.2 ± 0.1) × 10-11
285
cm3s-1.44 Results of this work show k8to be (2.56 ± 0.17) × 10-11cm3 s-1at 50 Torr, increasing to (5.07 ±
286
0.28) × 10-11cm3s-1at 300 Torr. 287
The rate coefficient for reaction of CH2I radicals with O2(R2), has been shown previously to be ~1.6 × 10
-288
12
cm3s-1.45, 46 Experiments to investigate HCHO production in the reaction of CH2OO (produced by CH2I
289
+ O2) with NO2 must therefore be conducted at sufficiently high [O2] to avoid complications owing to
290
HCHO production from CH2I + NO2.
291
292
3.4 CH2OO + NO2 293
Experiments to investigate CH2OO + NO2(R9) kinetics were performed with sufficient NO2concentrations
294
(1.0 × 10¹⁴ to 1.4 × 1015cm-3) to ensure pseudo-first-order conditions for CH2OO loss whilst also ensuring
295
that k2[O2] > k8[NO2] at all times to avoid potential complications owing to HCHO production through
296
CH2I + NO2.
297
CH2I2 + h CH2I + O2 (R1)
298
CH2I + O2 CH2OO + I (R2a)
299
CH2I + NO2 HCHO + products (R8)
300
CH2OO + NO2 HCHO + NO3 (R9)
301
Figure 1 shows the evolution of the HCHO signal following photolysis of CH2I2/O2/N2/NO2 mixtures.
302
Experiments in which NO2 was used as a co-reagent resulted in a decrease in the total HCHO yield when
303
compared to experiments performed in the absence of any co-reagent. We attribute this to the formation of 304
the peroxy nitrate species CH2IO2NO2which inhibits formation of HCHO through reactions R4-R6.
305
Experiments performed at 273 K to increase the lifetime of CH2IO2NO2 with respect to dissociation to
306
CH2IO2NO2 did not result in any significant decrease in the HCHO yield compared to equivalent
307
experiments at 295 K, indicating that the CH2IO2NO2 lifetime at 295 K is sufficiently long to minimise
308
production of HCHO from CH2IO2. Thus, while there is a small contribution to the HCHO signal owing to
309
rapid chemistry following multi-photon photolysis of CH2I2, the growth of HCHO observed following
310
photolysis of CH2I2/O2/N2/NO2mixtures can be attributed to CH2OO + NO2(R9) exclusively.
311
The pseudo-first-order rate coefficient for the reaction of CH2OO with NO2 was determined by
least-312
squares fitting to Equation 1, with k'g= k9[NO2]. The bimolecular rate coefficient for CH2OO + NO2 (k9)
313
was subsequently determined from plots of k'g against [NO2], as shown in Figure 6. Fits to experimental
data using the numerical integration package Kintecus47 to determine k9, detailed in the supplementary
315
information, gave results within 10 % of those obtained using the analytical expression (Equation 1). 316
Values fork9as a function of pressure are shown in Figure 7 and Table 2. No significant dependence ofk9
317
on total pressure was observed over the pressure range investigated (25 to 300 Torr), with an average value 318
of k9= (1.5 ± 0.5) × 10-12 cm3s-1. Errors in k9 include the 1 errors in the fits to the bimolecular plots at
319
each pressure and an error of ± 10 % to account for any differences between fits using the analytical 320
expression and those obtained by numerical integration (see supplementary information). 321
Yields of HCHO in the presence of NO2, determined relative to experiments performed in the absence of
322
NO2 (i.e. production through reactions R3-R6), were consistent with the yields of CH2OO determined in
323
our previous work26 (Figure 8). This result demonstrates that ~100 % of CH2OO is titrated to HCHO by
324
CH2OO + NO2, indicating a lack of pressure dependence in k9, and that there is insignificant HCHO
325
production from CH2IO2 in the presence of NO2. Recent measurements by Ouyang et al.21 have
326
demonstrated the production of NO3 at atmospheric pressure from the reaction of CH2OO with NO2, thus
327
also suggesting little stabilisation of reaction products to a secondary ozonide species in this system. 328
No significant difference in k9or in yields of HCHO were observed between experiments performed in O2
329
bath gas and N2bath gas (results shown in Table 2), providing further evidence for similar quenching of the
330
nascent excited CH2IO2#species (produced in R2) by O2and N2, as discussed in our previous work.26
331
Results fork9obtained in this work, while lower than those reported by Welzet al.10, are on the same order
332
of magnitude, and demonstrate a significantly faster reaction between CH2OO and NO2 than suggested by
333
previous indirect measurements.1 334
335
3.5 CH2OO + NO 336
Production of HCHO following photolysis of CH2I2/O2/N2 mixtures in the presence of excess NO (3.6 ×
337
1014 to 1.7 × 1015 cm-3) exhibits biexponential growth, as shown in Figure 9, similar to experiments with 338
SO2. Again, no decrease in the total HCHO yield compared to experiments performed in the absence of
339
any co-reagent, indicating complete titration of both CH2OO and CH2IO2to HCHO. Kinetic parameters for
340
the processes contributing to HCHO production were obtained by fitting to Equation 3 (above). 341
The rate coefficient describing the fast HCHO growth process,k'g1, was observed to increase linearly with
342
increasing [NO], with the slope of a plot ofk'g1against [NO] giving a bimolecular rate coefficient of (1.07 ±
343
0.06) × 10-11cm3s-1at 250 Torr (Figure S4). The rate coefficient describing the slower HCHO growth,k'g2,
344
was found to be independent of [NO], and similar to the rate coefficient for HCHO production obtained in 345
the absence of NO. Reactions of peroxy radicals (RO2) with NO are well established, and are typically on
346
the order of 10-12to 10-11cm3s-1,48, 49with a rate coefficient for CH3O2+ NO of 7.2 × 10⁻¹²cm3 s-1,49while
Welzet al.10reported an upper limit of 6 × 10-14cm3s-1for the rate coefficient for CH2OO with NO. Thus,
348
in contrast to the experiments with SO2, we attribute the fast HCHO growth to the rapid decomposition of
349
CH2IO (R6), produced in the reaction of CH2IO2with NO (R10) and assign k10 = (1.07 ± 0.06) × 10-11
350
cm3s-1at 250 Torr. 351
CH2IO2 + NO CH2IO + NO2 (R10)
352
CH2IO HCHO + I (R6)
353
The slower HCHO growth thus contains contributions from CH2OO + I (R3) and potentially CH2OO + NO
354
(R11). In the absence of NO, production of HCHO was observed with a pseudo-first-order rate coefficient 355
of 1860 ± 100 s-1 (Equation 1). On addition of up to 1.7 × 1015 cm-3 NO, the average value for the rate 356
coefficient describing the slow HCHO growth (kg2 in Equation 3) was 1800 ± 340 s-1. Any potential
357
influence of NO on the observed rates of HCHO production is assumed to be within the error of the 358
experiment, and we thus place an upper limit of 2 × 10-13 cm3 s-1 on the rate coefficient for reaction of 359
CH2OO + NO (k11).
360
CH2OO + NO HCHO + NO2 (R11)
361
The upper limit fork11determined here is higher than that reported by Welzet al.(k11 < 6 × 10-14 cm3s-1),
362
owing to increased uncertainties associated with the biexponential fit, relatively low concentrations of NO, 363
and higher concentrations of CH2I2 used in these experiments compared to those performed by Welzet al.,
364
which lead to increased iodine atom concentrations in this work and thus increased rates of HCHO 365
production through CH2OO + I (R3). In subsequent experiments (notably those used to investigate the
366
kinetics of CH2OO + H2O) lower CH2I2 concentrations were used by changing the delivery method for
367
CH2I2. There are also additional uncertainties in the rate coefficients for reactions with NO owing to the
368
potential for production of NO2 in the gas lines leading to the reaction cell through oxidation of NO by O2
369
(the gas mixture has a residence time of ~1 s in the gas lines leading from the mixing line to the reaction 370
cell), leading to the potential for contributions to the observed HCHO growth from reactions involving 371
NO2.
372
373
3.6 CH2OO + H2O 374
Welz et al. did not observe any change in the rate of CH2OO decay on addition of water vapour to the
375
system, and reported an upper limit of 4 × 10-15 cm3s-1for the rate coefficient for reaction of CH2OO with
376
H2O (R12):
377
CH2OO + H2O HCHO + H2O2 (R12)
Similarly to the results of Welzet al., the addition of water vapour to the LIF experiments in this work did 379
not result in any significant change to the rate of HCHO production. The total HCHO yield was also 380
unaffected by the presence of water vapour, indicating complete titration of CH2OO and CH2IO2to HCHO
381
through reactions R3-R6. Figure 10 shows the HCHO fluorescence signals following photolysis of 382
CH2I2/O2/N2 in the absence and presence of water vapour. While the HCHO signal is reduced in the
383
presence of water vapour, there is no change in the kinetics and the reduction in signal is attributed to 384
increased fluorescence quenching by water vapour. 385
At 200 Torr the pseudo-first-order rate coefficient for HCHO production was determined to be 41 ± 15 s-1 386
by fitting to Equation 1, and was lower than the typical values reported in Section 3.1 as a result of lower 387
concentrations of CH2I2 to reduce the rate of HCHO production through radical-radical reactions in the
388
absence of water vapour. On addition of up to 1.7 × 1017cm-3water vapour to the system, a value of 52 ± 389
13 s-1was obtained, with no obvious dependence on the concentration of water vapour added. Owing to the 390
higher total pressures used in this work, enabling the addition of a higher number density of water vapour to 391
the system compared to the low pressure experiments by Welz et al., we are able to place an upper limit of 392
9 × 10-17 cm3 s-1 on k12 at 295 K by assuming any influence of water vapour is within the error of the
393
experiment. Ouyang et al.21 have reported a value for k12 of (2.5 ± 1) × 10-17 cm3 s-1 at 760 Torr,
394
determined in a relative rate experiment monitoring NO3 production and using the absolute value for k9
395
(CH2OO + NO2) reported by Welz et al.10 (7 × 10-12 cm3 s-1). Using the relative rate coefficient ratio
396
reported by Ouyanget al., with the value fork9determined in this work (1.5 × 10⁻¹²cm3s-1), a value ofk12
397
= 5.4 × 10⁻¹⁸cm3s-1can be obtained. 398
Modelling studies investigating the impacts of CH2OO chemistry on the atmospheric oxidation of SO2may
399
therefore be underestimating the effects of increasing the rate coefficient for CH2OO + SO2 owing to
400
overestimation of the competition with CH2OO + H2O, resulting in more significant impacts on
401
atmospheric production of H2SO4and sulfate aerosol than indicated thus far. However, Taatjeset al.12have
402
shown that theanti-CH3CHOO Criegee intermediate does react with water vapour (k = (1.0 ± 0.4) × 10-14
403
cm3 s-1), and the lack of reaction between CH2OO and water vapour may not be representative of all
404
Criegee intermediates. Modelling of Criegee chemistry in forested regions in Finland and Germany has 405
indicated that concentration of the CH2OO Criegee intermediate is only ~20-33 % of the concentrations of
406
larger Criegee intermediates derived from monoterpenes,14 with global modelling indicating that the 407
production rate of CH2OO comprises ~40 % of the total global production rate of all Criegee
408
intermediates.15 The chemistry of larger Criegee intermediates warrants further attention. 409
410
The reactions of Criegee intermediates with carbonyl compounds are of interest not only for their potential 412
atmospheric relevance, but also to facilitate the use of carbonyl compounds as scavengers of Criegee 413
intermediates in alkene ozonolysis experiments, enabling the determination of product yields of ozonolysis 414
reactions. 415
Horie et al.50 studied the relative rates of CH2OO reactions with CH3CHO (R13) and CF3COCF3 (R14) at
416
730 Torr in synthetic air using FT-IR spectroscopy to monitor the decay of CF3COCF3 and the production
417
of the secondary ozonide propene ozonide (methyl-1,2,4-trioxolane) from the reaction with CH3CHO, and
418
found the reaction with CF3COCF3to be 13 times faster than that with CH3CHO.
419
CH2OO + CH3CHO products (R13)
420
CH2OO + CF3COCF3 products (R14)
421
Secondary ozonide products were observed by Horie et al. for both R13 and R14 at 730 Torr, while 422
photoionisation mass spectrometry experiments by Taatjes et al.11 at 4 Torr observed a secondary ozonide 423
product for R14 but not for R13. Absolute rate coefficients for CH2OO + CH3CHO and CH2OO +
424
CF3COCF3 were measured by Taatjeset al.11 at 4 Torr in He by direct monitoring of CH2OO, with results
425
indicating the reaction with CF3COCF3to be ~32 times faster than that with CH3CHO andk13= (9.4 ± 0.7)
426
× 10-13cm3s-1at 4 Torr. As discussed by Taatjeset al.11, the differences between the results of Horieet al. 427
and Taatjes et al. may arise from differences in the fall-off behaviour of the two reactions, indicating 428
pressure dependence of one or both of the reactions over the range of pressures investigated. Differences in 429
product observations between the two studies also suggest pressure dependence in k13. In the low pressure
430
experiments, Taatjeset al.do not observe formation of secondary ozonide products. At 730 Torr, propene 431
ozonide was observed as the major product of R13, indicating collisional stabilisation of the nascent 432
secondary ozonide at high pressures. Recent theoretical work22 has investigated the potential energy 433
surface for the reaction of CH2OO with CH3CHO, and supports the observed pressure dependence of the
434
reaction. Reaction products are predicted to be collisionally stabilised to a secondary ozonide (SOZ) 435
species, with significant production of the SOZ at atmospheric pressure (760 Torr) and the SOZ dominating 436
the reaction products at pressures above 1000 Torr. 437
Pressure dependent kinetics are expected to be typical for reactions of larger Criegee intermediates with 438
atmospherically relevant species, including SO2, and investigation of the CH2OO + CH3CHO system may
439
therefore provide insight to the behaviour of other Criegee intermediates. 440
In this work, we investigate HCHO production from CH2OO + CH3CHO (R13) at total pressures between
441
25 and 300 Torr and concentrations of CH3CHO in the range 2 × 10¹⁴ to 1 × 1015 cm-3. Production of
442
HCHO displayed single exponential growth, and the HCHO fluorescence signal was fitted to Equation 1 443
(Figure 11). Figure 12 shows the bimolecular plot used to determine k13 at 25 Torr, givingk13 = (1.48 ±
CH2IO2 in reactions R4-R6 using the results of our previous work) was observed to decrease with
446
increasing pressure, indicating stabilisation of the CH2OO + CH3CHO reaction product at higher pressures
447
(R13b) and pressure dependence ink13.
448
CH2OO + CH3CHO CH2OO-CH3CHO#
449
CH2OO-CH3CHO# HCHO + CH3C(O)OH (R13a)
450
CH2OO-CH3CHO#+ M propene ozonide + M (R13b)
451
Figure 13 shows the Stern-Volmer plot for HCHO yields from R13, giving an intercept of 1.19 ± 0.39 and 452
slope (k13b/k13a) of (1.09 ± 0.08) × 10-18 cm3. Using an intercept of 1, at 4 Torr we estimate a yield of
453
HCHO of 88 %, with a yield of 4 % at 730 Torr, reconciling the results of Taatjeset al.11and Horieet al.50 454
and in agreement with theoretical work of Jalanet al.22 455
Owing to the decrease in HCHO yield with increasing pressure, assignment of the kinetics of R13 at 456
pressures above 25 Torr is challenging. Using the results of Taatjeset al.11at 4 Torr (k13= (9.5 ± 0.7) × 10
-457
13
cm3 s-1), together with those determined here at 25 Torr (k13 = (1.48 ± 0.04) × 10-12 cm3 s-1), 50 Torr
458
(~2.2 × 10⁻¹² cm3 s-1) and the determination ofk13b/k13a from the Stern-Volmer plot ((1.09 ± 0.08) × 10-18
459
cm3), we estimate a low pressure limit (k13,0) of ~ 1.6 × 10⁻²⁹ cm6s-1 and a high pressure limit (k13,inf) of ~
460
1.7 × 10⁻¹²cm3s-1(see supplementary information). 461
462
Conclusions
463
Reactions of the CH2OO Criegee intermediate with NO2, NO, SO2, H2O and CH3CHO have been
464
investigated over a range of pressures. The reactions of CH2OO with NO2, SO2and CH3CHO are rapid, in
465
agreement with recent measurements by Welz et al.10 and Taatjes et al.11 but in contrast to 466
recommendations for atmospheric modelling based on indirect measurements. Rate coefficients for 467
reactions of CH2OO with NO2 and SO2 are essentially independent of pressure over the pressure ranges
468
studied in this work. The rate coefficient for CH2OO + CH3CHO is pressure dependent, with stabilisation
469
to form the secondary ozonide reaction products at high pressures. 470
We observe no evidence for reactions of CH2OO with NO or H2O under the conditions employed in this
471
work, and place upper limits on rate coefficients for these reactions of 2 × 10-13cm3s-1and 9 × 10-17 cm3s -472
1
, respectively. The upper limit for the rate coefficient for CH2OO + H2O is significantly lower than has
473
been reported previously. Earlier assessments2, 14, 15, 17of the impacts of increased reaction rates for CH2OO
474
+ SO2and CH2OO + NO2will therefore be lower limits owing to overestimation of the impacts of CH2OO
475
+ H2O.
476
Acknowledgements
478
The authors are grateful to the National Centre for Atmospheric Science (NCAS) and the Engineering and 479
Physical Sciences Research Council (EPSRC, grant reference EP/J010871/1) for funding. 480
Tables
482
Pressure / Torr k7/ 10-11cm3s-1 Reference
1.5a 3.6 ± 0.5 This work
4 3.9 ± 0.7 Welzet al.10
50 3.04 ± 0.66 This work
100 3.11 ± 0.57 This work
150 3.17 ± 0.34 This work
250 3.68 ± 0.21 This work
350 3.19 ± 0.53 This work
[image:18.595.34.561.342.577.2]450 4.18 ± 0.30 This work
Table 1: Bimolecular rate coefficients for CH2OO + SO2 (k7) as a function of pressure. Errors are 1 .
483
a
Data at 1.5 Torr are from the PIMS experiments. 484
485
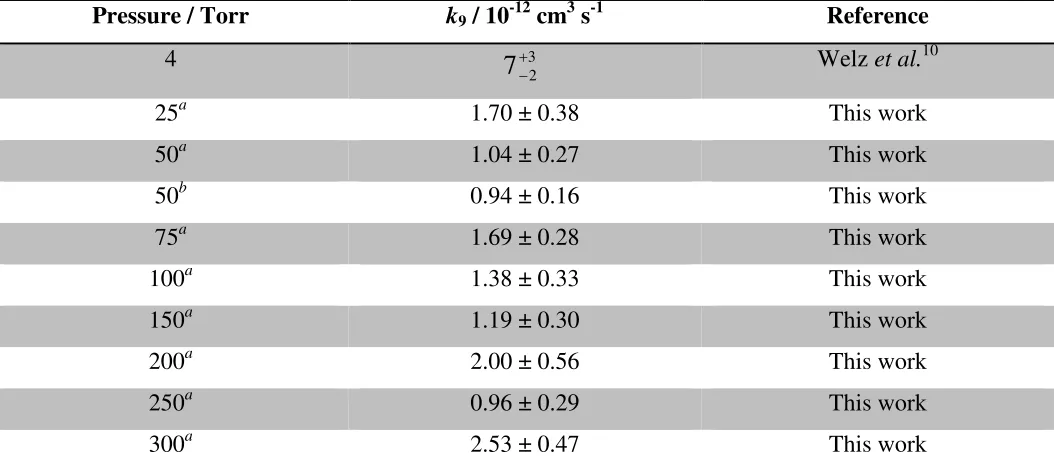
Pressure / Torr k9/ 10-12cm3s-1 Reference
4 3
2
7
Welzet al.1025a 1.70 ± 0.38 This work
50a 1.04 ± 0.27 This work
50b 0.94 ± 0.16 This work
75a 1.69 ± 0.28 This work
100a 1.38 ± 0.33 This work
150a 1.19 ± 0.30 This work
200a 2.00 ± 0.56 This work
250a 0.96 ± 0.29 This work
300a 2.53 ± 0.47 This work
Table 2: Bimolecular rate coefficients for CH2OO + NO2(k9) as a function of pressure. Errors include the
486
1 in the fits to the bimolecular plots and an error of ± 10 % to account for any differences between the fits 487
using the analytical expression and those obtained by numerical integration. aMeasured using N2 as the
488
bath gas;bMeasured using O2as the bath gas.
489
490
491
492
Figures
494
[image:19.595.45.537.83.436.2]495
Figure 1: HCHO fluorescence signals at 200 Torr following photolysis of CH2I2in the presence of O2in the
496
absence of any co-reagent (black open squares) and in the presence of NO2 (red open circles). The fits to
497
Equation 1 are shown by the solid lines, and givek'g = (460 ± 30) s-1 in the absence of any additional
co-498
reagent and k'g = (1490 ± 50) s-1 in the presence of NO2. The ratio of S1 (Equation 1) in the presence of
499
NO2to that in the absence of NO2is 0.37.
501
Figure 2: CH2OO ion signals at 1.5 Torr following photolysis of CH2I2/O2/N2in the presence of SO2, with
502
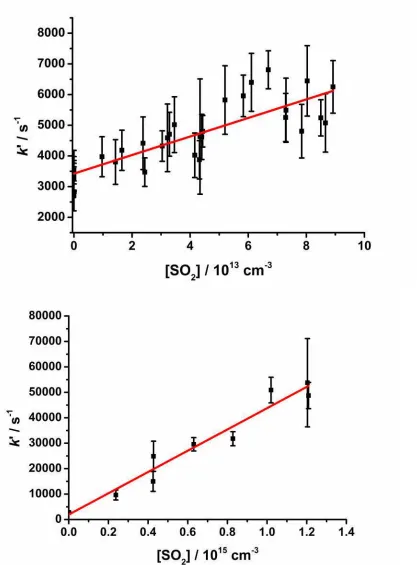
504
505
Figure 3: a) Pseudo-first-order rate coefficients (k') at 1.5 Torr, derived from fits to Equation 3, for the 506
decay of the CH2OO ion signal (m/z = 46, ionised using VUV radiation at 118 nm) following photolysis of
507
CH2I2/O2/N2 in the presence of SO2. Error bars are 1 . The fit to the data (shown in red) gives the
508
bimolecular rate coefficient for CHOO + SO2 (k7); b) Pseudo-first-order rate coefficients (k') for the rapid
509
HCHO production at 250 Torr following photolysis of CH2I2/O2/N2in the presence of SO2derived from fits
510
to Equation 2. Error bars are 1 . The fit to the data (shown in red) gives the bimolecular rate coefficient 511
[image:21.595.42.459.53.618.2]513
[image:22.595.44.509.56.705.2]514
Figure 4: HCHO fluorescence signals at 250 Torr following photolysis of CH2I2/O2/N2 in the presence of
515
SO2, with the fit to Equation 2 (solid red lines). The inset panel shows the evolution of the signal to longer
516
times. For these data,k'g1= (45500 ± 2240) s-1;k'g2= (3580 ± 280) s-1;kloss= (40 ± 9) s-1;f= (0.49 ± 0.01);
517
S0= (0.43 ± 0.01).
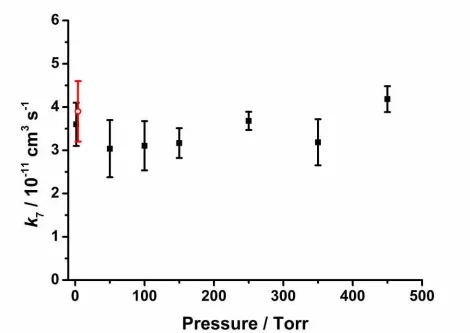
519
Figure 5: Bimolecular rate coefficients for CH2OO + SO2(k7) as a function of pressure. Error bars are 1 .
520
The plot includes results from the PIMS experiments (at 1.5 Torr) and the LIF experiments (pressures ≥ 50 521
523
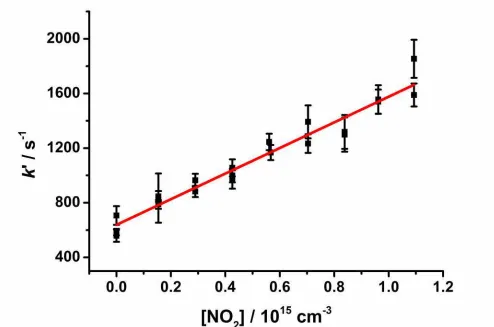
Figure 6: Pseudo-first-order rate coefficients (k') for HCHO production at 50 Torr, derived from fits to 524
Equation 1, following photolysis of CH2I2/O2/N2 in the presence of NO2. Error bars are 1 . The fit to the
525
data (shown in red) gives the bimolecular rate coefficient for CH2OO + NO2(k9).
527
Figure 7: Bimolecular rate coefficients for CH2OO + NO2(k9) as a function of pressure. Error bars are 1 .
528
530
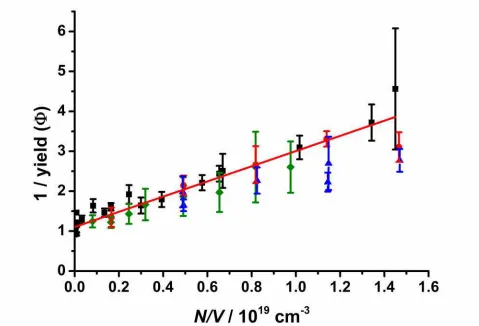
Figure 8: Stern-Volmer plot showing (inverse) yields of CH2OO as a function of pressure from the reaction
531
of CH2I with O2. Results from our previous work are shown for experiments monitoring iodine atom
532
production in the system (black squares), and monitoring of HCHO production in experiments with SO2
533
(blue triangles) and NO (red circles), with the best fit line (red). Yields of HCHO from the reaction of 534
CH2OO with NO2(this work, green diamonds), determined relative to the HCHO yields in the absence of
535
NO2 (i.e. through reactions R3-R6), suggest that there is 100 % titration of CH2OO to HCHO in the
536
presence of NO2 at all pressures (i.e. there is no stabilisation of reaction products), and that there is little
537
production of HCHO from CH2IO2in the system. The fit to our previous work (comprising data from the I
538
atom, NO and SO2experiments) gives an intercept of 1.10 ± 0.23 and a slope of (1.90 ± 0.22) × 10-19cm3.
539
The NO2experiments give an intercept of 1.05 ± 0.12 and a slope of (1.70 ± 0.18) × 10-19cm3.
541
[image:27.595.47.504.59.708.2]542
Figure 9: HCHO fluorescence signals at 250 Torr following photolysis of CH2I2/O2/N2 in the presence of
543
NO, with the fit to Equation 2 (solid red lines). The inset panel shows the evolution of the signal to longer 544
547
Figure 10: HCHO fluorescence signals at 200 Torr following photolysis of CH2I2/O2/N2 in the absence
548
(black open circles) and presence of water vapour (red open triangles), with the fits to Equation 1 (solid 549
lines). The differences in the amplitude of the signal result from the quenching of the fluorescence signal 550
by H2O. For these data, k’ = (41 ± 15) s-1 in the absence of water vapour and k’ = (52 ± 13) s-1 in the
551
553
Figure 11: HCHO fluorescence signals at 25 Torr following photolysis of CH2I2/O2/N2 in the presence of
554
CH3CHO, with the fit to Equation 1 (solid red line). For these data,k’ = (2040 ± 120) s-1.
556
Figure 12: Pseudo-first-order rate coefficients (k') for HCHO production at 25 Torr, derived from fits to 557
Equation 1, following photolysis of CH2I2/O2/N2in the presence of CH3CHO. Error bars are 1 . The fit to
558
the data (shown in red) gives the bimolecular rate coefficient for CH2OO + CH3CHO (k13).
560
Figure 13: Stern-Volmer analysis for HCHO yields from CH2OO + CH3CHO (R13) (corrected for HCHO
561
production from CH2IO2chemistry) as a function of total pressure, with the fit to the data (red). Error bars
562
are 1 . 563
564
References
566
1. D. Johnson and G. Marston,Chem. Soc. Rev., 2008,37, 699–716. 567
2. C. A. Taatjes, D.E. Shallcross, C. Percival,Phys. Chem. Chem. Phys., 2013,DOI: 10.1039/C3CP52842A. 568
3. N. M. Donahue, G. T. Drozd, S. A. Epstein, A. A. Presto and J. H. Kroll,Physical Chemistry Chemical Physics, 569
2011,13, 10848-10857. 570
4. M. S. Alam, M. Camredon, A. R. Rickard, T. Carr, K. P. Wyche, K. E. Hornsby, P. S. Monks and W. J. Bloss, 571
Phys. Chem. Chem. Phys, 2011,12, 11002-11015. 572
5. L. Vereecken,Science, 2013,340, 154-155. 573
6. T. L. Malkin, A. Goddard, D. E. Heard and P. W. Seakins,Atmospheric Chemistry and Physics, 2010,10, 1441-574
1459. 575
7. D. E. Heard, L. J. Carpenter, D. J. Creasey, J. R. Hopkins, J. D. Lee, A. C. Lewis, M. J. Pilling, P. W. Seakins, N. 576
Carslaw and K. M. Emmerson,Geophys. Res. Lett., 2004,31, L18112. 577
8. R. M. Harrison, J. Yin, R. M. Tilling, X. Cai, P. W. Seakins, J. R. Hopkins, D. L. Lansley, A. C. Lewis, M. C. Hunter, 578
D. E. Heard, L. J. Carpenter, D. J. Creasey, J. D. Lee, M. J. Pilling, N. Carslaw, K. M. Emmerson, A. Redington, 579
R. G. Derwent, D. Ryall, G. Mills and S. A. Penkett,Sci. Total Environ., 2006,360, 5-25. 580
9. D. Stone, L. K. Whalley and D. E. Heard,Chemical Society Reviews, 2012,41, 6348-6404. 581
10. O. Welz, J. D. Savee, D. L. Osborn, S. S. Vasu, C. J. Percival, D. E. Shallcross and C. A. Taatjes,Science, 2012, 582
335, 204-207. 583
11. C. A. Taatjes, O. Welz, A. J. Eskola, J. D. Savee, D. L. Osborn, E. P. F. Lee, J. M. Dyke, D. W. K. Mok, D. E. 584
Shallcross and C. J. Percival,Phys. Chem. Chem. Phys., 2012,14, 10391-10400. 585
12. C. A. Taatjes, O. Welz, A. J. Eskola, J. D. Savee, A. M. Scheer, D. E. Shallcross, B. Rotavera, E. P. F. Lee, J. M. 586
Dyke, D. K. W. Mok, D. L. Osborn and C. J. Percival,Science, 2013,340, 177-180. 587
13. L. Vereecken, H. Harder and A. Novelli,Physical Chemistry Chemical Physics, 2012,14, 14682-14695. 588
14. M. Boy, D. Mogensen, S. Smolander, L. Zhou, T. Nieminen, P. Paasonen, C. Plass-Duelmer, M. Sipila, T. 589
Petaja, L. Mauldin, H. Berresheim and M. Kulmala,Atmospheric Chemistry and Physics, 2013,13, 3865-3879. 590
15. J. R. Pierce, M. J. Evans, C. E. Scott, S. D. D'Andrea, D. K. Farmer, E. Swietlicki and D. V. Spracklen, 591
Atmospheric Chemistry and Physics, 2013,13, 3163-3176. 592
16. G. Sarwar, K. Fahey, R. Kwok, R. C. Gilliam, S. J. Roselle, R. Mathur, J. Xue, J. Yu and W. P. L. Carter, 593
Atmospheric Environment, 2013,68, 186-197. 594
17. C. J. Percival, Welz, O., Eskola, A.J., Savee, J.D., Osborn, D.L., Topping, D.O., Lowe, D., Utembe, S.R., Bacak, 595
A., McFiggans, G., Cooke, M.C., Xiao, P., Archibald, A.T., Jenkin, M.E., Derwent, R.G., Riipinen, I., Mok, 596
D.W.K., Lee, E.P.F., Dyke, J.M., Taatjes, C.A., Shallcross, D.E., Faraday Discuss, 2013, DOI:
597
10.1039/C3FD00048F
598
18. C. A. Taatjes, G. Meloni, T. M. Selby, A. J. Trevitt, D. L. Osborn, C. J. Percival and D. E. Shallcross, J. Am.
599
Chem. Soc., 2008,130, 11883-11885. 600
19. Y.-T. Su, Y.-H. Huang, H. A. Witek and Y.-P. Lee,Science, 2013,340, 174-176. 601
20. J. M. Beames, F. Liu, L. Lu and M. I. Lester,J. Am. Chem. Soc., 2012,134, 20045-20048. 602
21. B. Ouyang, M.W. McLeod, R.L. Jones, W.J. Bloss,Phys. Chem. Chem. Phys., 2013,15, 17070-17075. 603
22. A. Jalan, Allen, J.W., Green, W.H.,Phys. Chem. Chem. Phys., 2013,15, 16841-16852. 604
23. R. L. Mauldin, III, T. Berndt, M. Sipilae, P. Paasonen, T. Petaja, S. Kim, T. Kurten, F. Stratmann, V. M. 605
Kerminen and M. Kulmala,Nature, 2012,488, 193-+. 606
24. T. Kurten, J. R. Lane, S. Jorgensen and H. G. Kjaergaard,Journal of Physical Chemistry A, 2011, 115, 8669-607
8681. 608
25. H. Huang, A. J. Eskola and C. A. Taatjes,J. Phys. Chem. Lett., 2012,3, 3399-3403. 609
26. D. Stone, Blitz, M., Daubney, L., Ingham, T., Seakins, P.,Phys. Chem. Chem. Phys., 2013,15, 19119-19124. 610
27. H. Huang, B. Rotavera, A.J. Eskola, C.A. Taatjes,J. Phys. Chem. Lett., 2013,4, 3824-3824. 611
28. C. M. Roehl, J. B. Burkholder, G. K. Moortgat, A. R. Ravishankara and P. Crutzen, J. Geophys. Res. Atmos., 612
1997,102, 12,819 -812,829 613
29. L. J. Carpenter, W. T. Sturges, S. A. Penkett, P. S. Liss, B. Alicke, K. Hebestreit and U. Platt, J. Geophys. Res.
614
Atmos., 1999,104, 1679-1689. 615
30. L. J. Carpenter,Chem. Rev., 2003,103, 4953-4962. 616
31. L. J. Carpenter, S. D. Archer and R. Beale,Chem. Soc. Rev., 2012,41, 6473-6506. 617
32. T. J. Gravestock, M. A. Blitz, W. J. Bloss and D. E. Heard,Chem. Phys. Chem, 2010,11, 3928-3941. 618
33. R. A. Cox,J. Phys. Chem., 1972,76, 814-&. 619
35. K. J. Hughes, M. A. Blitz, M. J. Pilling and S. H. Robertson,Proc. Combust. Inst., 2002,29, 2431-2437. 621
36. D. T. Co, T. F. Hanisco, J. G. Anderson and F. N. Keutsch,J. Phys. Chem. A, 2005,109, 10675-10682. 622
37. M. A. Blitz, A. Goddard, T. Ingham and M. J. Pilling,Review of Scientific Instruments, 2007,78. 623
38. M. Teresa Baeza-Romero, M. A. Blitz, A. Goddard and P. W. Seakins, International Journal of Chemical
624
Kinetics, 2012,44, 532-545. 625
39. G. Hancock and V. Haverd,Chem. Phys. Lett., 2003,372, 288-294. 626
40. H. M. Su, W. T. Mao and F. N. Kong,Chem. Phys. Lett., 2000,322, 21-26. 627
41. U. Bley, F. Temps, H. G. Wagner and M. Wolf,Ber. Bunsen-Ges. Phys. Chem. Chem. Phys., 1992,96, 1043-628
1048. 629
42. R. A. Alvarez and C. B. Moore,J. Phys. Chem., 1994,98, 174-183. 630
43. M. A. Blitz, C. Kappler, M. J. Pilling and P. W. Seakins, Zeitschrift Fur Physikalische Chemie-International
631
Journal of Research in Physical Chemistry & Chemical Physics, 2011,225, 957-967. 632
44. A. J. Eskola, D. Wojcik-Pastuszka, E. Ratajczak and R. S. Timonen,Journal of Physical Chemistry A, 2006,110, 633
12177-12183. 634
45. A. J. Eskola, D. Wojcik-Pastuszka, E. Ratajczak and R. S. Timonen,Phys. Chem. Chem. Phys., 2006,8, 1416-635
1424. 636
46. A. Masaki, S. Tsunashima and N. Washida,J. Phys. Chem., 1995,99, 13126-13131. 637
47. J. C. Ianni,Kintecus, Windows Version 2.80,www.kintecus.com, 2002. 638
48. P. D. Lightfoot, R. A. Cox, J. N. Crowley, M. Destriau, G. D. Hayman, M. E. Jenkin, G. K. Moortgat and F. Zabel, 639
Atmos. Environ. A, 1992,26, 1805-1961. 640
49. R. Atkinson, D. L. Baulch, R. A. Cox, J. N. Crowley, R. F. Hampson, R. G. Hynes, M. E. Jenkin, M. J. Rossi and J. 641
Troe,Atmospheric Chemistry and Physics, 2006,6, 3625-4055. 642
50. O. Horie, C. Schafer and G. K. Moortgat,International Journal of Chemical Kinetics, 1999,31, 261-269. 643
644