This is a repository copy of
A 5D computational phantom for pharmacokinetic simulation
studies in dynamic emission tomography
.
White Rose Research Online URL for this paper:
http://eprints.whiterose.ac.uk/82339/
Version: Accepted Version
Article:
Kotasidis, FA, Tsoumpas, C, Polycarpou, I et al. (1 more author) (2014) A 5D
computational phantom for pharmacokinetic simulation studies in dynamic emission
tomography. Computerized Medical Imaging and Graphics, 38 (8). 764 - 773. ISSN
0895-6111
https://doi.org/10.1016/j.compmedimag.2014.06.018
[email protected]
Reuse
Unless indicated otherwise, fulltext items are protected by copyright with all rights reserved. The copyright
exception in section 29 of the Copyright, Designs and Patents Act 1988 allows the making of a single copy
solely for the purpose of non-commercial research or private study within the limits of fair dealing. The
publisher or other rights-holder may allow further reproduction and re-use of this version - refer to the White
Rose Research Online record for this item. Where records identify the publisher as the copyright holder,
users can verify any specific terms of use on the publisher’s website.
Takedown
If you consider content in White Rose Research Online to be in breach of UK law, please notify us by
Acce
pt
ed
Ma
nu
scri
pt
A 5D Computational Phantom for Pharmacokinetic Simulation
Studies in Dynamic Emission Tomography
Fotis A. Kotasidis1,2 , Charalampos Tsoumpas3,4, Irene Polycarpou3, Habib Zaidi1,5,6
1
Division of Nuclear Medicine and Molecular Imaging, Geneva University Hospital, Geneva, Switzerland
2
Wolfson Molecular Imaging Centre, MAHSC, University of Manchester, Manchester, UK
3
Department of Biomedical Engineering, Division of Imaging Sciences and Biomedical Engineering, KingÕs
College London, KingÕs Health Partners, St. ThomasÕ Hospital, London, UK
4
Division of Medical Physics, University of Leeds, Leeds, UK5 Geneva Neuroscience Centre, Geneva University,
Geneva, Switzerland
6Department of Nuclear Medicine and Molecular Imaging, University of Groningen, University Medical Center
Groningen, Groningen, The Netherlands
Corresponding author:
Fotis Kotasidis, Ph.D Geneva University Hospital
Division of Nuclear Medicine and Molecular Imaging CH-1211 Geneva, Switzerland
Tel: +41 22 372 7257
email: [email protected]
Acce
pt
ed
Ma
nu
scri
pt
Abstract
Introduction: Dynamic image acquisition protocols are increasingly used in emission tomography for drug
development and clinical research. As such, there is a need for computational phantoms to accurately describe
both the spatial and temporal distribution of radiotracers, also accounting for periodic and non-periodic
physiological processes occurring during data acquisition.
Methods:A new 5D anthropomorphic digital phantom was developed based on a generic simulation platform, for
accurate parametric imaging simulation studies in emission tomography. The phantom is based on high spatial and
temporal information derived from real 4D MR data and a detailed multi-compartmental pharmacokinetic
modelling simulator.
Results: The proposed phantom is comprised of 3 spatial and 2 temporal dimensions, including periodic
physiological processes due to respiratory motion and non-periodic functional processes due to tracer kinetics.
Example applications are shown in parametric [18F]FDG and [15O]H2O PET imaging, successfully generating
realistic macro- and micro-parametric maps.
Conclusions: The envisaged applications of this digital phantom include the development and evaluation of
motion correction and 4D image reconstruction algorithms in PET and SPECT, development of protocols and
methods for tracer and drug development as well as new pharmacokinetic parameter estimation algorithms,
amongst others. Although the simulation platform is primarily developed for generating dynamic phantoms for
emission tomography studies, it can easily be extended to accommodate dynamic MR and CT imaging simulation
protocols.
Acce
pt
ed
Ma
nu
scri
pt
I. INTRODUCTIONhe continuous development of anthropomorphic and small animal computational phantoms during the last
few decades has led to their ever increasing use in clinical and preclinical research [1]. The improved level of
their realism and flexibility compared to physical phantoms has led to their widespread use and adoption in
emission tomography. The ability to perform simulation studies using these computational phantoms allows a
number of methods and techniques used in the field of medical imaging and more specifically emission
tomography to be developed, evaluated and validated under controlled and known conditions.
Three-dimensional computational phantoms fall into 3 categories based on their design principle: mathematical
stylized phantoms, voxelized phantoms and hybrid equation-voxel phantoms. Mathematical phantoms use
mathematical equations to approximate the surface of simple and complex body structures. A number of such
designs exist in the literature, such as the Shepp-Logan [2] and the mathematical cardiac-torso (MCAT) phantoms
[3]. Such designs are useful, but their inability to model complex structures limits their application, especially
since there is need for more realistic simulation studies [4].
On the other hand, voxelized phantoms are based on using segmented anatomical information from high
resolution tomographic data (CT or MRI). A number of voxelized phantoms exist, covering anatomical variants
(etc...age, sex, body weight and height) [5-9]. Their main advantage is the level of realism compared to stylized
approaches; however, fail to provide the level of flexibility offered by mathematical phantoms.
The need to combine the detailed anatomical information provided by voxelized phantoms with the flexibility
offered by the mathematical phantoms, has led to the development of hybrid phantoms [10]. These models enable
the combination of flexibility and realism within a single anatomical phantom representation. The most popular is
the non-uniform rational B-splines (NURBS)-based cardiac-torso (NCAT) phantom [11, 12].
All these three-dimensional (3-D) computational phantoms offer a relatively simple and practical simulation
platform, but fail to take into account time-dependent physiological processes occurring during the course of the
imaging process. Consequently, this has led to the development of four-dimensional (4D) phantoms incorporating
time-dependent processes, such as cardiac and respiratory motion. The NCAT phantom and the latest generation
in this family of phantoms, the extended cardiac-torso phantom (XCAT) [13], were generated from multi-detector
respiratory-gated CT data, to model cardiac and respiratory motion. Similarly, dynamic MRI has also been used to
Acce
pt
ed
Ma
nu
scri
pt
Although such 4-D phantoms combine accurate anatomical information with models of temporally periodic
physiological processes, they do not take into account the variable and temporally non-periodic functional
processes occurring during the course of the study, constraining the level of realism and thus their potential
application in dynamic studies. However, the need for more accurate quantification both in clinical research and
drug development has lead to the increasing use of dynamic imaging protocols [16]. Moreover, pharmacokinetic
analysis of the time course of the activity distribution enables more targeted physiological parameters, such as
blood flow, metabolism and receptor occupancy, to be derived. In many studies, such parameters are more
informative compared to standardized uptake value (SUV) index, which remains the most widely adopted metric
in static whole-body PET imaging [17]. Consequently, the development of realistic digital phantoms for
multi-compartmental tracer kinetic studies in dynamic PET and SPECT, is of interest. Although a number of studies in
the field of image reconstruction and kinetic modelling have used in-house developed parametric phantoms, they
often feature roughly approximated anatomical structures with simple geometrical shapes, while lacking the
anatomical and physiological variability caused by temporally periodic phenomena such as respiratory motion
[18-22]. Recently a variant of the XCAT phantom was developed, named the perfusion cardiac-torso phantom
(PCAT), but its scope was limited to dynamic perfusion studies in cardiac imaging [23].
In this work, using high resolution anatomical and temporal information from real MR data, we develop a
five-dimensional (5-D) computational anthropomorphic phantom, incorporating temporal gating from respiratory
induced body motion and compartmental modelling tracer kinetic capabilities for parametric imaging simulation
studies in dynamic emission tomography. This new voxelized phantom, allows respiratory gated and non-gated
datasets to be simulated along with any tracer-specific compartmental model representing the temporal
distribution of the activity concentration during dynamic imaging protocols in PET and SPECT. Rather than being
region and application specific, kinetic parameters are freely assigned in the entire field-of-view (FOV),
generating voxel-wise parametric maps based on the tracer of interest.
II. METHODS
This Section describes the generic methodology used by the simulation platform for generating 5D parametric
imaging simulation phantoms using MR information for discerning anatomy and motion along with a kinetic
Acce
pt
ed
Ma
nu
scri
pt
THE KCL-HUG SERIES 5-D PHANTOM1. 3D Anatomical Phantom
Anatomical information are obtained from a high resolution 3D MRI scan and different organ structures are
segmented in order to generate the anatomical regions comprising the phantom, as described in Tsoumpas et al.
[24] and Buerger et al.[25]. Segmentation of the major structures is performed using a semi-automatic algorithm
with local thresholding [25]. This allows fast generation of 3D anatomical phantoms, facilitating personalized
patient-specific anatomical phantom designs, derived from a real MR scan. Apart from template organ structures
segmented from the MRI data, tumors of varying characteristics (e.g size and tracer uptake) can be manually
inserted in different phantom regions. However, since these tumors represent additional patient-specific structural
variants, they can easily be manipulated. Other anatomical variants can also be included depending on the required
anatomy and simulation conditions. Tumours or other anatomical variants can be manually delineated/drawn on
the 3D anatomical phantom and the tumor ROI mask can be saved and given a separate value, different to the
region it is embedded within. The complete anatomical phantom is a superposition of separate regions segmented
from the MRI data.
2. 4D Dynamic Phantom For 1-Tissue and 2-Tissue Models
To describe the temporal distribution of a given tracer and simulate time-activity curves (TACs), custom-made
software capable of providing multi-compartmental modelling for 1-tissue and 2-tissue models, was developed.
Given an input function, a temporal sampling protocol and known tracer-specific pharmacokinetic parameters
(constant rates) controlling the bi-direction flux of the tracer between the blood and tissue compartments (for each
organ structure in the anatomical phantom), TACs are generated. Typical input functions derived from arterial
sampling can be used, along with user defined ones, based on a parameterized model. For the sampling protocol,
any number of frames and frame durations can be accommodated within the typical scan times used for dynamic
studies in emission tomography. A blood volume component can also be included to generate the simulated TACs,
since typically both tissue and blood components are sampled at the voxel level in clinical acquisitions. The same
principles apply for the different kinetic parameters used, with separate constant rates for the different organs and
values obtained from the literature, if a generic activity distribution is to be realized. Alternatively, if a dynamic
Acce
pt
ed
Ma
nu
scri
pt
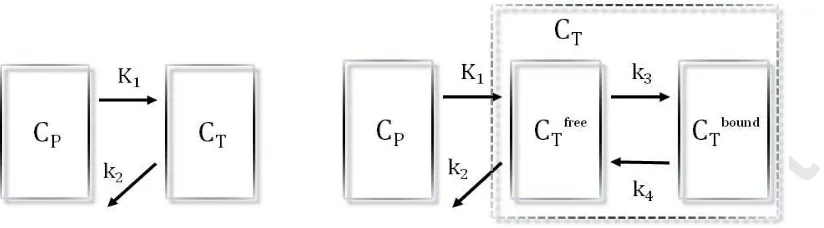
Fig. 1. Schematic diagram of a single-tissue and a two-tissue kinetic model showing the different compartments as well as the constant rate controlling the rate of change in activity concentration for each compartment.some applications certain macro-parameters, such as the volume of distribution (VT) and the tracer's net uptake
rate into the irreversibly bound compartment (Ki) are often more relevant and provide a more complete picture of
the underlying patho-physiology. These macro-parameters are combinations of micro-parameters and can easily
be adjusted to reflect specific conditions. Generic schematic diagrams for a single-tissue and a two-tissue
compartment model, used to generate the dynamic phantom image sequence, are shown in Fig. 1. The
time-dependent activity concentration in the tissue CT, can be described as a convolution of the impulse response
function (IRF), which is the response of the system to a delta-function, with the time-dependent activity
concentration in the plasma Cp. For the single-tissue model, the time-course of the activity distribution can be
described as:
p t V K
1 p t k 1 P 2
1
T
IRF
(
K
,
k
,
t
)
C
K
e
C
K
e
C
C
T1
2
̊
?
̊
?
̊
?
/ /ÄÅÃ ÕÖÔ(1)
where K1is the plasma to tissue rate constant (ml/s/ml). K1 can be further parameterized, based on the
Renkin-Crone model, as a product of blood flow (perfusion) and extraction fraction as
* +
F
e
EF
K
PSFÕ
Ö
Ô
Ä
Å
à /
?
?
1
/1 (2)
where PS is the permeability surface area product, Eis the extraction fraction and F is the blood flow [26, 27]. For
tracers with high permeability surface area product, extraction is close to unity and is independent of flow and
therefore K1 provides a measure of blood flow [28]. The platform is highly flexible, enabling to define the
[image:7.612.102.514.82.196.2]Acce
pt
ed
Ma
nu
scri
pt
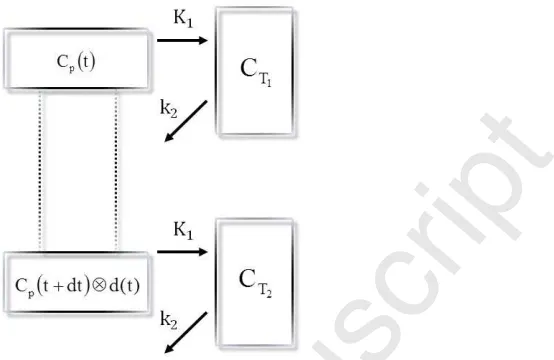
Fig. 2. Schematic diagram of a single-tissue model at 2 different target regions. As the injected bolus passes through the blood stream it becomes dispersed while its arrival time is shifted.
on the selected tracer. Alternatively, one can directly assign a fixed value for K1. Similarly, k2 can be given
directly or as a ratio of the influx rate (K1) and volume of distribution (VT).
For the two-tissue model, the time-course of the activity distribution can be described as:
*
+ *
]
+
*
+
_
Pt a 4 3 2 t a 1 4 3 1 2 1 P 4 3 2 1
T
k
k
a
e
a
k
k
e
C
a
a
K
C
)
t
,
k
,
k
,
k
,
K
(
IRF
C
-
/
1-
/
/
2̊
/
?
̊
?
/ / (3)where
*
+ *
+
2
k
k
4
k
k
k
k
k
k
a
2 42 4 3 2 4 3 2 1
/
-/
-?
(4)and
*
+ *
+
2
k
k
4
k
k
k
k
k
k
a
2 42 4 3 2 4 3 2 2
/
-?
(5)Simple or complex models can be realized in different organs, including dual input function models simulating
both arterial and venous blood supply in certain organs such as the liver [29]. Furthermore, the differential
temporal distribution of the activity concentration in the blood as it circulates through the blood vessels, can be
[image:8.612.235.512.88.268.2]Acce
pt
ed
Ma
nu
scri
pt
* +
*
+
*
+
dt
t
t
dC
t
t
C
t
'
C
PP P
F
v
F
-
/
/
?
(6)Given an input functionCp(t), a delay ( v) and a dispersion coefficient (k) one can estimateCp'(t). The tracer's
radioactive decay can also be taken into account and incorporated into the operational equations as a global
parameter.
TACs are assigned at the voxel level, generating time series of voxelized phantoms (4D phantom) with a
temporal sampling dictated by the dynamic acquisition protocol selected during the TAC generation. Although
only the case for single- and two-tissue models is presented in this work, the simulation platform allows any
kinetic model variant to be accommodated with an increasing degree of complexity and is therefore applicable for
simulating kinetics for any tracer and protocol.
3. 5D Phantom Using MR-Derived Motion Fields
So far the 4D phantom corresponds to a single reference position without including any information regarding
respiratory motion. To simulate different types of realistic motion during a dynamic scan, the fast analytic
simulation toolkit (FAST) is used [15]. A dynamic 4D MRI scan, providing uniform temporal sampling over
consecutive respiratory cycles during the dynamic scan, is used to generate the motion fields. This is achieved
using the amplitude signal from a virtual navigator and selecting a number of dynamic images from different
phases of the respiratory cycle as the respiratory gates. A reference gate is then selected with the remaining gates
being registered to the reference gate, in order to generate the motion fields. These MR-generated motion fields
are subsequently used to warp the dynamic phantom emission data and generate a number of respiratory gates for
each time frame in the dynamic image sequence. Using this methodology, deep and shallow breathing can be
simulated along with other non-periodic types of motion. If anatomical variants, such as tumors, are utilized in the
phantom, motion is simulated similar to the rest of the regions. Therefore, the tumor's shape (along with the other
regions) is deformed based on the motion fields, and as such, the deformation depends on where the tumor is
located.
4. 5D Projection Data
The simulated gated dynamic emission and attenuation data can then be used in conjunction with any medical
Acce
pt
ed
Ma
nu
scri
pt
imaging systems. Data can be forward projected to generate projection datasets for investigation of numerous
methods and techniques for motion correction, image reconstruction, and kinetic parameter estimation.
III. APPLICATION IN METABOLIC AND BLOOD FLOW PET PARAMETRIC IMAGING
In order to evaluate the phantom design and demonstrate the potential application of this simulation platform in
drug, clinical, algorithmic and methodology development, different clinical protocols were realized. Two dynamic
PET protocols corresponding to a metabolic imaging study with [18F]FDG and a perfusion study with [15O]H2O
were simulated and reconstructed. Subsequently and following image reconstruction, full kinetic analysis was
performed on the dynamic datasets and parametric maps of micro- and macro-parameters were generated.
1. 3D Anatomical Phantom
To generate the anatomical phantom, high resolution anatomical information (2!2!2 mm3), covering the thoracic
and upper abdominal area have been obtained from a healthy volunteer using MRI data [25]. As cortical bone is
not normally visible using common MR sequences, an ultra-short echo-time (UTE) 3D MRI sequence was
acquired (TR 6.5ms, flip angle 10o) obtaining one image during the free induction decay (TE1=0.14ms) and one
during the first echo time (TE2=4.6ms). Data were respiratory corrected to the end-exhale position. From the
difference image between the 2 UTE images, a number of regions of interest were segmented (soft tissue, cortical
bones, liver and lungs) and used to construct the anatomical phantom. The myocardium, heart ventricles and large
vessels were also segmented using a different ECG triggered balanced B-TFE MRI scan during free breathing
(TR/TE 4.7 ms/2.36 ms, TFE factor 26, Þkr"cping"qh";2o) [15, 31]. The scan was subsequently respiratory gated
again to the end-exhale position using a virtual navigator. Based on these 2 MRI scans, the different segmented
regions were combined to generate the anatomical phantom. Nine tumors of varying size were also embedded in
the lung (3), liver (3) and dome of the diaphragm (3). The tumors were drawn on the phantom and the tumor
masks were inserted as separate regions. The anatomical phantom was then sub-sampled to a volumetric
resolution of 2!2!2mm3 in order to represent typical voxel resolution encountered in PET imaging, with an image
volume of 336!336!81 voxels. Based on the segmented organs that were used to generate the anatomical
phantom, an attenuation map was also generated using a 4-region classification of the phantom.(air: 0 cm-1, lung:
Acce
pt
ed
Ma
nu
scri
pt
2. 4D Dynamic Phantom For [15O]H2O and [18F]FDG ModelsTwo dynamic PET protocols were simulated, corresponding to typical [15O]H2O and [18F]FDG scanning sessions
and representing a single-tissue and a two-tissue model. For the [15O]H2O protocol, TACs were generated using a
single-tissue 3 parameter model, including a blood volume component (K1, k2, bv). A 360 seconds total scan
duration was selected binned into 28 non-uniformly sampled time frames [14!5 s, 5!10 s, 3!20 s, 6!30 s],
representing a typical [15O]H2O protocol [32]:
p p t k 1 p P 2 1
T
IRF
(
K
,
k
,
t
)
C
bvC
K
e
C
bvC
C
?
̊
-
?
/2̊
-
(7)
For the [18F]FDG protocol, TACs were generated using a two-tissue 4 parameter model assuming irreversible
kinetics during the course of the scan (k4=0) and including also a blood volume component (K1, k2, k3and bv). A
3300 seconds total scan duration was chosen binned into 29 non-uniformly sampled time frames [9!10 s, 3!30 s,
4!60 s, 4!120 s, 8!300 s] [33]:
* +
*
+
*
* ++
p pt k k 2 3 3 t k k 1 p P 3 2 1
T
1
e
C
bvC
k
k
k
e
K
bvC
C
)
t
,
k
,
k
,
K
(
IRF
C
2 3 2 3̊
-ÕÕ
Ö
Ô
ÄÄ
Å
Ã
/
-?
-̊
?
/ - / -(8)
In both imaging protocols, a single input function model was used, representing delivery through arterial blood,
while no differential delay and dispersion were used in simulating the kinetics for the different regions, with a
common reference delivery time between them. Furthermore, kinetic parameters derived from the literature,
summarized in Tables I and II, were used to generate the dynamic data. For the [15O]H2O study, a measured input
Acce
pt
ed
Ma
nu
scri
[image:12.612.108.512.98.445.2]pt
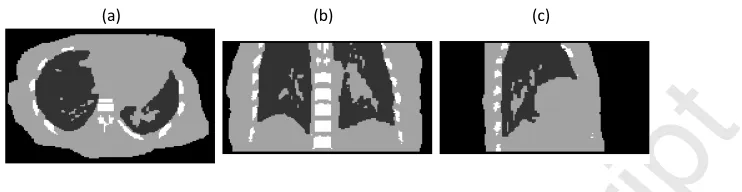
TABLE I. Simulated kinetic parameters for the single-tissue model. .
K1
ml/s/ml
k2
ml/s/ml
Bv ml/ml
VT ml/ml
Lungs 0.0008 0.0014 0.06 0.6
Bone 0.0018 0.0027 0.00 0.69
Soft tissue 0.0005 0.0042 0.00 0.12 Ventricles 0.0000 0.0000 1.00 0.00 Myocardium 0.0167 0.0183 0.15 0.91
Tumors 0.0098 0.0161 0.08 0.61
Liver 0.0117 0.0119 0.05 0.98
TABLE II. Simulated kinetic parameters for the two-tissue model.
K1
ml/s/ml
k2
ml/s/ml
k3
ml/s/ml
Bv ml/ml
Ki
ml/s/ml
Lungs 0.0007 0.0048 0.0006 0.1510 0.0001
Bone 0.0027 0.0033 0.0010 0.0000 0.0006
Soft tissue 0.0008 0.0054 0.0014 0.0190 0.0002
Ventricles 0.0000 0.0000 0.0000 1.0000 0.0000
Myocardium 0.0033 0.0170 0.0025 0.5450 0.0004
Tumors 0.0031 0.0073 0.0056 0.0800 0.0014
Liver 0.0209 0.0222 0.0000 0.1650 0.0000
3. Respiratory Data
4D MR data were also acquired from the same healthy volunteer, providing a uniform temporal sampling of a few
complete respiratory cycles (~25 seconds dynamic acquisition with 0.7 seconds temporal sampling - 35 dynamic
image volumes) as described by Buerger et al[25]. An amplitude signal from a virtual navigator on the diaphragm
dome was then generated and 8 dynamic images were chosen to sample a full respiratory cycle. Subsequently,
each gated image, corresponding to a different phase in the respiratory cycle, was registered to the reference gate
(i.e. end-exhale position) to estimate the corresponding motion fields, using a local affine registration algorithm
[34]. Using the MRI-derived motion fields, the dynamic emission phantom images were warped into 8 different
phases over the respiratory cycle, representing a shallow breathing pattern. Therefore, 8 gated 3-D images were
generated for each time frame in the dynamic 4D phantom (3 spatial dimensions {336!336!81} ! 28/29 time
frames ! 8 respiratory gates). Attenuation data were treated similarly, generating 8 gated attenuation maps for
Acce
pt
ed
Ma
nu
scri
pt
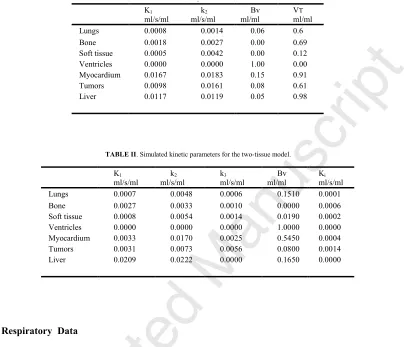
Fig. 3. Transverse (a), coronal (b) and sagittal (c) images of the simulated attenuation map corresponding to a single gate.4. 5D Projection Data
To generate the forward projected data, an in-house simulator was used. The dynamic emission images for each
respiratory gate and time frame along with the respiratory gated attenuation images, were forward projected into a
virtual scanner using Siddon's line of response driven algorithm, along with the geometry configuration of the
Biograph 6 Barrel HiRez PET/CT scanner (Siemens Molecular Imaging Inc.TN, USA) [35]. Both the noiseless
emission as well as attenuation projection data were histogrammed into a 336!336!313 3-D sinogram (336!
336!313! 28/29 time frames ! 8 respiratory gates for the emission data and 336!336!313! 8 respiratory
gates for the attenuation data). Subsequently the emission projection data were attenuated to generate the
attenuated emission sinogram for each respiratory gate and time frame.
5. Image Reconstruction and Kinetic Modelling
The generated projection data were reconstructed using in-house developed image reconstruction software capable
of reconstructing data from the Biograph 6 HiRez PET/CT [36]. Data from were reconstructed using an ordinary
Poisson ordered subsets expectation maximization algorithm (OP-OSEM) with 10 iterations (21 subsets).
Following image reconstruction, full compartmental analysis of the dynamic datasets was performed to derive
parametric maps of micro- and macro-parameters of interests. For both clinical datasets, kinetic modelling
equations similar to those used to generate the data, were used to model the time-course of the activity
distribution. The models were linearized using the generalized linear least square (GLLS) method [37, 38], and
model parameters were fitted to the measured data by minimizing a non-negative weighted least square objective
function (NNWLS). For the [15O]H
2O dataset, the GLLS was used with 2 internal iterations while parameter
initialization was based on the linear least square algorithm (LLS) [37]. For the [18F]FDG dataset, 4 internal GLLS
[image:13.612.142.513.102.198.2]Acce
pt
ed
Ma
nu
scri
pt
0 50 100 150 200 250 300 350 0 5 10 15 20 25 Time (sec) Ac ti vit y lung bone torso ventricles myocardium tumours liver 0 50 100 150 200 250 300 350 0 5 10 15 20 25 Time (sec) Ac ti vit y lung bone torso ventricles myocardium tumours liver
0 500 1000 1500 2000 2500 3000 0 2 4 6 8 10 12 Time (sec) Ac ti vit y lung bone torso ventricles myocardium tumours liver
0 50 100 150 200 250 300 350
0 5 10 15 20 25 30 Time (sec) Ac ti vit y
Delay = 0 sec
Dispersion coefficient = 0.1
Delay = -8 sec
Dispersion coefficient = 0.09 Delay = -16 sec
Dispersion coefficient = 0.08
(a) (b)
(c) (d)
Fig. 4. Simulated TACs representing (a) [15O]H
2O and (b) [18F]FDG kinetics, used for the different regions in the 3D anatomical
phantom. Input functions with differential delay and dispersion in different organs can be used while organ TACs having a dual input function delivery can also be simulated. The simulated [15O]H
2O TACs from (a) are shown in (c) using a dual input model
in the liver, while 3 input functions from a [15O]H
2O scan with different delay and dispersion are shown in (d).
iterations were used, while initialization was based on uniform parameters. For the [15O]H2O data, parametric
images of perfusion (K1), clearance rate (k2), fractional blood volume (bv) and volume of distribution (VT), were
derived. Similar for the [18F]FDG data, parametric images of K1, k2, k3, bv and net uptake rate Ki. were generated.
IV. RESULTS
Six regions were segmented from the 3D MRI scans: soft tissue, liver, heart ventricles, lungs, rib cage and spine
and myocardium. Representative slices through the simulated attenuation map of the combined anthropomorphic
phantom are shown in Fig. 3. Using the kinetic parameters from Tables I and II and the kinetic modelling
[image:14.612.96.516.84.437.2]Acce
pt
ed
Ma
nu
scri
pt
(a) (b)
(i)
(ii)
(iii)
(iv)
(c) (d)
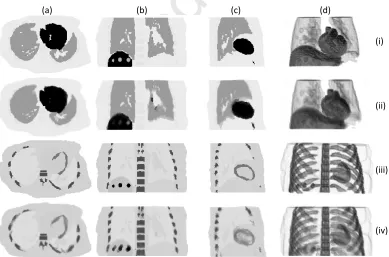
Fig. 5. Transverse (a), coronal (b), sagittal (c) and 3D rendered (d) simulated images of the [15O]H
2O phantom at 2 different time
points during the simulated dynamic [15O]H
2O image sequence corresponding to an early time frame (i-ii) (t = t0 +20 s) and a
late time frame (iii-iv) (t = t0 +360 s) where t0 is the reference start time. Images are shown for a single respiratory gate (i, iii)
and for all gates superimposed (ii, iv).
(a) (b)
(i)
(ii)
(iii)
(iv)
(c) (d)
Fig. 6. Transverse (a), coronal (b), sagittal (c) and 3D rendered (d) simulated images of the [18F]FDG phantom at 2 different
time points during the simulated dynamic [18F]FDG image sequence corresponding to an early time frame (i-ii) (t = t
0 +40 s) and
a late time frame (iii-iv) (t = t0 +3400 s) where t0 is the reference start time. Images are shown for a single respiratory gate (i, iii)
[image:15.612.107.510.91.348.2] [image:15.612.104.493.401.658.2]Acce
pt
ed
Ma
nu
scri
pt
such as the myocardium and the tumors exhibit a high upslope, with the washout of the tracer governed by k2.
Similarly, Fig. 4(c) shows the same TACs but using a dual input function model in the liver while in the rest of the
regions, a single arterial input function model is used, similar to the one used in Fig.4(a). The dual input model in
the liver, represents tracer delivery from both the hepatic artery and portal vein. In order to simulate the portal
vein, the gastrointestinal compartment can be used, representing a region outside the simulated patientÕs FOV,
which is a single compartment model between the arterial blood and the gut compartment. Although a delay in the
delivery of each input can also be accommodated, no delay between the arterial and portal input functions was
assumed. The TAC in the heart ventricles which represents the activity concentration in the arterial blood, was
simulated using a blood volume component equal to unity as can be seen from Table 1, with no contribution from
the tissue component. Hence, the TAC is equal to the input function. To simulate the more realistic case of
differential tracer delivery time in different regions, including differential dispersion of the input function, the
generated TACs in each region can take these effects into account. Three input functions are shown in Fig. 4d
with 8 second delay between them and different dispersion coefficients. By changing the delay, the input function
is shifted with respect to the reference global zero time point in the simulated protocol. Simulated TACs for the
[18F]FDG dataset are shown in Fig. 4b, again for the same regions. Looking at the tumor TAC, the trapping of the
tracer is evident due to the irreversible kinetics attributed to a high simulated k3 parameter and a k4 = 0 which is a
valid assumption for the duration of a typical [18F]FDG scan. Similar to the [15O]H2O dataset shown in Fig. 4a, the
activity concentration in the ventricles is representative of the input function. The simulated TACs shown in Figs.
4a and 4b were used to generate the dynamic phantoms for the [15O]H2O and [ 18
F]FDG studies.
Representative emission data from the simulated dynamic and respiratory gated [15O]H
2O and [18F]FDG
phantoms are shown in Figs. 5 and 6, respectively. Fig. 5 shows typical slices and volume rendered images from
early and late time frames into the dynamic [15O]H
2O dataset. The images are shown for a single respiratory gated
phase (one of the 8 gated images), which corresponds to the reference gate (end-exhale position). In the early
frame, activity is high in the heart ventricles and aorta, representing the input function as seen in Fig. 4, with the
tissue response governed by the influx rate constant. Conversely, in the late frame, activity is representative of the
tracer's washout. As the temporal frames are shown from a single gate position, they correspond effectively to
motionless data and hence without any blurring in the voxelized dynamic data. The same time frames are shown
in Fig. 5 (ii) and (iv) but with all 8 respiratory gated images superimposed, creating a blurred representation of the
Acce
pt
ed
Ma
nu
scri
pt
(a) (b)
(i)
(ii)
(iii)
(iv)
(c) (d)
Fig. 7. Transverse (a), coronal (b), sagittal (c) and 3D rendered (d) reconstructed [15O]H
2O (i-ii) and [18F]FDG (iii-iv) emission
images at 2 different time points corresponding to an early time frame (i, iii) and a late time frame (ii,iv) where t0 is the reference
start time. Images are shown for a single respiratory gate corresponding to motionless data.
excluded to accommodate simulation of different breathing patterns. Using all 8 gates, increased motion is
simulated in the superior-inferior direction since the bulk of the motion occurs in this direction. During
end-inspiration the lungs covered 359802 mm3 while during end expiration a ~23% difference in volume was observed
with the lungs covering 283954 mm3. Similarly in Fig. 6, an early and late [18F]FDG time frame is shown for a
single gate and for all gates superimposed. As seen from the coronal images (Fig. 6b), the irreversible trapping of
the tracer in the tumors is evident with increased activity concentration in the late frame signifying increased
uptake rate. Motionless projection data from the reference gate were reconstructed as described in the methods
Section. Reconstructed images from both the dynamic [15O]H2O (i-ii) and [18F]FDG (iii-iv) studies are displayed
in Fig. 7. The images representing again an early and a late time frame correspond to those from the motionless
dynamic phantoms shown in Figs. 5 and 6. The reconstructed images are qualitatively identical to the simulated
ones, demonstrating the capabilities of this parametric phantom in algorithmic development for image
reconstruction applications. However, in parametric imaging studies, the endpoint parameters are the micro- or
macro-parameter maps, rather than images of activity concentration. As such and following image reconstruction,
[image:17.612.101.510.89.368.2]Acce
pt
ed
Ma
nu
scri
pt
Fig. 8. Parametric images of K1, k2, bv and VT(a) simulated and (b) estimated (using GLLS) following 3D reconstruction of the
simulated single gate dynamic [15O]H
2O phantom dataset. Rendered images of the estimated maps are also shown in (c).
Fig. 9. Parametric images of K1, k2,k3, bv andKi,(a) simulated and (b) estimated (using GLLS), following 3D reconstruction of the simulated single gate dynamic [18F]FDG phantom dataset. Rendered images of the estimated maps are also shown in (c).
Fig. 8 shows the simulated parametric images of influx rate (K1), efflux rate (k2), blood volume (bv) and volume of
distribution (VT) as well as the estimated parametric maps following post-reconstruction kinetic analysis of the
dynamic [15O]H2O dataset. 3D rendered images of the estimated parametric maps are also shown. Similarly, Fig. 9
displays the simulated K1, k2, k3, bv and Ki parametric images and the estimated transverse and 3D rendered
parametric maps following post-reconstruction kinetic analysis of the dynamic [18F]FDG dataset. As can be seen
(a)
(b)
(c) K1(ml/sec/ml) k2(ml/sec/ml) k3(ml/sec/ml) bv (ml/ml) Ki(ml/sec/ml)
(a)
(b)
[image:18.612.100.509.85.294.2] [image:18.612.101.502.334.519.2]Acce
pt
ed
Ma
nu
scri
pt
(a) (b)
Fig. 10 Profiles through (a) the volume of distribution (VT) and (b) net uptake rate (Ki) parametric images, obtained from the
dynamic [15O]H
2O and [18F]FDG datasets respectively. Profiles are shown for the simulated and the estimated parameters
following post-reconstruction kinetic analysis.
parametric maps appear broadly similar to the simulated ones while both micro- and macro-parameter maps can
be estimated with the proposed simulation platform. Again since projections from a single gate were used, the
estimated parametric maps are representative of motionless data. Consequently, any visible blurring in the
estimated parametric maps is attributed to the lack of convergence during image reconstruction. A more
quantitative comparison can be seen in Fig.10 where profiles through the VT and Ki parametric images from the
[15O]H2O and [ 18
F]FDG dataset are plotted. Reconstructed VT values vary between 0 and 1 ml/ml depending on
the region while Ki, representing the net uptake rate, vary between 0 and 0.00133 ml/s/ml with the maximum net
uptake seen in the tumors.
V. DISCUSSION
A 5D anthropomorphic computational phantom for parametric imaging studies in dynamic emission tomography
based on a generic simulation platform is described. The new platform comprises of a patient specific
MR-segmented anatomical representation, including user-defined patient specific anatomical variants, coupled with a
detailed kinetic modelling simulator, capable of generating realistic dynamic imaging protocols based on any
given tracer specific model. The phantom is envisaged to become available for academic research applications in
imaging physics, providing a library of anatomical phantoms coupled with the pharmacokinetic simulator and
representative motion fields. Supplementary models, in addition to those demonstrated in this study could be
[image:19.612.101.511.84.283.2]Acce
pt
ed
Ma
nu
scri
pt
Compared to current computational phantoms reported in the literature, such as the NCAT and XCAT [10], the
proposed design lacks the flexibility offered by coupling mathematical models to detailed generalized anatomical
information. However, the proposed methodology counterbalances this by benefiting from a fast simulation
environment, with semi-automatic segmentation techniques, making it possible to simulate personalized dynamic
protocols [39]. Having the MR data available, construction of the anatomical phantom, kinetic modelling
simulation, motion field estimation and application, and forward projection to generate the raw emission and
attenuation data should take between 20 and 25 hours [15]. However the majotiy of this time is taken by the
forward projection step and depends on the imaging system, the number of respiratory gates and the kinetic
modelling framing being simulated. With the recent advent of hybrid PET-MR systems, MR information is readily
available for each patient, omitting the need for additional scanning sessions [40]. Furthermore, MR offers a
competitive advantage compared to CT-derived anatomical phantoms since it results in no radiation dose to the
subject. However, if other patient-specific anatomical information is available from different modalities, this can
easily be incorporated to picture a more detailed anatomical representation. However, in this case, the additional
structural information would need to be registered to the MR space prior to being segmented and incorporated in
the phantom. If MR information is not available and the anatomical information derived exclusively from a
different modality (such as CT), then there is no need for additional registration as the structural information is
derived solely from a single modality. While patient-specific models can be realized, in cases where only a generic
anatomical representation is needed, template anatomical information can be drawn from an anatomical library
based on databases of healthy males and females.
Apart from a more personalized anatomical design, the dynamic phantom in reference paves the way for
generic realistic parametric imaging simulation studies not previously available with application-specific
platforms such as PCAT [23]. For algorithmic development, kinetic parameters for all organ structures can be
drawn from existing literature; however, again if a more personalized simulation is needed, following kinetic
analysis of an existing dynamic study, patient-specific kinetic parameters can be used in conjunction with the
tracer-specific model and a patient or population based input function.
One of the drawbacks of voxelized phantoms, previously seen as a disadvantage compared to mathematical
and hybrid phantoms is their inability to describe periodical motion induced variations [10]. However, this
drawback was overcame by exploiting the possibility to transform the dynamic PET data with MR-derived motion
Acce
pt
ed
Ma
nu
scri
pt
platform to investigate and develop a number of kinetic modelling related methods and techniques in the presence
of motion.
Although the current phantom significantly enhances the simulation capabilities in the field of parametric
imaging in emission tomography, further improvements can be accommodated. Extension of the simulated FOV
from a single bed position to a multi-bed coverage is achievable since current PET-MR systems perform whole
body acquisition protocols. This is of particular relevance since whole-body parametric imaging protocols have
recently been introduced, demonstrating enhanced tumor detectability and more accurate quantification compared
to traditional static imaging protocols relying on SUV indices [41].
Apart from improvements in the anatomy, further improvements can be realized in simulating the transit of the
tracer through the vasculature and capillaries following tracer injection. More detailed modelling of the underlying
physiological processes governing the tracer's delivery and uptake can further enhance the simulation capabilities
of the existing platform, especially for drug and tracer development studies. Two PET dynamic protocols were
demonstrated in this work, representing the bulk of imaging applications in PET imaging. The platform can also
be used in a similar way for any clinical application in SPECT imaging. Furthermore, even though the platform is
primarily designed for parametric imaging studies in emission tomography, it can easily be extended to
accommodate dynamic simulation studies for other modalities. Dynamic contrast enhanced MRI and CT using
iodine-based contrast agents can take advantage of the proposed methodology to investigate different
pharmacokinetic related methods and techniques [42]. Although kinetic modelling in these modalities is slightly
different compared to emission tomography techniques [43], the software can easily be extended in the future to
incorporate pharmacokinetic models tailored to DCE-MR and DCE-CT imaging protocols.
VI. CONCLUSION
As dynamic imaging protocols are adopted more frequently for clinical research and drug development,
simulation solutions for more efficient development, evaluation and validation of novel tracers, protocols,
methods and techniques in parametric imaging studies, are of interest. In this work, a new 5D computational
phantom for generating realistic datasets for parametric imaging studies in emission tomography, was presented.
The proposed phantom can be used for a number of applications both in PET and SPECT, including motion
tracking and correction, conventional and direct image reconstruction algorithm development, dynamic imaging
protocol design, simulations for tracer and drug development and kinetic parameter estimation algorithm
Acce
pt
ed
Ma
nu
scri
pt
community and is envisaged to become available for simulation studies in dynamic tomography.
ACKNOWLEDGMENTS
This work was supported by the Swiss National Science Foundation under grants SNSF 31003A-135176 and
31003A-149957 as well as EU COST Action TD1007 (www.pet-mri.eu). Data to become available at
http://www.isd.kcl.ac.uk/pet-mri/simulated-data/.
Conflict of Interest statement
The authors declare that they have no conflict of interest.
REFERENCES
[1] Zaidi H, Tsui BMW. Review of computational anthropomorphic anatomical and physiological models. Proceedings of the IEEE. 2009;97:1938-53.
[2] Shepp LA, Logan BF. The Fourier reconstruction of a head section. IEEE Trans Nucl Sci. 1974;21:21-43.
[3] Segars WP, Lalush DS, Tsui BMW. Modeling respiratory mechanics in the MCAT and spline-based MCAT phantoms. IEEE Trans Nucl Sci. 2001;48:89-97.
[4] Tsoumpas C, Gaitanis A. Modeling and Simulation of 4D PET-CT and PET-MR Images. PET Clinics. 2013;8:95-110. [5] Zubal IG, Harrell CR, Smith EO, Rattner Z, Gindi G, Hoffer PB. Computerized three-dimensional segmented human anatomy. Med Phys. 1994;21:299-302.
[6] Hoffman EJ, Cutler PD, Digby WM, Mazziotta JC. 3-D phantom to simulate cerebral blood flow and metabolic images for PET. IEEE Trans Nucl Sci. 1990;37:616-20.
[7] Xu XG, Chao TC, Bozkurt A. VIP-Man: an image-based whole-body adult male model constructed from color photographs of the Visible Human Project for multi-particle Monte Carlo calculations. Health Phys. 2000;78:476-86.
[8] Dimbylow P. Development of the female voxel phantom, NAOMI, and its application to calculations of induced current densities and electric fields from applied low frequency magnetic and electric fields. Phys Med Biol. 2005;50:1047-70. [9] Nipper JC, Williams JL, Bolch WE. Creation of two tomographic voxel models of paediatric patients in the first year of life. Phys Med Biol. 2002;47:3143-64.
[10] Segars WP, Tsui BMW. MCAT to XCAT: The evolution of 4D computerized phantoms for imaging research. Proceedings of the IEEE. 2009;97:1954-68.
Acce
pt
ed
Ma
nu
scri
pt
[12] Segars WP, Mori S, Chen GTY, Tsui BMW. Modeling respiratory motion variations in the 4D NCAT phantom. Conference Record IEEE Nuclear Science Symposium. 2007; p. 2677-9.[13] Segars WP, Sturgeon G, Mendonca S, Grimes J, Tsui BM. 4D XCAT phantom for multimodality imaging research. Med Phys. 2010;37:4902-15.
[14] Konik A, Connolly CM, Johnson KL, Dasari P, Segars P, Hendrik Pretorius P, et al. Digital anthropomorphic phantoms of non-rigid human respiratory and voluntary body motions: A tool-set for investigating motion correction in 3D reconstruction. IEEE Nuclear Science Symposium and Medical Imaging Conference (NSS/MIC), 2011. p. 3572-8.
[15] Tsoumpas C, Buerger C, King AP, Mollet P, Keereman V, Vandenberghe S, et al. Fast generation of 4D PET-MR data from real dynamic MR acquisitions. Phys Med Biol. 2011;56:6597Ð613.
[16] Aboagye EO. Imaging in drug development. Clin Adv Hematol Oncol. 2006;4:902-4.
[17] Takesh M. The Potential Benefit by Application of Kinetic Analysis of PET in the Clinical Oncology. ISRN oncology. 2012;2012:349351.
[18] Reader AJ, Matthews JC, Sureau FC, Comtat C, Trebossen R, Buvat I. Iterative Kinetic Parameter Estimation within Fully 4D PET Image Reconstruction. Conference Record IEEE Nuclear Science Symposium, 2006. p. 1752-6.
[19] Tong S, Alessio AM, Kinahan PE, Liu H, Shi P. A robust state-space kinetics-guided framework for dynamic PET image reconstruction. Phys Med Biol. 2011;56:2481-98.
[20] Verhaeghe J, D'Asseler Y, Vandenberghe S, Staelens S, Van De Walle R, Lemahieu I. ML reconstruction from dynamic list-mode PET data using temporal splines. Conference Record IEEE Nuclear Science Symposium, 2004. Vol. 5, p. 3146-50. [21] Wernick MN, Infusino EJ, Milosevic M. Fast spatio-temporal image reconstruction for dynamic PET. IEEE Trans Med Imaging. 1999;18:185-95.
[22] Li Q, Asma E, Ahn S, Leahy RM. A fast fully 4-D incremental gradient reconstruction algorithm for list mode PET data. IEEE Trans Med Imaging. 2007;26:58-67.
[23] Fung GSK, Higuchi T, Park MJ, Segars WP, Tsui BMW. Development of a 4D digital phantom for tracer kinetic modeling and analysis of dynamic perfusion PET and SPECT simulation studies. IEEE Nuclear Science Symposium and Medical Imaging Conference (NSS/MIC), 2011. p. 4192-5.
[24] Tsoumpas C, Polycarpou I, Thielemans K, Buerger C, King AP, Schaeffter T, et al. The effect of regularization in motion compensated PET image reconstruction: a realistic numerical 4D simulation study. Phys Med Biol. 2013;58:1759-73.
[25] Buerger C, Tsoumpas C, Aitken A, King AP, Schleyer P, Schulz V, et al. Investigation of MR-Based Attenuation Correction and Motion Compensation for Hybrid PET/MR. IEEE Trans Nucl Sc. 2012;59:1967-76.
[26] Renkin EM. Transport of potassium-42 from blood to tissue in isolated mammalian skeletal muscles. Am J Physiol. 1959;197:1205-10.
[27] Crone C. The permeability of capillaries in various organs as determined by use of the indicator diffusion method. Acta Physiol Scand. 1963;58:292-305.
Acce
pt
ed
Ma
nu
scri
pt
[29] Kudomi N, Slimani L, Jarvisalo MJ, Kiss J, Lautamaki R, Naum GA, et al. Non-invasive estimation of hepatic blood perfusion from H2 15O PET images using tissue-derived arterial and portal input functions. Eur J Nucl Med Mol Imaging. 2008;35:1899-911.[30] Ludemann L, Sreenivasa G, Michel R, Rosner C, Plotkin M, Felix R, et al. Corrections of arterial input function for dynamic H215O PET to assess perfusion of pelvic tumours: arterial blood sampling versus image extraction. Phys Med Biol. 2006;51:2883-900.
[31] Peters J, Ecabert O, Meyer C, Kneser R, Weese J. Optimizing boundary detection via Simulated Search with applications to multi-modal heart segmentation. Med Imag Anal. 2010;14:70-84.
[32] Lodge MA, Carson RE, Carrasquillo JA, Whatley M, Libutti SK, Bacharach SL. Parametric images of blood flow in oncology PET studies using [15O]water. J Nucl Med. 2000;41:1784-92.
[33] Wienhard K. Measurement of glucose consumption using [(18)F]fluorodeoxyglucose. Methods 2002;27:218-25.
[34] Buerger C, Schaeffter T, King AP. Hierarchical adaptive local affine registration for fast and robust respiratory motion estimation. Med Imag Anal. 2011;15:551-64.
[35] Brambilla M, Secco C, Dominietto M, Matheoud R, Sacchetti G, Inglese E. Performance characteristics obtained for a new 3-dimensional lutetium oxyorthosilicate-based whole-body PET/CT scanner with the National Electrical Manufacturers Association NU 2-2001 standard. J Nucl Med. 2005;46:2083-91.
[36] Kotasidis FA, Matthews JC, Angelis GI, Noonan PJ, Jackson A, Price P, et al. Single scan parameterization of space-variant point spread functions in image space via a printed array: the impact for two PET/CT scanners. Phys Med Biol. 2011;56:2917-42. [37] Dagan F, Huang SC, ZhiZhong W, Dino H. An unbiased parametric imaging algorithm for nonuniformly sampled biomedical system parameter estimation. IEEE Trans Med Imaging. 1996;15:512-8.
[38] Feng D, Ho D, Lau KK, Siu WC. GLLS for optimally sampled continuous dynamic system modeling: theory and algorithm. Comput Methods Programs Biomed. 1999;59:31-43.
[39] Stute S, Vauclin S, Necib H, Grotus N, Tylski P, Rehfeld NS, et al. Realistic and Efficient Modeling of Radiotracer Heterogeneity in Monte Carlo Simulations of PET Images With Tumors. IEEE Trans Nucl Sci. 2012;59:113-22.
[40] Zaidi H, Ojha N, Morich M, Griesmer J, Hu Z, Maniawski P, et al. Design and performance evaluation of a whole-body Ingenuity TF PET-MRI system. Phys Med Biol. 2011;56:3091-106.
[41] Karakatsanis NA, Lodge MA, Yun Z, Mhlanga J, Chaudhry MA, Tahari AK, et al. Dynamic multi-bed FDG PET imaging: Feasibility and optimization. IEEE Nuclear Science Symposium and Medical Imaging Conference (NSS/MIC) 2011. p. 3863-70. [42] Ingrisch M, Sourbron S. Tracer-kinetic modeling of dynamic contrast-enhanced MRI and CT: a primer. J Pharmacokinet Pharmacodyn. 2013;40:281-300.
Acce
pt
ed
Ma
nu
scri
pt
List of Tables
TABLE I
SIMULATED KINETIC PARAMETER FOR THE SINGLE-TISSUE MODEL
K1
ml/s/ml
k2
ml/s/ml
Bv ml/ml
VT ml/ml
Lungs 0.0008 0.0014 0.06 0.6
Bone 0.0018 0.0027 0.00 0.69
Soft tissue 0.0005 0.0042 0.00 0.12 Ventricles 0.0000 0.0000 1.00 0.00 Myocardium 0.0167 0.0183 0.15 0.91
Tumors 0.0098 0.0161 0.08 0.61
Liver 0.0117 0.0119 0.05 0.98
TABLE II
SIMULATED KINETIC PARAMETER FOR THE TWO-TISSUE MODEL
K1
ml/s/ml k2
ml/s/ml k3
ml/s/ml Bv ml/ml
Ki
Acce
pt
ed
Ma
nu
scri
pt
List of Figures
[image:26.612.197.509.136.367.2]Fig. 1. Schematic diagram of a single-tissue (top) and a two-tissue (bottom) kinetic models showing the different compartments as well as the constant rate controlling the rate of change in activity concentration for each compartment.
[image:26.612.128.385.402.619.2]Acce
pt
ed
Ma
nu
scri
pt
0 50 100 150 200 250 300 350
0 5 10 15 20 25 Time (sec) Ac ti vit y lung bone torso ventricles myocardium tumours liver
0 50 100 150 200 250 300 350
0 5 10 15 20 25 Time (sec) Ac ti vit y lung bone torso ventricles myocardium tumours liver
0 500 1000 1500 2000 2500 3000
0 2 4 6 8 10 12 Time (sec) Ac ti vit y lung bone torso ventricles myocardium tumours liver
0 50 100 150 200 250 300 350
0 5 10 15 20 25 30 Time (sec) A ctiv it y
Delay = 0 sec
Dispersion coeff icient = 0.1 Delay = -8 sec
Dispersion coeff icient = 0.09 Delay = -16 sec
Dispersion coeff icient = 0.08 Fig. 3. Transverse (a), coronal (b) and sagittal (c) images of the simulated attenuation map corresponding to a single gate.
(a) (b)
[image:27.612.77.535.87.698.2]Acce
pt
ed
Ma
nu
scri
[image:28.612.105.521.126.416.2]pt
Fig. 4. Simulated TACs representing (a) [15O]H2O and (b) [18F]FDG kinetics, used for the different regions of interest in the 3D
anatomical phantom. Input functions with differential delay and dispersion in different organs can be used while organ TACs having a dual input function delivery can also be simulated. The simulated [15O]H2O TACs from (a) are shown in (c) using a
dual input model in the liver, while 3 input functions from a [15O]H
2O scan with different delay and dispersion are shown in (d).
(a)
(b)
(i)
(ii)
(iii)
(iv)
(c)
(d)
Fig. 5. Transverse (a), coronal (b), sagittal (c) and 3D rendered (d) simulated images of the [15O]H
2O phantom at 2 different time
points during the simulated dynamic [15O]H
2O image sequence corresponding to an early time frame (i-ii) (t = t0 +20 s) and a
late time frame (iii-iv) (t = t0 +360 s) where t0 is the reference start time. Images are shown for a single respiratory gate
Acce
pt
ed
Ma
nu
scri
pt
(a)
(b)
(i)
(ii)
(iii)
(iv)
(c)
(d)
Fig. 6. Transverse (a), coronal (b), sagittal (c) and 3D rendered (d) simulated images of the [18F]FDG phantom at 2 different
time points during the simulated dynamic [18F]FDG image sequence corresponding to an early time frame (i-ii) (t = t
0 +40 s) and
a late time frame (iii-iv) (t = t0 +3400 s) where t0 is the reference start time. Images are shown for a single respiratory gate
corresponding to motionless data (i, iii) and for all gates superimposed and corresponding to motion affected data (ii, iv).
[image:29.612.103.531.91.380.2] [image:29.612.127.421.429.596.2]Acce
pt
ed
Ma
nu
scri
pt
(a)
(b)
(i)
(ii)
(iii)
(iv)
(c)
(d)
Fig. 8. Transverse (a), coronal (b), sagittal (c) and 3D rendered (d) reconstructed [15O]H
2O (i-ii) and [18F]FDG (iii-iv) emission
images at 2 different time points corresponding to an early time frame (i, iii) and a late time frame (ii,iv) where t0 is the reference
[image:30.612.103.530.91.384.2] [image:30.612.129.431.428.677.2]Acce
pt
ed
Ma
nu
scri
pt
Fig. 10. Parametric images of K1, k2,k3, bv and Ki, (a) simulated and (b) estimated (using GLLS), following 3D reconstruction of the simulated single gate dynamic [18F]FDG phantom dataset. Rendered images of the estimated maps are also shown in (c).
Fig. 11 Profiles through (a) the volume of distribution (VT) and (b) net uptake rate (Ki) parametric images, obtained from the
dynamic [15O]H2O and [18F]FDG datasets respectively. Profiles are shown for the simulated and the estimated parameters
following post-reconstruction kinetic analysis.
[image:31.612.179.512.87.368.2] [image:31.612.129.433.401.564.2]Acce
pt
ed
Ma
nu
scri
pt
- Dynamic image acquisition protocols are increasingly used in emission tomography
- Need for computational phantoms to describe both the spatial and temporal distribution of radiotracers.
- A 5D anthropomorphic phantom was developed, for parametric imaging simulations in emission tomography.
- The phantom is based on real 4D MR data and a detailed multi-compartmental pharmacokinetic modelling
simulator.


![Fig. 8Accepted Manuscriptsimulated single gate dynamic [. Parametric images of K1, k2, bv and VT (a) simulated and (b) estimated (using GLLS) following 3D reconstruction of the 15O]H2O phantom dataset](https://thumb-us.123doks.com/thumbv2/123dok_us/7943830.196086/18.612.100.509.85.294/accepted-manuscriptsimulated-parametric-simulated-estimated-following-reconstruction-phantom.webp)
![Fig. 10Accepted Manuscriptdynamic [ Profiles through (a) the volume of distribution (VT) and (b) net uptake rate (Ki) parametric images, obtained from the 15O]H2O and [18F]FDG datasets respectively](https://thumb-us.123doks.com/thumbv2/123dok_us/7943830.196086/19.612.101.511.84.283/accepted-manuscriptdynamic-profiles-distribution-parametric-obtained-datasets-respectively.webp)

