Int. J. Electrochem. Sci., 10 (2015) 1843 - 1854
International Journal of
ELECTROCHEMICAL
SCIENCE
www.electrochemsci.org
Effect of Exposure Period and Temperature on the Corrosion of
Incoloy
®Alloy 800™ in Hydrochloric Acid Pickling Solutions
El-Sayed M. Sherif1,2,* and Asiful H. Seikh1
1
Center of Excellence for Research in Engineering Materials (CEREM), Advanced Manufacturing Institute (AMI), King Saud University, P.O. Box - 800, Riyadh 11421, Saudi Arabia
2
Electrochemistry and Corrosion Laboratory, Department of Physical Chemistry, National Research Centre (NRC), Dokki, 12622 Cairo, Egypt
*
E-mail: esherif@ksu.edu.sa; emsherif@gmail.com
Received: 22 November 2014 / Accepted: 19 December 2014 / Published: 30 December 2014
The corrosion of Incoloy® alloy 800TM (Ni32.5/Cr21/Fe) in 1.0 M HCl pickling solutions after varied exposure periods, namely, 0.5 h, 2.0 h, 4.0 h, and 24 h were reported. The work was also extended to include the corrosion of the alloy at 20 ºC, 30 ºC, 40 ºC, 50 ºC, and 60 ºC after 0.5 h immersion in the acid solution. The electrochemical impedance spectroscopy (EIS) measurements showed that the corrosion of Incoloy decreases when the exposure period increases and the highest surface and polarization resistances were recorded for the electrode after 24 h immersion. On the other hand, the increase of the temperature of the solution was found to highly increase the corrosion as a result of decreasing the resistance of the alloy under the increased corrosivity of the acidsolution. The cyclic potentiodynamic polarization (CPP) measurements confirmed the EIS ones that the increase of immersion time decreases corrosion, while the increase of temperature pronouncedly increases it for the Incoloy in HCl solutions. This is because elongating the time of immersion leads to decreasing the values of jCorr and RCorr but rising the temperature greatly increases them. CPP curves also indicated
that the Incoloy dissolves in 1.0 M HCl solution as a result of the occurrence of the uniform corrosion.
Keywords: acidic pickling solutions; exposure period; Incoloy® alloy 800; impedance spectroscopy; polarization
1. INTRODUCTION
Incoloy® alloy 800TM
Incoloy 800H and Incoloy 800HT, were developed to control the carbon content and grain size to optimize stress rupture properties. The three nickel steel alloys are identical in composition except for the higher level of carbon in alloy 800H, and the addition of up to 1.20 percent aluminum and titanium in alloy 800HT [2].
The high nickel content in Incoloy 800 makes the alloy highly resistant to both chloride stress-corrosion cracking and to embrittlement from precipitation of sigma phase, as well as, excellent corrosion resistance [3]. The chromium and nickel contents of the alloy give excellent oxidation resistance, good resistance to carburization and resistance to sulpidation at low concentrations of oxidizing and reducing sulphur. Furthermore, the chemical balance allows this alloy to exhibit excellent resistance to oxidation, carburization, and nitriding atmospheres [1,4]. Incoloy 800 is widely used in equipment that must have high strength and resistance to oxidation, carburization and other harmful effects of high temperature exposure (below 1200° F). The alloy is typically designed for use in chemical, petrochemical and food processing, for nuclear engineering and for the sheathing of electrical heating elements [5].
We have been studying surface properties of metals and alloys, their corrosion reactions, and effects of organic additives on its corrosion inhibition [6-10] in different media. In the earlier work [6], the corrosion of iron and API X-65 pipeline steel in 4.0% NaCl solution has been reported. In another study, the corrosion and corrosion inhibition of high strength low alloy steel in 2.0 H2SO4 acidic
pickling solutions using 3-amino-1,2,3-triazole as a corrosion inhibitor have been investigated [9]. More recently [10], the electrochemical corrosion behavior of API X-70 5L grade steel in 4.0 wt. % sodium chloride solutions after different immersion periods of time was studied using different electrochemical and spectroscopic techniques. In this work, we aimed at investigating the corrosion of Incoloy® alloy 800TM
after 0.5, 2.0, 4.0, and 24 h immersion in 1.0 M HCl pickling solutions. The objective was also to report the effect of the increased temperatures, namely 20, 30, 40, 50, and 60 ºC on the corrosion of the alloy after its immersion for 0.5 h in the acid solution. The study was performed using different electrochemical tests, i.e., OCP, CPP, and EIS measurements.
2. EXPERIMENTAL PROCEDURES
An Autolab Potentiostat (PGSTAT20 computer controlled) operated by the general purpose electrochemical software (GPES) version 4.9 was used to perform the electrochemical experiments. The open-circuit potential measurements were carried out for 24 h at room temperature. The electrochemical impedance spectroscopy (EIS) tests were performed at corrosion potentials over a frequency range of 100 kHz to 100 mHz, with an ac wave of 5 mV peak-to-peak overlaid on a dc bias potential, and the impedance data were collected using Powersine software at a rate of 10 points per decade change in frequency.
Cyclic potentiodynamic polarization (CPP) curves were obtained by scanning the potential in the forward direction from -0.80 V to 0.4 V vs. Ag/AgCl at a scan rate of 0.001 V/s. The potential was scanned again in the backward direction at the scan rate till the end of the run. Each experiment was carried out using fresh steel surface and new portion of the hydrochloric acid solution. All EIS and CPP experiments were carried out after different immersion periods and different solution temperatures.
3. RESULTS AND DISCUSSION
[image:3.596.125.467.447.608.2]3.1. Open-circuit potential (OCP) measurements
Fig. 1 shows the change of the OCP with time over 24 h exposure for the Incoloy electrode in 1.0 M HCl solution at room temperature.
0 4 8 12 16 20 24
-260 -240 -220 -200
E
/
m
V
(
A
g
/A
g
C
l)
t / h
Figure 1. The change of the open-circuit potential with time curve obtained for Incoloy electrode in 1.0 M HCl solutions at room temperature.
potential then slightly shifted towards the less negative value with increasing the time of the experiment to reach almost -0.222 V at the end of the run. The change of potential with time thus indicates that the Incoloy dissolves in the acid solution upon it immersion, while increasing the immersion time decreases this dissolution via the formation of a corrosion product layer on the surface of the electrode.
3.2. Electrochemical impedance spectroscopy (EIS) measurements
EIS is a powerful method that has been successfully used to understand the mechanism of corrosion and corrosion protection of metals and alloys in aggressive media [11-15]. In this work, the EIS technique was employed to report the kinetic parameters obtained from studying the corrosion of Incoloy® 800 after different exposure periods of time as well as different temperatures in 1.0 M HCl solutions.
0 500 1000 1500 2000 2500
0 250 500 750 1000 1250
(b)
(a)
4
3
-Z
"
/
cm
2
-Z' / cm2
1
2
4
3
1
2
10-2 10-1 100 101 102 103 104 105 0
20 40 60 80 100
P
h
a
se
A
n
g
le
/
D
e
g
.
[image:4.596.123.472.309.681.2]Frequency / Hz
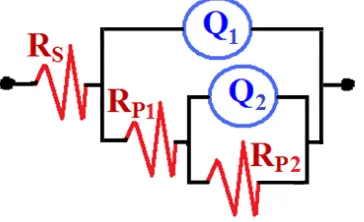
Fig. 2 shows (a) typical Nyquist and (b) Bode phase angle plots obtained for Incoloy electrode after (1) 0.5 h, (2) 2.0 h, (3) 4 h, and (4) 24 h immersion in 1.0 M HCl solutions at room temperature. The spectra represented in Fig. 2 were analyzed by best fitting to the equivalent circuit model shown in Fig. 3. The EIS parameters obtained by fitting the equivalent circuit shown in Fig. 3 are listed in Table 1. The parameters of the equivalent circuit model can be defined according to the usual convention as follows; RS represents the solution resistance between the Incoloy surface and the counter (platinum)
electrode, Q1 represents the first constant phase elements (CPEs), Rp1 is the polarization resistance of a
film layer formed on the surface of the Incoloy electrode and can be also considered as the charge transfer resistance, Q2 is the second constant phase elements, and Rp2 accounts for the polarization
resistance of the oxide and/or corrosion product layer formed on the Incoloy surface.
Figure 3. The equivalent circuit model used to the fit the experimental data obtained by EIS measurements; the symbols of the equivalent circuit are defined in the text and their values are listed in Table 1 and Table 2.
It is seen from the Nyquist plots of Fig. 2(a) that the Incoloy electrode showed only one semicircle whose diameter gets wider with increasing the immersion time from 0.5 h to 2.0 h, 4.0 h and further to 24 h before measurements; wider diameter of the semicircle reflects on a better corrosion resistance [11-14]. The effect of increasing the immersion time was also found to increase the maximum degree of the phase angle shown in Fig. 2(b). Here, EIS behavior indicates that the increase of immersion time decreases the corrosion of Incoloy in HCl solutions. This is because the Incoloy® 800 suffers uniform corrosion, which is characterized by its higher rates in short exposure periods then slows down with increasing the immersion time due to the formation of corrosion product layers on the metal surface that block or isolate it from being further attacked by the surrounding environment. This was further confirmed by the parameters listed in Table 1, where the increase of immersion periods increased the values of all obtained resistances, i.e. RS, Rp1 and Rp2. The first
constant phase elements (Q1, CPEs) with its n values exactly 1.0 for all samples represent double layer
capacitors [6,9,10]. This is because and depending on the value of n, CPE can represent capacitance (Z(CPE) = Cdl, n = 1), Warburg impedance for (n = 0.5), or resistance (Z(CPE) = R, n = 0). Hence, the CPE for the Incoloy electrode is substituted for a capacitor to fit the semicircle more exactly [9]. The impedance of CPE in the case of Incoloy electrode in the hydrochloric acid, 1.0 M HCl, solutions can be expressed as following;
[image:5.596.209.391.263.374.2]
Where, Y0 is the magnitude of CPE, n is the exponent (phase shift), ω is the angular frequency
and j is the imaginary unit. The values of the CPEs decrease with increasing time. Also, the second constant phase elements, Q2, with their n value was 0.84 for 0.5 h that increased to 0.92 for the
[image:6.596.69.533.258.399.2]electrode after 24 h immersion, which means that the CPEs here represent double layer capacitors with some pores; these pores were to cover the charged Incoloy surfaces under the corrosive attack of the acid solution [9]. The values of the CPEs also decreased with increasing the immersion time, which confirms the fact that the corrosion of Incoloy® alloy 800 in 1.0 M HCl solutions decreases with time.
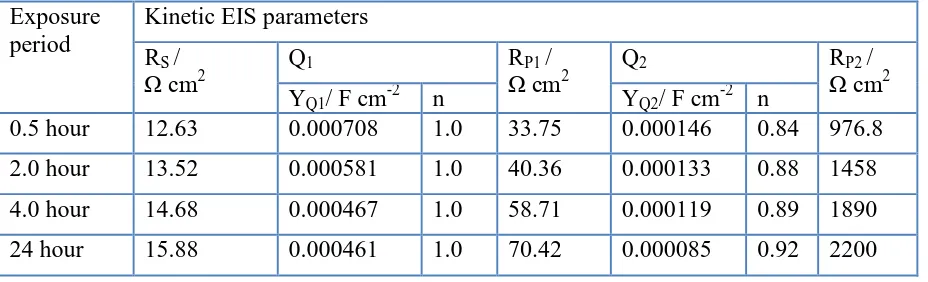
Table 1. Parameters obtained by fitting the EIS data shown in Fig. 2 with the equivalent circuit shown in Fig. 3 for the Incoloy in 1.0 M HCl solutions after different immersion periods of time. Exposure
period
Kinetic EIS parameters RS /
Ω cm2 Q1 RΩ cmP1 / 2 Q2 RΩ cmP2 / 2
YQ1/ F cm-2 n YQ2/ F cm-2 n
0.5 hour 12.63 0.000708 1.0 33.75 0.000146 0.84 976.8
2.0 hour 13.52 0.000581 1.0 40.36 0.000133 0.88 1458
4.0 hour 14.68 0.000467 1.0 58.71 0.000119 0.89 1890
24 hour 15.88 0.000461 1.0 70.42 0.000085 0.92 2200
In order to study the effect of temperature on the corrosion of Incoloy® alloy 800 in the hydrochloric acid solution, the EIS measurements were performed after 0.5 h immersion at different temperatures of the HCl solutions. Fig. 4 shows (a) Typical Nyquist and (b) Bode phase angle plots obtained for the Incoloy after 30 min immersion in 1.0 M HCl solutions at (1) 20 ºC, (2) 30 ºC, (3) 40
º
C, (4) 50 ºC and (5) 60 ºC, respectively. The data presented in Fig. 4 were best fitted to the same equivalent circuit shown in Fig. 3 and the values of the parameters of the circuit are listed in Table 2. The parameters of the equivalent circuit were defined as mentioned earlier. It is clearly seen from Fig. 4(a) that the Nyquist spectra show only one semicircle at all temperatures. The increase of the temperature of the hydrochloric acid solution led to decreasing the diameter of the semicircle, which indicates that the raise of temperature increases the corrosion of the Incoloy in the acid solution. Fig. 4(b) also shows that the increase of the temperature decreased the maximum degree of the phase angle. The Nyquist and Bode plots thus reveal that the increase of the temperature increased the corrosion of the Incoloy.
Table 2 shows that the increase of the solution temperature from 20 ºC to 60 ºC decreased the values of the resistances RS, Rp1 and Rp2, increased the values of Q1 and Q2. The decrease of the
0 200 400 600 800 1000 1200 1400
0 200 400 600
(b)
(a)
4
5
3
-Z
"
/
c
m
2
-Z' /
cm
21
2
5
3
1
2
10-2 10-1 100 101 102 103 104 105
-20 0 20 40 60 80
P
h
a
se
A
n
g
le
/
D
e
g
.
Frequency / Hz
Figure 4. (a) Typical Nyquist and (b) Bode phase angle plots obtained for the Incoloy after 30 min immersion in 1.0 M HCl solutions at (1) 20 ºC, (2) 30 ºC, (3) 40 ºC, (4) 50 ºC and (5) 60 ºC, respectively.
The values of the first CPEs, Q1, with their n values are almost 1.0 represent double layer
capacitors (Cdl). As well as, the values of the second CPEs, Q2, with their n values equal or close to
unity and also represent double layer capacitors but with some porosity. The increase of the values of these CPEs also confirms that the corrosion of the Incoloy increased with increasing the temperature of the acid solution.
Table 2. Parameters obtained by fitting the EIS data presented in Fig. 4 with the equivalent circuit shown in Fig. 3 for the Incoloy in 1.0 M HCl solutions after different temperatures.
Temperature Kinetic EIS parameters RS /
Ω cm2
Q1 RP1 /
Ω cm2
Q2 RP2 /
Ω cm2
YQ1/ F cm-2 n YQ2/ F cm-2 n
20 ºC 12.63 0.000708 1.0 33.75 0.000146 0.84 976.8
30 ºC 11.77 0.000881 0.96 28.65 0.000161 1.0 730.6
40 ºC 10.39 0.001324 1.0 22.33 0.000190 0.96 532.0
50 ºC 9.66 0.002133 1.0 18.28 0.001143 0.86 391.4
[image:7.596.130.463.79.434.2]
3.2. Cyclic potentiodynamic polarization (CPP) measurements
CPP method is one of the most used techniques in understanding the uniform and localized corrosion in harsh environments. In order to study the effect of immersion time on the corrosion behavior of the Incoloy® 800, the CPP curves were obtained after (a) 0.5 h, (b) 2.0 h, (c) 4.0 h, and (d) 24 h of immersion in 1.0 M HClsolutions at room temperature as shown respectively in Fig. 5. The polarization parameters obtained from the curves shown in Fig. 5 are listed in Table 3.
-0.8 -0.6 -0.4 -0.2 0.0 0.2 0.4
100
101
102
103
104
105
j
/
A
c
m
-2
(a)
-0.8 -0.6 -0.4 -0.2 0.0 0.2 0.4
100
101
102
103
104
105
(d) (c)
(b)
-0.8 -0.6 -0.4 -0.2 0.0 0.2 0.4
100
101
102
103
104
105
j
/
A
c
m
-2
E / V (Ag/AgCl)
-0.8 -0.6 -0.4 -0.2 0.0 0.2 0.4
10-2
10-1
100
101
102
103
104
105
[image:8.596.82.502.207.512.2]E / V (Ag/AgCl)
Figure 5. Cyclic potentiodynamic polarization curves obtained for Incoloy electrode after (a) 0.5 h, (b) 2.0 h, (c) 4 h, and (d) 24 h immersion in 1.0 M HCl solutions at room temperature.
These parameters include the values of cathodic Tafel slope (βc), corrosion potential (ECorr),
corrosion current densities (jCorr), anodic Tafel slope (βa), polarization resistance (Rp), and corrosion
rate (RCorr). The values of βc and βa were determined according to our previous study [16,17]. The
values of the jCorr and ECorr were obtained from the extrapolation of anodic and cathodic Tafel lines
located next to the linearized current regions. From the slope analysis of the linear polarization curves in the vicinity of ECorr, the values of Rp in the acid solution were obtained [18]. Also, the values of
RCorr (mills per year, mpy) were calculated using the equation [19]:
Where, k is a constant that defines the units for the corrosion rate (k = 3272), EW the equivalent
7.95), and A the area of electrode in cm2. It is well known that the cathodic reaction of metals and alloys in acidic solutions is the evolution of hydrogen according to the following equation;
2H+ + 2e– = H2 (3)
On the other side, the anodic reaction that consumes the produced electrons from the cathodic reaction for the Incoloy is the dissolution of iron, which is the base metal in the alloy, as fellows [20];
Fe = Fe2+ + 2e– (4)
It is clearly seen from Fig. 5 that the anodic branch of the Incoloy shows an active-passive behavior for all immersion periods of time. The active region is defined by the rapid increases of current with increasing the potential in the first 100 mV from the OCP value. The increase of current here was due to the corrosion of the Incoloy through the dissolution of the iron presented in the alloy into ferrous cations, Fe2+, as depicted in equation (4). Also, The produced Fe2+ further oxidized to ferric cations, Fe3+, under the influence of the corrosive attack of the hydrochloric acid solution and with increasing the applied potential in the less negative direction as follows;
Fe2+ = Fe3+ + e– (5)
On the other hand, the passive region is noticed just after the active one, where the current stays steady and then decreases, which is due to the formation of an oxide film or as a result of the enrichment for the percent of Cr on the alloy surface and makes it more passivated [18,21,22]. The parameters shown in Table 3 indicate that increasing the exposure period of time shifted the ECorr
toward the less negative values and decreased the corrosion of the Incoloy through increasing the values of jCorr and RCorr as well as increasing the corresponding Rp values. It is worth to mention also
that the CPP behavior for all immersion periods of time did not show any pitting corrosion takes place for the Incoloy in 1.0 M HCl solution. Where, the values of the current in the backward recorded almost the same values in the forward direction at the more positive potential values. Further increment in the backward potential values toward the more negative direction provided lower current values compared to the currents recorded in the forward direction. This confirms that the Incoloy did not suffer pitting attack but only uniform corrosion that decreases with increasing its exposure period in 1.0 M HCl solutions from 5.0 h to 2.0 h and further to 4.0 h and the lowest jCorr and RCorr with the
highest Rp values were recorded for the electrode after 24 h immersion before measurement.
Table 3. Corrosion parameters obtained from the potentiodynamic polarization measurements for the Incoloy electrode that was immersed for different periods of time in 1.0 M HCl solutions. Exposure period Parameter
βc
Vdec-1
ECorr
V
jCorr
µA cm-2
βa
Vdec-1
Rp
Ω cm2
RCorr
mmy-1
0.5 hour 0.090 -0.285 20 0.078 908 0.20
2.0 hour 0.095 -0.280 17 0.078 1095 0.17
4.0 hour 0.105 -0.275 12 0.073 1560 0.12
-0.8 -0.6 -0.4 -0.2 0.0 0.2 0.4
100 101 102 103 104 105 (c) (d) (b) (a) j / A c m -2
-0.8 -0.6 -0.4 -0.2 0.0 0.2 0.4
10-1 100 101 102 103 104 105
-0.8 -0.6 -0.4 -0.2 0.0 0.2 0.4
10-1 100 101 102 103 104 105 j / A c m -2
E / V (Ag/AgCl)
-0.8 -0.6 -0.4 -0.2 0.0 0.2 0.4
10-1 100 101 102 103 104 105
[image:10.596.79.507.81.375.2]E / V (Ag/AgCl)
Figure 6. Potentiodynamic polarization curves obtained for Incoloy electrode that was immersed in 1.0 M HCl solutions for 5.0 h at (a) 30 ºC, (b) 40 ºC, (c) 50 ºC, and (d) 60 ºC, respectively.
Table 4. Parameters obtained from the potentiodynamic polarization measurements shown in Fig. 6 for the Incoloy electrode in 1.0 M HCl solutions at different temperatures.
Temperature Parameter βc
Vdec-1
ECorr
V
jCorr
µA cm-2 βa
Vdec-1
Rp
Ω cm2
RCorr
mmy-1
20 ºC 0.090 -285 20 0.078 908 0.20
30 ºC 0.083 -0.275 23 0.070 718 0.23
40 ºC 0.080 -0.270 26 0.060 573 0.26
50 ºC 0.080 -0.268 30 0.058 487 0.30
60 ºC 0.085 -0.265 60 0.055 242 0.60
[image:10.596.78.520.496.668.2]
mentioned for the Incoloy after different exposure periods of time. The CPP measurements shown in Fig. 6 indicate that the increase of temperature increased the active region and decreased the passive region, where the passive region almost disappeared at 60 ºC, Fig. 6(d). This effect increased the corrosion of the Incoloy in 1.0 M HCl also by the significant increase in the values of jCorr and RCorr,
which reflects on decreasing the values of Rp as can be seen from Table 4. The CPP results thus agree with the data obtained from the EIS measurements that the corrosion of Incoloy® 800 increases with increasing the time of immersion as well as with the increase of the acid temperature.
4. CONCLUSIONS
The effects of immersion time and solution temperature on the corrosion of Incoloy® alloy 800 (Ni32.5/Cr21/Fe) in 1.0 M HCl pickling solutions were reported. The study was carried out by using open-circuit potential, electrochemical impedance spectroscopy (EIS) and cyclic potentiodynamic polarization (CPP) measurements. EIS measurements indicated that increasing the immersion time was found to decrease the corrosion of the Incoloy alloy in 1.0 M HCl solutions due to increasing the polarization resistance with time. CPP results revealed that the increase of immersion time shifted the values of ECorr for the alloy towards the less negative direction, decreased the values of jCorr and RCorr
as well as increased the values of Rp. It has been also found that the increase of temperature of the hydrochloric acid solution remarkably increased the corrosion of the Incoloy alloy due to the decrease of the polarization resistance and the increase of its cathodic and anodic currents, jCorr and RCorr.
Results together confirmed that the increase of exposure period of time decreased the corrosion of the Incoloy® alloy 800, while the increase of the temperature of the HCl solution increases that corrosion.
ACKNOWLEDGEMENTS
This project was supported by NSTIP strategic technologies program number (11-ADV1853-02) in the
Kingdom of Saudi Arabia.
References
1. Special Metals Corporation, Publication No. SMC-046, Sept 04 (2004), www.specialmetals.com. 2. E. A. Polman, T. Fransen, and P. J. Gellings, Oxidation of Metals, 33, No. 1/2 (1990) 135.
3. The International Nickel Company Inc. The chromium and nickel contents of the alloy give excellent oxidation resistance, good resistance to carburisation and resistance to sulphidation at low concentrations of oxidising and reducing sulphur, Inco-Sterling Forest, Suffern, NY (1983). 4. H. H. Uhlig and R. W. Revie, Corrosion and Corrosion Control (3rd ed.), Wily-Interscience, New
York, 1985.
5. R. Kilian, N. Wieling and L. Stieding, Mater. Corros. 42 (1991) 490. 6. El-Sayed M. Sherif, Molecules, 19 (2014) 9962.
7. D. Gopi, El-Sayed M. Sherif, D. Rajeswari, L. Kavitha, R. Pramod, Jishnu Dwivedi, S.R. Polaki, J. Alloys and Compounds, 616 (2014) 498.
8. F.H. Latief , K. Kakehi, and El-Sayed M. Sherif, Prog. Nat. Sci.: Mater. Int., 24 (2014) 163. 9. El-Sayed M. Sherif, Adel Taha Abbas, D. Gopi, and A.M. El-Shamy, J. Chem., 2014 (2014) Article
10.El-Sayed M. Sherif and A.A. Almajid, Int. J. Electrochem. Sci., 10, (2015) 34. 11.J.R. Macdonald, Impedance Spectroscopy, Wiley & Sons, New York, 1987.
12.Byoung-Yong Chang, Su-Moon Park, Annual Review of Analytical Chemistry, 13 (2010) 207. 13.El-Sayed M. Sherif, A.A. Almajid, A.K. Bairamov, Eissa Al-Zahrani, Int. J. Electrochem. Sci., 7
(2012) 2796.
14.Abdel Salam Hamdy, E. El-Shenawy, and T. El-Bitar, Int. J. Electrochem. Sci., 7 (2012) 2832. 15.L.Y. Xu, M. Li, H.Y. Jing, Y.D. Han, Int. J. Electrochem. Sci., 8 (2013) 2069.
16.El-Sayed M. Sherif, H. R. Ammar, A. K. Khalil, Appl. Surf. Sci., 301 (2014) 142-148.
17.El-Sayed M. Sherif, A.H. Ahmed, Synthesis and Reactivity in Inorganic, Metal-Organic, and Nano-Metal Chemistry, 40 (2010) 365-372.
18.El-Sayed M. Sherif, Int. J. Electrochem. Sci., 6 (2011) 2284-2298. 19.J.R. Scully, Corrosion, 56 (2000) 199.
20.G. Bellanger, J. J. Rameau, J. Nucl. Mater., 228 (1996) 24-37. 21.M.J. Van Staden, J.P. Roux, Appl. Surf. Sci., 44 (1990) 263.
22.I.M. Wolff, L.E. Iorio, T. Rumpf, P.V.T. Scheers, J.H. Potgieter, Mater. Sci. Eng. A, 241 (1998) 264.