THE EFFECT OF SLAT AND FLAP TO THE AERODYNAMICS PERFORMANCE OF AN AIRFOIL
MOHD SOFIAN BIN ABD HAMID B041310265
BMCT
[email protected]
Report
Projek Sarjana Muda 2
Supervisor : DR NAZRI BIN MD DAUD Second Examiner : DR FADHLI BIN SYAHRIAL
Faculty Of Mechanical Engineering Universiti Teknikal Malaysia Melaka
i
DECLARATION
I declare that this project entitled “The effect of slat and flap to the aerodynamic performance of an airfoil” is the result of my own work except as cited in the references.
Signature : ………...
Name : MOHD SOFIAN BIN ABD HAMID
ii APPROVAL
I have checked this report and the report can now be submitted to JK-PSM to be delivered back to supervisor and to the second examiner. DR NAZRI BIN MD DAUD
Signature : ... Name of Supervisor : DR NAZRI BIN MD DAUD
Date : 24 MAY 2017
iii
DEDICATION
iv ABSTRACT
v ABSTRAK
vi
ACKNOWLEDGEMENT
First thing first, I would like to give my whole heartedly thank you to my supervisor for this study, Dr Nazri bin Md Daud. As my research supervisor, he was such a good mentor and without his helps I will not able to finish my research right on time. He guided me from the beginning until the last minutes of this research. He has helped and supported me to complete my research.
Besides that, not being forgotten my parents in Johor. My father Abd Hamid bin Aini. My mother Saropah binti Warjan. These two people is the one who have helped me a lot not only for this research but from the beginning of everything. They always encourage me to always give my best in everything. They are also believe in me and always motivate me to be a better person.
Next, I would like to give thousands of thank to someone special. To my fiancé Noor Syazwani binti Soelastro who were always be here with me supporting me and keep motivate me to finish my research and give my best on this research. She was always be on my side especially when I was having my difficult time and keep encourage me to not give up. Thank you.
vii
TABLE OF CONTENTS
DECLARATION ... i
APPROVAL ... ii
DEDICATION ... iii
ABSTRACT ... iv
ABSTRAK ... v
ACKNOWLEDGEMENT ... vi
LIST OF FIGURES ... ix
LIST OF TABLES ... xii
LIST OF ABBEREVATIONS ... xiv
CHAPTER 1 ... 1
1.1 Background ... 1
1.2 Problem statement... 1
1.3 Objective ... 2
1.4 Scope of project ... 3
1.5 General methodology ... 3
CHAPTER 2 ... 5
2.1 Introduction ... 5
2.2 Leading edge slat and trailing edge flap ... 5
2.3 Experimental design and set up ... 6
2.4 Result and discussion ... 9
CHAPTER 3 ...15
3.1 Overview ...15
3.2 Introduction ...15
viii
3.4 Literature review ...16
3.5 Preparation of NACA 0015 airfoil ...17
3.6 Material and apparatus set up ...23
3.7 Conducting the experiment ...25
3.8 Collecting the data ...27
CHAPTER 4 ...28
4.1 Introduction ...28
4.2 Result for the base case ...28
4.3 Results for the NACA 0015 airfoil with the leading edge slat and trailing edge flap ...28
4.4 Analysis of the base case ...33
4.5 Analaysis of leading edge slat and trailing edge flap ...35
Case 1 : 0° angle of slat, 0° angle of flap ...36
Case 2: 0° angle of slat, 30° angle of flap ...38
Case 3: 0 angle of slat, 45 angle of flap ...39
Case 4: +30° angle of slat, 0° angle of flap ...40
Case 5: -30° angle of slat, 0° angle of flap ...41
Case 6: +30° angle of slat, 45° angle of flap ...42
Case 7: -30° angle of slat, 30° angle of flap ...43
Case 8: 30 angle of slat, 30 angle of flap ...44
CHAPTER 5 ...46
5.1 Overview ...46
5.2 Base case ...46
5.3 Effect of leading edge slat and trailing edge flap ...48
5.4 Conclusion and recommendation ...49
ix
LIST OF FIGURES
FIGURE TITLE PAGE
Figure 1.5.1 The cross sectional diagram of the setup of the NACA 0015 4 4 airfoil with the lading edge slat and trailing edge
flap (Weishuang et al., 2017)
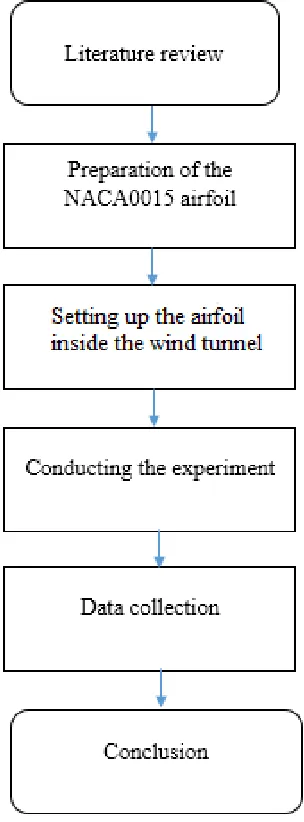
Figure 1.5.2 The overall flowchart of this research 5
Figure 2.2.1 An A-300 series airfoil profile with leading edge slat and trailing 5 edge flap (Savory et al., 1992)
Figure 2.3.1 Configuration for takeoff and landing of a GA (W)-2 airfoil. 6 (Weishuang et al., 2017)
Figure 2.3.2 Schematic view of the 270 pressure tappings distributed along 7 the airfoil chord (Pagani, Souza, & Medeiros, 2017)
Figure 2.3.3 Top view of the airfoil inside wind tunnel with its angle of 7 attack (Pagani et al., 2017)
Figure 2.3.4 The wind tunnel (Şahin & Acir, 2015) 8
Figure 2.3.5 Wind tunnel test mechanisms (Şahin & Acir, 2015) 8 Figure 2.4.1 The comparison of Cp for simulation and numerical. 9
(Weishuang et al., 2017)
Figure 2.4.2 Velocity profile for the cross sectional airfoil 10 .(Weishuang et al., 2017)
Figure 2.4.3 The streamlines around the extended slat (Savory et al., 1992) 10 Figure 2.4.4 Recirculation region behind the extended slat. 11
(Savory et al., 1992)
Figure 2.4.5 Lift and drag curves for the airfoil with the devices open and 11 close (Savory et al., 1992)
x
Figure 3.3.1 The flowchart of this research 14
Figure 3.5.1 The interface of the home of the airfoiltools website 16 Figure 3.5.2 Insert the properties of the desired airfoil 16 Figure 3.5.3 The coordinates generate for plotting the airfoil shape 16 Figure 3.5.4 Interface of the start up the SolidWorks software 17 Figure 3.5.5 Selecting the drawing of a single component 17 Figure 3.5.6 Selecting the curves from XYZ points from the Curves tab 17 Figure 3.5.7 Inserting the coordinates of X, Y and Z axis of the airfoils 18 Figure 3.5.8 Shape of the airfoil generated from the coordinates and 18
selecting the extrude feature
Figure 3.5.9 Solid model of NACA 0015 airfoil generated 18
Figure 3.5.10 The CubePro Duo 3D Printing machine 19
Figure 3.5.11 The ABS for the printing material 20
Figure 3.5.12 Printed model of NACA 0015 with flap and slat 20 Figure 3.6.1 The middle part of the wind tunnel where subject will be tested 22 Figure 3.6.2 The speed control module used to control the velocity of the wind 22 Figure 3.6.3 Slope lever of pressure of water to determine the velocity of the 22
air in wind tunnel
xi
xii
LIST OF TABLES
TABLE TITLE PAGE
Table 3.8.1 The table that will be used to tabulate the data for the experiment 25 of the base case
Table 3.8.2 The table that will be used to tabulate the data for the experiment 25 of slat and flap of an airfoil
Table 4.2.1 The data collected from the experiment of the base case 26
Table 4.3.1 The data for the test with 0° angle of slat and 0° angle of flap 27 Table 4.3.2 The data for the test with 0° angle of slat and 30° angle of flap 27 Table 4.3.3 The data for the test of 0° angle of slat and 45° angle of flap 28 Table 4.3.4 The data for the test of +30° angle of slat and 0° angle of flap 28 Table 4.3.5 The data for the test of -30° angle of slat and 0° angle of flap 29 Table 4.3.6 The data for the test of +30° angle of slat and 45° angle of flap 29 Table 4.3.7 The data for the test of -30° angle of slat and 45° angle of flap 30 Table 4.3.8 The data for the test of -30° angle of slat and 30° angle of flap 30 Table 4.3.9 The data for the test of +30° angle of slat and 30° angle of flap 31 Table 4.4.1 The table of angle of attack and the drag and lift coefficient 32
Table 4.5.1 Lift and drag coefficient for test 1 35
Table 4.5.2 The lift and drag coefficient for test 2 36
xiii
Table 4.5.5 The lift and drag coefficient for the test 5 39 Table 4.5.6 The lift and drag coefficient for the test 6 40 Table 4.5.7 The lift and drag coefficient for the test 7 41 Table 4.5.8 The lift and drag coefficient for the test 8 42 Table 4.5.9 The lift and drag coefficient for the test 9 43
xiv
LIST OF ABBEREVATIONS
DBD Dielectric barrier discharge PVC Polyvinyl chloride
PMMA Polymethyl methacrylate
1 CHAPTER 1
INTRODUCTION
1.1 Background
Flap was originally being invented and applied to the airfoil purposed to improve the take off and landing aerodynamics process of an airplane. The optimization results show that under takeoff configuration, the variable camber trailing-edge flap can increase lift coefficient by about 8% and lift-to-drag ratio by about 7% compared with the traditional flap at a takeoff angle of 8°. (Weishuang, Yun, & Peiqing, 2017). In these few years back, the more attentions are given to the aerodynamics of deformable wings. The term deformable means that the wings have flap that can be retracted back (Li, Dong, & Liu, 2015).
Leading edge slat and the trailing edge flap are commonly being applied on the airfoil wings in order to obtain high lift force towards the wings. The design of this type of wings are aided by modern numerical modelling that able people to evaluate many value of performance on different geometries (Savory, Toy, Tahouri, & Dalley, 1992).
1.2 Problem statement
2
because they have and estimated time to arrive to be followed. Using extra power on the engine will directly increase the fuel consumption of the plane.
There were many researches done before working on how to solve this problem. For example, in 1990, Mohamed Gad-El-Hak has done a research on control of a low-speed airfoils aerodynamics in order to find solutions for the problem encountered. Some famous research regarding to the problem of the drag force of an aeroplane’s wings is about designing an aerodynamic shape of the wings. A different shape will give different measure related to the flow around it. For example, a bluff area will cause greater air resistance compared to the one with aerodynamic shape.
The application of slatted leading edge of an airfoil and the flapped trailing edge of an airfoil is one of the thing that is being study in order to have a better performance of an airplane. With the theory that the application of flap and slat that is able to increase the lift of an airplane, it means that lower velocity is needed for the airplane to take off which also means that less fuel consumption during the take off. The flap is affecting for the take off while the slat is for the cruising ship at constant velocity.
1.3 Objective
The objectives of this project are as follows :
1. To study the effect that can be caused by the application of leading edge slat and trailing edge flap on NACA 00115 airfoil,
2. To evaluate the drag and the lift of the NACA 0015 airfoil.
3 1.4 Scope of project
The scopes of this project are as follows:
1. Design and fabricate a NACA 0015 airfoil
2. Testing the normal NACA 0015 airfoil with no slat and flap in a high velocity wind tunnel.
3. Testing the modified NACA 0015 airfoil with slat on the leading edge and flap on the trailing edge in a high velocity wind tunnel.
1.5 General methodology
The actions that is needed to be carried out in order to achieve the objectives of this project are listed below:
1. Literature review
Journals, articles, or any materials regarding to this project will be reviewed to find extra information related to the effect of the plasma actuator to the airfoil.
2. Experimentation
4
Figure 1.5.1 The cross sectional diagram of the setup of the NACA 0015 airfoil with the lading edge slat and trailing edge flap (Weishuang et al., 2017)
[image:19.612.236.388.248.659.2]5 CHAPTER 2
LITERATURE REVIEW
2.1 Introduction
In this chapter, a few previous studies done related to the effect of application of the leading edge slat and the trailing edge flap will be reviewed here to gather as much as information that can be very helpful in the future.
2.2 Leading edge slat and trailing edge flap
6
Figure 2.2.1 An A-300 series airfoil profile with leading edge slat and trailing edge flap
(Savory et al., 1992)
Aircraft wing design generally takes the efficiency of the cruise flight and the high-lift performance at takeoff and landing into consideration and the trailing-edge high-lift devices have been widely used on many kinds of aircraft previously (Li et al., 2015)
2.3 Experimental design and set up
7
Figure 2.3.1 Configuration for takeoff and landing of a GA (W)-2 airfoil. (Weishuang et al.,
2017)
In a different but related paper, the writer W.L Siauw in his paper entitled Transient phenomena in separation control over a NACA 0015 airfoil, NACA 4412 was used as a model in his experiment. The test section was 1.3m high, 1.7mwide and 3.0m long. The contraction ratio was 1:8 and the flow was driven by an eight- blade axial fan. The vertically mounted model spanned the entire working section. The model ends were attached to horizontal turntables placed in the central part of the working section. The lower turntable enabled the manual adjustment of the airfoil angle of attack. Porous plates were installed on both lower and upper turntables, through which suction was applied along the model suction-side and in front of the slat to reduce the effect of the tunnel wall boundary layer.
8
Figure 2.3.2 Schematic view of the 270 pressure tappings distributed along the airfoil chord
(Pagani, Souza, & Medeiros, 2017)
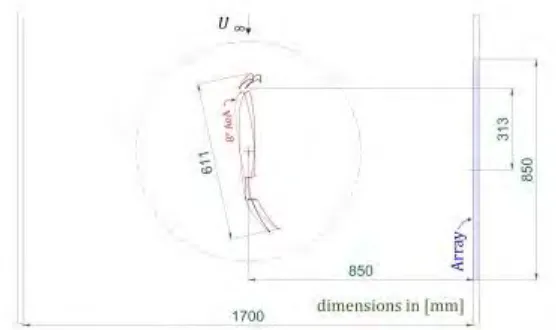
[image:23.612.174.452.272.437.2]The top view of the airfoil arrangement and the angle of attack inside the wind tunnel are as in the Figure 2.3.3
Figure 2.3.3 Top view of the airfoil inside wind tunnel with its angle of attack (Pagani et al.,
2017)
9
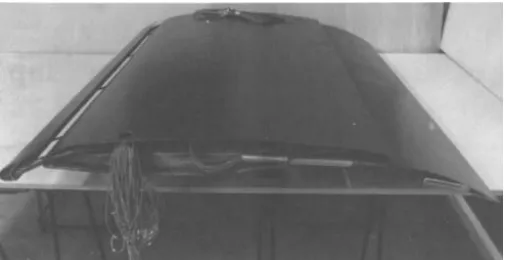
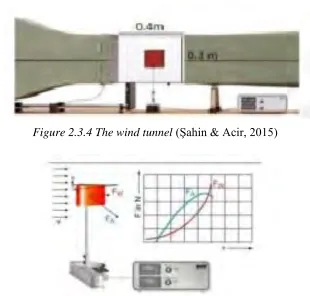
Figure 2.3.4 The wind tunnel (Şahin & Acir, 2015)
Figure 2.3.5 Wind tunnel test mechanisms (Şahin & Acir, 2015)
The experiments has been conducted at 10 m/s wind velocity (V) in tunnel which is corresponding to 68490 Reynolds number (Re) and the airfoil is forced stationary wind velocity to learn lift and drag coefficient, the airfoil profile is attached to electronic two- component coefficient transducer. The values for drag and lift are displayed digitally on the measurement amplifier (Şahin & Acir, 2015)