White Rose Research Online URL for this paper: http://eprints.whiterose.ac.uk/104232/
Version: Accepted Version
Article:
Chin, A and Bruine de Bruin, W orcid.org/0000-0002-1601-789X (2018) Eliciting Stock Market Expectations: The Effects of Question Wording on Survey Experience and Response Validity. Journal of Behavioral Finance, 19 (1). pp. 101-110. ISSN 1542-7560 https://doi.org/10.1080/15427560.2017.1373353
© 2017 The Institute of Behavioral Finance. This is an Accepted Manuscript of an article published by Taylor & Francis in Journal of Behavioral Finance on 11 Oct 2017, available online: http://www.tandfonline.com/10.1080/15427560.2017.1373353. Uploaded in
accordance with the publisher's self-archiving policy.
[email protected] https://eprints.whiterose.ac.uk/
Reuse
Items deposited in White Rose Research Online are protected by copyright, with all rights reserved unless indicated otherwise. They may be downloaded and/or printed for private study, or other acts as permitted by national copyright laws. The publisher or other rights holders may allow further reproduction and re-use of the full text version. This is indicated by the licence information on the White Rose Research Online record for the item.
Takedown
If you consider content in White Rose Research Online to be in breach of UK law, please notify us by
Eliciting stock market expectations: The effects of question wording on survey experience and
response validity
Alycia Chin and Wändi Bruine de Bruin
Manuscript accepted by Journal of Behavioral Finance
Alycia Chin, Office of Research, Consumer Financial Protection Bureau, 1700 G St NW,
Washington, DC, 20552, [email protected]. Wändi Bruine de Bruin, Centre for Decision
Research and Leeds University Business School, University of Leeds, Maurice Keyworth
Building, Leeds LS2 9JT, UK, [email protected].
Disclaimer for Chin
This article is the result of the author’s independent research and does not necessarily represent
the views of the Consumer Financial Protection Bureau or the United States.
Acknowledgements
This work was supported by the National Institute on Aging at the National Institutes of Health
[P01 AG026571; R01 AG020717; R01 AG020638]. We thank Stephen Broomell, Mick Couper,
Baruch Fischhoff, Pamela Giustinelli, Michael Hurd, Arie Kapteyn, Chuck Manski, Mary Beth
Ofstedal, Susann Rohwedder, David Weir, Robert Willis, and seminar participants at the Internet
Interviewing and the HRS conference and Carnegie Mellon University for comments given at
various stages of this project. We would also like to thank Tania Gutsche, Julie Newell, and
interviewers at the University of Michigan’s Survey Research Center for facilitating this research
Abstract
Expectations about stock market movements are an important factor in models of
investments and savings. To better understand consumers’ financial behavior, economic surveys
such as the Health and Retirement Study (HRS) ask participants to report expectations about the
stock market. However, readability statistics suggest that the HRS’ stock market expectations
questions use relatively complex wording, which may contribute to their relatively high rates of
missing responses. Here, we build on survey design research to improve the readability of these
questions. In two experiments using national online panels, we test whether revising stock
market expectation questions to reduce their difficulty affects respondents’ 1) survey experience,
as measured by percent of missing answers and ratings of question clarity and difficulty, and 2)
response validity, as assessed by respondents’ confidence in their answer and comparisons
between expectations and stock market outcomes. In both studies, our revisions improve survey
experience. Unfortunately, revisions also decreased the perceived (Study 1) and actual (Study 2)
validity of responses. We discuss implications of question revisions for the design of economic
surveys.
Keywords: stock market expectations, survey design, HRS, survey experience, response
Introduction
Over the past few decades, Americans have taken increased responsibility for personally
managing their retirement assets (Poterba et al., 2007). To ensure that they have sufficient
retirement wealth, consumers are encouraged to invest in the stock market. Yet, only about 50%
of U.S. households have stock market holdings, including stocks that are part of managed
retirement accounts (Board of Governors of the Federal Reserve System, 2014). Models of
portfolio choice predict that investment decisions depend, among other factors, on estimates of
expected investment returns (Markowitz, 1952; Sharpe 1964). Thus, in order to understand
consumers’ investment decisions, surveys have been designed to elicit consumers’ expectations
of stock market movements.
Research exploring the validity of consumers’ stock market expectations has shown that
survey-based reports correlate with investment behaviors in meaningful ways. For instance,
consumers who report more optimistic beliefs about stock market returns are more likely to hold
stock market assets (Dominitz & Manski, 2007; Hurd, 2009), maintain a higher proportion of
their portfolio in stocks (Vissing-Jorgenson, 2003), and acquire stocks in the near future (Hurd,
Van Rooij, & Winter, 2011). Consumers’ stock market expectations also change in response to
market events, such as the financial crisis of 2008 (Hoffmann, Post, & Pennings, 2013; Weber,
Weber, & Nosić, 2013), suggesting that investors update expectations as they learn about events
that could affect returns.
Although responses to commonly analyzed survey questions about stock market
expectations have demonstrated validity in terms of correlations with behavior, there are
concerns that their wording may be relatively difficult. The readability of a text excerpt can be
words per sentence and the number of syllables per word (Flesch, 1948; Kincaid et al., 1975).1 It
is matched to the American educational system, such that texts with a Flesch-Kincaid statistic of
6 should be understandable to individuals who have completed the 6th grade (Kincaid et al.,
1975).2 Average adult literacy in the U.S. ranges between 7th and 9th grade levels (Neuhauser &
Paul, 2011), so readability guidelines recommend that materials disseminated to members of the
general public do not exceed that range (e.g., Daraz et al., 2011; Young, Hooker & Freeberg,
1990).
Calculating the Flesch-Kincaid statistic for questions in the nationally representative
Health and Retirement Study (HRS) shows that this survey contains a stock market expectations
question with a reading level of 13.5. It asks participants: “By next year at this time, what is the
percent chance that mutual fund shares invested in blue chip stocks like those in the Dow Jones
Industrial Average will be worth more than they are today?” (Table 1). The nationally
representative Survey of Economic Expectations (SEE) asks respondents for expectations
regarding “the type of mutual fund known as a diversified stock fund,” with the full question
having a reading level of 8.3.3
Questions that are difficult to read may cause problems for survey respondents. For
instance, survey research on attitudinal questions shows that respondents are more likely to skip
questions that are more difficult to read (Knäuper, Belli, Hill & Herzog, 1997). If the same
pattern applies to expectations questions, then stock market expectations questions should yield
relatively large non-response rates. Indeed, the 2006 HRS and 2000 SEE questions about stock
market expectations had non-response rates of 24% and 27%, respectively (see Hurd, 2009;
Dominitz & Manski, 2011). By comparison, a 2006 HRS question with a Flesch-Kincaid
(Hurd, 2009), suggesting that respondents may have found the stock market question much more
difficult.
In addition to having high non-response rates, survey questions that are difficult to read
may pose a threat to response validity, as demonstrated by reduced correlations with behaviors.
One diagnostic of response validity is respondents’ perceived validity, expressed as their
confidence in their answers. In Bruine de Bruin and Carman (2012), for instance, respondents
were asked to indicate their level of confidence in their reported survival expectations. Those
who indicated low confidence by stating that they had “no idea about the chance” or that “no one
can know the chance” gave expectations that had lower validity than those who reported having
confidence. Specifically, respondents who had low confidence reported survival expectations
that had lower correlations with variables relevant to survival such as age, number of visits with
medical specialists, and self-reported serious health problems (Bruine de Bruin & Carman,
2012). Participants who have low confidence about their expectations may also be more likely to
use “50%” responses as an expression of “don’t know” rather than a numerical probability
(Bruine de Bruin et al., 2000; Bruine de Bruin & Carman, 2012; Fischhoff & Bruine de Bruin,
1999). While there is no direct evidence on respondents’ confidence in their stock market
expectations, on the 2006 HRS about 30% of those answering the stock market question gave a
50% response, relative to 23% of those answering a question about survival (Hurd, 2009).
The Effects of Rewording Expectations Questions on Survey Experience and Response Validity
While correlations between readability and non-response suggest that simplifying
difficult-to-read questions may be beneficial, a more direct test would involve conducting an
(Fowler, 2004; Presser et al., 2004). One survey-based experiment has shown that questions that
are written in a less complex style cause lower drop-out rates (Ganassali, 2008). Another has
shown that avoiding problematic features, such as low-frequency words and ambiguous
vocabulary, reduces the use of “don’t know” responses (Lenzner, 2012). Hence, stock market
expectations may be improved by eliminating unfamiliar terms that are difficult to understand
(e.g., “blue chip stocks like those the Dow Jones Industrial Average”) in favor of more colloquial
terms (e.g., “the stock market”) and by using fewer words (e.g., removing “like those in the Dow
Jones Industrial Average”). Here, we test this idea by revising questions about stock market
expectations. The original and revised questions that we examine, as well as their associated
Flesch-Kincaid readability statistics, are shown in Table 1.
We assess the effect of question revisions on two outcomes: respondents’ survey
experience and response validity. Survey experience includes respondents’ ratings of the
question’s difficulty and their likelihood of answering. Validity consists of perceived validity,
which is measured by asking respondents whether they are confident in their answer, as well as
actual validity, which can be measured by gauging whether 1) respondents’ behaviors are
correlated with their stated beliefs (as in Hurd, Van Rooij, & Winter, 2011) or 2) mean reported
expectations are in agreement with observed outcomes (as in Bruine de Bruin, Parker, &
Fischhoff, 2007). For this paper, we assess validity by examining respondents’ confidence in
their answers and comparisons between mean expectations and stock market outcomes.
While previous research on survey design suggests that revising question wording may
have beneficial effects on survey data quality (Ganassali, 2008; Lenzner, 2012), there is also
reason to believe that revised questions could adversely affect survey experience and response
general,” some respondents recognized the intended meaning as “inflation” while others
interpreted it as asking about their personal experiences with prices (Bruine de Bruin, van der
Klaauw, Downs, Fischhoff, Topa, & Armantier, 2010). Respondents who thought of personal
price experiences tended to report larger expectations, because experiences with large price
changes were more salient to them (Bruine de Bruin, van der Klaauw & Topa, 2011). Questions
that ask about expectations for “inflation” therefore yield less variation in question interpretation,
and responses that are less extreme and less dispersed, as compared to questions that ask about
expectations for “prices in general” (Bruine de Bruin et al., 2012). It is possible that using more
difficult terminology in survey questions about stock market expectations may similarly reduce
variability in respondents’ interpretations and yield better response validity.
Given that revised survey questions do not necessarily lead to improvements in survey
experience and response validity, it is ultimately an empirical question if modifying specific
questions would be beneficial for respondents and data quality. We report on two online
experiments in which we examined the effect of the revised (vs. original) question wording of
stock market expectations questions (Table 1) on 1) survey experience, as measured by ratings of
question clarity and question difficulty, and whether participants choose to skip the question, and
2) perceived and actual response validity, as measured by respondents’ confidence in their
answers and comparisons between expectations and stock market performance.
Study 1
Method
Sample. We surveyed 1,516 members of the 2011 HRS Internet panel who answered an
had internet access in the 2009 HRS, a nationally representative sample of adults aged 50 or
over. Panel members were invited to participate in our survey in exchange for $25. The overall
response rate for the 2011 HRS Internet survey was 79.9% (Health and Retirement Study, 2012).
In our sample, 58.9% of respondents were women and 38.9% had a college degree.4 On average,
respondents were 65.3 years old (SD = 9.9). Data are publicly available at
http://hrsonline.isr.umich.edu/.
Stock market expectations. Participants were asked to report their stock market
expectations as part of a larger survey about health and finances. Following standard HRS
practice, the section on expectations began with the following introduction, “We would like to
ask your opinion about how likely you think various events might be. For each question, please
give a number from 0 to 100, where ‘0’ means that you think there is absolutely no chance, and
‘100’ means that you think the event is absolutely sure to happen.” This text was followed by an
example showing how to use the scale to report the chances of rain tomorrow.
Participants were randomly assigned to answering the original version (n = 733) or the
revised version of the stock market expectations question (n = 783). The wording for the
original question had a Flesch-Kincaid reading level of 13.5 while the revised version had a
reading level of 4.5 (Table 1). All participants were asked to “Please give a number between 0%
and 100%.”
Measures of survey experience.
Non-response to stock market expectations question. Participants who did not respond
to the stock market expectations question were coded as non-respondents.
Question ratings. All respondents were asked to rate the question’s clarity and difficulty.
chance that the stock market will be higher in a year than it is now. How clear was this
question?” and presented a visual response scale ranging from 1 = Not clear at all to 7 = Very
clear (following Fischhoff & Bruine de Bruin, 1999). In order to measure the perceived
difficulty of answering this question, we asked, “How hard was it to come up with an answer to
this question?” The accompanying visual response scale ranged from 1 = Not hard at all to 7 =
Very hard.
Response validity.
Confidence in response. As an indicator of perceived response validity, we asked
respondents to rate their confidence in their answer, if they had provided one (Bruine de Bruin &
Carman, 2012). Specifically, respondents saw the expectation they had just reported and were
asked, “Which of the options below best represents how you think about that answer?” They
could select (a) “I am very sure about the chance,” (b) “I am pretty sure about the chance,” (c) “I
actually have no idea about the chance,” or (d) “No one can know the chance.” The former two
response options are expressions of relatively high confidence and the latter two signal relatively
low confidence (Bruine de Bruin & Carman, 2012).
Stock market performance. A year after the survey was fielded, we collected data on the
performance of the Dow Jones Industrial Average from the Federal Reserve Bank of St. Louis
(https://research.stlouisfed.org/fred2/series/DJIA/). Using this data set, we calculated annual
stock market performance over two periods. The first included returns from the fielding period,
and therefore reflected the values that respondents were asked to predict in the stock market
expectations question (“post-survey returns”). We also calculated returns that preceded the
survey fielding period (“pre-survey returns”), reflecting information available to respondents at
Specifically, we calculated post-survey returns for the survey fielding months (i.e., May
through August 2011) and matched these to participants’ responses based on the month when
they took the survey. Pre-survey returns were calculated for the ten years preceding the fielding
period (i.e., May 2001 to April 2011). In all cases, we calculated monthly-level returns because
survey responses from the HRS Internet panel were dated at the monthly level. For the month in
which the participant completed the survey, we used the first trading date of the month. For
example, the yearly return for May 2011 was calculated as (May 1, 2012 closing value – May 2,
2011 closing value) ÷ (May 2, 2011 closing value).
Results
Survey experience.
Non-response to stock market expectations question. We found that 10.5% of
respondents did not answer the original version of the stock market question. Only 4.3% skipped
the revised version. Thus, the revision caused a decline in missing responses ( 2(1, N = 1516) =
20.29, p < .001).
Question ratings. Respondents perceived the revised version of the stock market question
as clearer (M revised = 6.0, SD = 1.6; M original = 5.8, SD = 1.7; t(1403) = 2.97, p = .003) and
less difficult to answer (M revised = 2.8, SD = 1.9; M original = 3.0, SD = 1.9; t(1403) = -2.18, p
= .030) than the original version of the question.
Response validity.
Confidence in response. We calculated the proportion of respondents who indicated
confidence in their response by stating “I am very sure about the chance” or “I am pretty sure
questions showed that fewer participants had confidence when answering the revised stock
market question (40.3%) versus the original question (45.8%; 2(1, N = 1401) = 4.01, p = .045).
Possibly, the simpler wording of the revised question was perceived as more ambiguous (Bruine
de Bruin et al., 2012), or encouraged participants who would not have answered to shift to an
uncertain response.
As in past research (e.g., Bruine de Bruin & Carman, 2012), participants who had more
confidence were also less likely to say “50%” (48.9% vs. 69.2%; 2(1, N = 1401) = 55.78, p <
.001). Additionally, those with confidence in their answer gave higher average expectations (M
= 55.3%, SD = 25.1) than those with low confidence (M = 43.0%, SD = 19.9; t(1399) = 10.23, p
< .001).
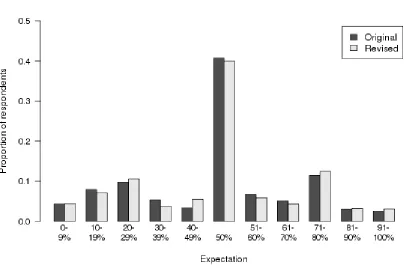
Stock market performance. We analyzed participants’ expectations and how they aligned
with the performance of the Dow Jones Industrial Average. As shown in Figure 1, there was no
significant difference between the distributions of the expectations reported in response to the
original and the revised questions (Kolmogorov-Smirnov D = 0.03, p = .98). Both the original
and the revised versions yielded similar average expectations (M original = 48.5%, SD = 23.3 vs.
M revised = 47.9%, SD = 23.0; t(1403) = .53, p = .596). These results indicate that overall
responses were not affected by changes to the wording of the question.
An analysis of post-survey stock market returns shows that there were positive nominal
returns for three of four survey fielding months (75%), capturing 51.6% of respondents. Thus,
respondents’ average expectations were slightly pessimistic when compared to actual stock
market returns. We also compared reported expectations to pre-survey returns for the ten years
nominal yearly returns in 69.2% of months (83 of 120). As such, respondents were pessimistic
when compared to historical outcomes.
Discussion
Our analysis of data collected from the HRS Internet panel suggests that the original HRS
stock market question may be difficult for some participants to understand. The revised version
of the question, which asks about the “stock market” rather than “mutual fund shares invested in
blue chip stocks like those in the Dow Jones Industrial Average,” improves respondents’ survey
experience. Specifically, this question is perceived as clearer and easier to answer, and elicits
fewer missing responses than the original question. However, we found that the overall rate of
missing responses to this question was 10.5%, which is lower than the rate reported in some
previous research (Hurd, 2009).5 One possible reason for this difference may be the survey
administration mode. The HRS is primarily administered over the phone, while the HRS Internet
Panel used in Study 1 is only completed online. In previous research, researchers asking
questions about inflation expectations have found that administering surveys in-person versus
online causes different non-response rates, with lower levels of non-response online (Bruine de
Bruin et al., 2016). It is possible that a similar mode effect may have contributed to the lower
level of non-response in this study.
While our experiment showed beneficial effects of the revised wording on respondents’
survey experience, we found mixed results for response validity. First, the revised version of the
question reduced respondents’ confidence (i.e., feeling “very sure” or “pretty sure”) about their
answers, suggesting that they perceived their answers as being less valid (e.g., Bruine de Bruin &
correspondence between mean expectations and stock market movements. Before drawing
strong conclusions about these results, we test a similar revision using a different sample and a
question asking about a 5% stock market return over the next month.
Study 2 was designed to test the robustness of conclusions from Study 1 using a different
sample and time frame. Specifically, participants from the American Life Panel reported their
expectations for a 5% stock market increase over the next month. Traditionally, the HRS asks
respondents about their expectations of an overall stock market increase and an increase of 20%
or more (Hurd, 2009). In past years, the HRS asked questions about different levels of change
(ranging from -40% to +40%) in order to examine expectations over a wider range of outcomes.
Here, we asked about a smaller change happening over a shorter time period so as to be able to
compare reported expectations to stock market performance sooner.
Study 2
Method
Sample. Participants were members of RAND’s American Life Panel (ALP), who fill
out monthly online surveys about economic topics (https://mmic.rand.org/panel/). For this study,
3,197 ALP members were invited to participate. A total of 2,831 responded, representing an
overall response rate of 88.6%. Of those responding, 59.4% were women, and 41.6% had a
college degree. Respondents reported a mean age of 50.0 years (SD = 14.9).
Stock market expectations. Participants received the same introduction to the
expectations questions as in Study 1. Next, they estimated the probability of a 5% stock market
increase over the next month, in response to original (n = 1442) or revised (n = 1389) question
for the revision (Table 1). As is standard practice in the ALP, participants who skipped the
question or gave a non-numeric answer were encouraged to go back and provide a probability
response, because “your answers are important to us.” Perhaps because such encouragements
are commonly used on the ALP, questions tended to elicit few missing responses.
Survey experience.
Non-response to stock market expectations question. Participants who did not answer
the expectations question were coded as non-respondents.
Question ratings. All respondents were asked to rate the clarity of the stock market
expectations question and how easy it was to answer using the same questions as in Study 1.
Response validity.
Confidence in response. As in Study 1, participants were asked to explain their
response, if they had given one, by selecting (a) “I am very sure about the chance,” (b) “I am
pretty sure about the chance,” (c) “I actually have no idea about the chance,” or (d) “No one can
know the chance” (following Bruine de Bruin & Carman, 2012).
Stock market performance. We collected data on closing prices of the Dow Jones
Industrial average in order to calculate the probability of experiencing a month-to-month return
of 5% or more. The ALP recorded respondents’ survey completion date at the daily level.
Therefore, we calculated stock market returns for the 30-day window from those dates. The next
available trading date was used for participants who completed the survey during weekends or
holidays (e.g., the June 4th monthly return was calculated using the July 5th closing value instead
of the July 4th value). We also calculated pre-survey returns for trading days in the year
Results
Survey experience.
Non-response. We found that 1.2% of respondents did not answer the original version of
the stock market question. In contrast, .4% skipped the revised version. Thus, the revision caused
a significant decline in missing responses ( 2(1, N = 2831) = 5.18, p = .023).
Question ratings. Respondents perceived the revised version of the stock market question
as clearer than the original version (M revised = 6.7, SD = .9; M original = 6.5, SD = 1.2; t(2805)
= 6.45, p < .001). There was no significant difference in perceptions of how difficult the
question was to answer (M revised = 3.3, SD = 1.8; M original = 3.4, SD = 1.9; t(2802) = -1.46,
p = .144).
Response validity.
Confidence in response. There was no difference in the proportion of respondents who
expressed confidence by stating “I am very sure about the chance” or “I am pretty sure about the
chance” between the original (36.4%) and revised (33.3%) versions of the question ( 2(1, N =
2808) = 2.95, p = .086). A comparison of the expectations given by participants shows that those
who were confident in their answer were less likely to have reported an expectation of 50%
(15.9% versus 28.3%; 2(1, N = 2808) = 55.54, p < .001). Additionally, those who were
confident had different average expectations. Average expectations were 25.4% (SD = 24.3) for
those who reported relatively high confidence and 28.0% (SD = 20.1) for those with lower levels
of confidence (t(2806) = -3.01, p = .003).
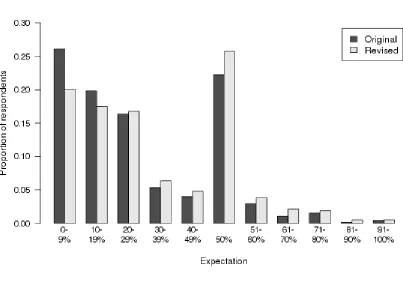
Stock market performance. The distribution of respondents’ answers is shown in Figure
2. As shown, there was an upward shift in responses for those receiving the revised stock market
.001). As such, the average response to the stock market question was significantly higher with
the revised version (M = 29.1%; SD = 21.9, t(2807) = 4.95, p < .001) than with the original
version (M = 25.1%; SD = 21.3).6
These expectations can be interpreted in the context of actual stock market returns.
Post-survey monthly gains were 5% or higher for only .2% of respondents in this Post-survey. As such,
participants were too optimistic on average about the possibility of a 5% return. As a point of
comparison, we also calculated pre-survey monthly gains. This analysis showed that 14.3% of
trading days had monthly gains of over 5%; respondents’ average expectations were also
optimistic when compared to these returns. Thus, the higher expectations reported under the
revised version of the stock market question were less valid than those reported under the
original wording.
Discussion
Our analysis of data from the ALP shows that, even in this sample of frequent survey
respondents, rewording the stock market question can improve survey experience. Specifically,
the revised version of the question was rated as clearer by respondents and led to fewer missing
responses. However, the results of this study also reveal problems with the validity of responses
to the revised question. Specifically, although the revision did not improve the proportion of
respondents who were confident about their reported expectation, those responding to the revised
question provided less valid answers insofar as they deviated further from both historical stock
market returns and actual returns. As such, the results of this study suggest that rewording the
question about a 5% monthly stock market increase improved respondents’ survey experience
General discussion
In order to understand consumers’ saving, investment, and retirement behavior,
economists have asked respondents in large national surveys to report stock market expectations.
Such questions have predictive validity, as shown in correlations with actual stock market
holdings and stock acquisition (e.g., Hurd, Van Rooij, & Winter, 2011). Yet, researchers have
suggested that survey questions about stock market expectations may be difficult for some
respondents to answer (e.g., Hurd, 2009). Following methods from the survey design literature
(Presser et al., 2004; Fowler, 2004), we tested the effects of revising a stock market expectations
question to ask about “the stock market” instead of “mutual fund shares invested in blue chip
stocks.” Specifically, we analyzed whether this revision affected 1) respondents’ experience
with the survey, measured through ratings of question clarity, ratings of question difficulty, and
whether respondents provided an answer, and 2) response validity, measured through
respondents’ confidence in their expectation and a comparison of mean stock market
expectations to actual returns.
Both of our studies suggest that participants who receive a less complex version of the
stock market question are likely to have a better experience with the survey. Participants
perceived the question as clearer and were more likely to respond. In Study 1, they also
perceived the revised version as easier to answer. Thus, simplified wording can provide benefits
for survey respondents and reduce associated problems of unrepresentative samples stemming
from non-response (Hurd, 2009). If implemented, such revisions could also have beneficial
willingness to respond in later survey waves (e.g., Kalton et al., 1990; Lepkowski & Couper,
2002; Olsen, 2005).
However, our findings also suggested that simplified questions may introduce concerns
about response validity. In Study 1 respondents who received the revised question were less
confident in their answers and in Study 2, respondents’ mean expectations showed less
correspondence with stock market performance. These patterns are similar across the two
studies (Table 2), although the effects vary in magnitude.
These results draw attention to a potential tradeoff between survey experience and
response validity when writing questions about stock market expectations. Our results are
consistent with previous research which shows that replacing expert terminology with simpler
wording (e.g., “prices” instead of “inflation”) may produce confusion about a question’s
meaning (Bruine de Bruin et al., 2012). Here, we simplified questions about “blue chip stocks
like those in the Dow Jones Industrial Index” by asking about “the stock market.” Doing so
tended to improve respondents’ experience but not improve perceived or actual response
validity, perhaps because respondents did not know how to answer. Our questions were
simplified below the 7th grade reading level in order to conform to readability guidelines (Young,
Hooker & Freeberg, 1990), but it is possible that a less dramatic change could have produced
more precise wording and more valid responses.
Comparing results across the two studies highlights areas of divergence. Most notable
may be the overall differences between the two studies in terms of non-response rates and
confidence; across the two studies, there is a nearly ten-fold difference in missing responses and
roughly a ten percentage point difference in the proportion of respondents who say they are
within the same sample in order to better understand whether sample variation or question
variation drives these differences.
Like most studies, the current research is not without limitations. First, we present data
from two studies that use parallel wording for questions about stock market expectations. It is
possible that simplified wording would have different consequences for questions on other
topics. Another limitation is our measure of response validity. We compared stock market
expectations to returns over the periods in the expectations questions (i.e., one year and one
month), but we recognize that actual returns may be affected by unexpected events. As such,
responses that appear reasonable at the time of the survey may be inaccurate in retrospect and
vice versa. Future research should also assess validity by examining correlations between
reported expectations and investment behaviors.
In the meantime, we note that surveys need to be written so that they are targeted at the
intended audience (Bruine de Bruin & Bostrom, 2013). Simple questions that improve survey
experience may be more important when surveying non-experts, or when running longitudinal
studies where attrition is a concern. However, simplifying questions may provide more limited
benefits when surveying experts who can process question content with less difficulty. Survey
researchers recommend pre-testing surveys using cognitive interviews, in which respondents are
asked to think out loud while answering survey questions, in order to diagnose potential
problems before they arise (Converse & Presser, 1986; Dillman et al., 2009). Such interviews
may provide benefits for future researchers who are interested in eliciting stock market
expectations.
Ultimately, researchers interested in understanding consumers’ investment behavior must
By better understanding the cognitive mechanisms underlying survey responses, and by testing
survey revisions to measure their effects with intended participants, we should be able to develop
References
Board of Governors of the Federal Reserve System. (2014). Changes in U.S. family finances
from 2010 to 2013: Evidence from the Survey of Consumer Finances. Federal Reserve
Bulletin, 100(4): 1-40.
Bruine de Bruin, W., & Bostrom, A. (2013). Addressing what to address in science
communication. PNAS, 110(suppl. 3): 14062-14068. doi: 10.1073/pnas.1212729110
Bruine de Bruin, W., & Carman, K. G. (2012). Measuring risk perceptions: What does the
excessive use of 50% mean? Medical Decision Making. 32(2), 232-6. doi:
10.1177/0272989X11404077
Bruine de Bruin, W., Fischhoff, B., Millstein, S. G., & Halpern-Felsher, B. L. (2000). Verbal and
numerical expressions of probability: “It’s a fifty-fifty chance.” Organizational behavior and
human decision processes, 81(1): 11-131. doi:10.1006/obhd.1999.2868
Bruine de Bruin, W., Manski, C. F., Topa, G., & van der Klaauw, W. (2011). Measuring
consumer uncertainty about future inflation. Journal of Applied Econometrics, 26, 454-478.
doi: 10.1002/jae.1239
Bruine de Bruin, W., van der Klaauw, W., & Topa, G. (2011). Expectations of inflation: The
biasing effect of thoughts about specific prices. Journal of Economic Psychology, 32,
834-845. doi: 10.1016/j.joep.2011.07.002
Bruine de Bruin, W., van der Klaauw, W., Topa, G., Downs, J. S., Fischhoff, B., & Armantier,
O. (2012). The effect of question wording on consumers’ reported inflation expectations.
Journal of Economic Psychology, 33: 749-757. doi: 10.1016/j.joep.2012.02.001
Bruine de Bruin, W., van der Klaauw, W., van Rooij, M., Teppa, F., & de Vos, K. (2016).
revise (Working Paper No. 506). Retrieved from De Nederlandsche Bank website:
http://www.dnb.nl/en/news/dnb-publications/dnb-working-papers-series/dnb-working-papers/working-papers-2016/dnb338622.jsp.
Converse, Jean M., and Stanley Presser. 1986. Survey questions. Handcrafting the standardized
questionnaire. Thousand Oaks, CA: Sage Publications
Daraz, L., Macdermid, J. C., Wilkins, S., Gibson, J., & Shaw, L. (2011). The quality of websites
addressing fibromyalgia: An assessment of quality and readability using standardized tools.
British Medical Journal Open, 1, 1-10. doi: 10.1136/bmjopen-2011-000152
Dillman, Don. A., Jolene D. Smyth, and Leah M. Christian. 2009. Internet, mail, and
mixed-mode surveys. The tailored design method. 3rd ed. Hoboken, NJ: Wiley.
Dominitz, J., & Manski, C. F. (2007). Expected equity returns and portfolio choice: Evidence
from the Health and Retirement Study. Journal of the European Economic Association,
5(2-3), 369-379. doi: 10.1162/jeea.2007.5.2-3.369
Dominitz, J., & Manski, C. F. (2011). Measuring and interpreting expectations of equity returns.
Journal of Applied Econometrics, 26: 352-370. doi: 10.1002/jae.1225
Fischhoff, B., & Bruine de Bruin, W. (1999). Fifty-fifty = 50%? Journal of Behavioral Decision
Making, 12, 149-163.
Flesch, R. (1948). A new readability yardstick. Journal of Applied Psychology, 32, 221–233. doi:
10.1037/h0057532
Fowler, F. J., Jr. (2004). The case for more split-sample experiments in developing survey
instruments. In S. Presser, J. M. Rothgeb, M. P. Couper, J. T. Lessler, E. Martin, J.
Martin, & E. Singer (Eds.), Methods for testing and evaluating survey questionnaires (pp.
Ganassali, S. (2008). The influence of the design of web survey questionnaires on the quality of
responses. Survey Research Methods, 2(1), 21-32.
Health and Retirement Study. 2012. Data Description.
http://hrsonline.isr.umich.edu/modules/meta/2011/internet/desc/net11_dd.pdf.
Hoffmann, A. O. I., Post, T., & Pennings, J. M. E. (2013). Individual investor perceptions and
behavior during the financial crisis. Journal of Banking & Finance, 37, 60-74. doi:
10.1016/j.jbankfin.2012.08.007
Hurd, M. D. (2009). Subjective probabilities in household surveys. Annual Review of
Economics, 1, 543-564. doi: 10.1146/annurev.economics.050708.142955
Hurd, M., Van Rooij, M., & Winter, J. (2011). Stock market expectations of Dutch households.
Journal of Applied Econometrics, 26, 416-36. doi: 10.1002/jae.1242
Kézdi, G., & Willis, R. J. (2008). Stock market expectations and portfolio choice of American
households. Working paper, Department of Economics, University of Michigan.
Kincaid, J. P., Fishburne, R. P., Jr., Rogers, R. L., & Chissom, B. S. (1975). “Derivation of new
readability formulas (Automated Readability Index, Fog Count and Flesch Reading Ease
Formula) for Navy enlisted personnel, Research Branch Report 8-75,” Millington, TN:
Naval Technical Training, U. S. Naval Air Station, Memphis, TN.
Knäuper, B., Belli, R. F., Hill, D. H. & Herzog, A. R. (1997). Question difficulty and
respondents’ cognitive ability: The effect on data quality. Journal of Official Statistics,
13, 181-199.
Lenzner, T. (2012). Effects of survey question comprehensibility on response quality. Field
Manski, C. F. (2004). Measuring expectations. Econometrica, 72(5), 1329-1376. doi:
10.1111/j.1468-0262.2004.00537.x
Markowitz, H. (1952). Portfolio selection. The Journal of Finance, 7(1), 77-91. doi:
10.1111/j.1540-6261.1952.tb01525.x
Neuhauser, L., & Paul, K. (2011). Readability, comprehension, and usability. In B. Fischhoff, N.
T. Brewer, & J. S. Downs (Eds.), Communicating Risks and Benefits: An Evidence-Based
User’s Guide (129-148). Washington, DC: Food and Drug Administration.
Poterba, J., Rauh, J., Venti, S. & Wise, D. (2007). Defined contribution plans, defined benefit
plans, and the accumulation of retirement wealth. Journal of Public Economics, 91(10),
2062-2086. doi: 10.1016/j.jpubeco.2007.08.004
Presser, S., Couper, M. P., Lessler, J. T., Martin, E., Martin, J., Rothgeb, J. M., and Singer, E.
(2004). Methods for testing and evaluating survey questions. In S. Presser, J. M. Rothgeb,
M. P. Couper, J. T. Lessler, E. Martin, J. Martin, and E. Singer (Eds.), Methods for
Testing and Evaluating Survey Questionnaires (1-22). Hoboken, NJ: John Wiley & Sons,
Inc. doi: 10.1002/0471654728.ch1
Sharpe, W. F. (1964). Capital asset prices: A theory of market equilibrium under conditions of
risk. The Journal of Finance, 19(3): 425-442. doi: 10.2307/2977928
Velez, P., & Ashworth, S. D. (2007). The impact of item readability on the endorsement of the
midpoint response in surveys. Survey Research Methods, 1, 69-74.
Vissing-Jorgensen, A. (2003). Perspectives on behavioral finance: Does “irrationality” disappear
with wealth? Evidence from expectations and actions. NBER Macroeconomics Annual,
Weber, M., Weber, E. U., & Nosić, A. (2013). Who takes risks when and why: Determinants of
changes in investor risk taking. Review of Finance, 17: 847-883. doi: 10.1093/rof/rfs024
Young, D. R., Hooker, D. T., & Freeberg, F. E. (1990). Informed consent documents: Increasing
comprehension by reducing reading level. IRB: Ethics and Human Research, 12(3):1-5.
Table 1. Wording of Stock Market Expectation Questions
Wording
Flesch-Kincaid readability statistic Study 1
Original HRS question
By next year at this time, what is the percent chance that mutual fund shares invested in blue chip stocks like those in the Dow Jones Industrial Average will be worth more than they are today?
13.5
Revised question What is the chance that the stock market will be higher in a year than it is now?
4.5
Study 2
Original question By next month at this time, what is the percent chance that mutual fund shares invested in blue chip stocks like those in the Dow Jones Industrial Average will have gained in value by more than 5% compared to what they are worth today?
16.5
Revised question What is the chance that the stock market will be 5% higher in a month than it is now?
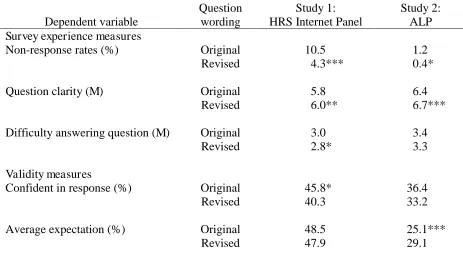
Table 2. Summary of Results
Dependent variable
Question wording
Study 1: HRS Internet Panel
Study 2: ALP Survey experience measures
Non-response rates (%) Original 10.5 1.2
Revised 4.3*** 0.4*
Question clarity (M) Original 5.8 6.4
Revised 6.0** 6.7***
Difficulty answering question (M) Original 3.0 3.4
Revised 2.8* 3.3
Validity measures
Confident in response (%) Original 45.8* 36.4
Revised 40.3 33.2
Average expectation (%) Original 48.5 25.1***
Revised 47.9 29.1
Note. Question clarity was rated from 1 (“Not clear at all”) to 7 (“Very clear”). Difficulty
answering the question was rated from 1 (“Not hard at all”) to 7 (“Very hard”). Confidence in response was measured as the proportion of respondents who stated “I am very sure about the
chance” or “I am pretty sure about the chance,” versus the proportion who stated “I actually have
Figure 1. Distribution of Expectations in Study 1
Figure 2. Distribution of Expectations in Study 2
Endnotes
1 The Flesch-Kincaid formula is: 0.39 * (total words / total sentences) + 11.8 * (total syllables /
total words) – 15.59.
2 Many other readability statistics require more text than is available in this context. For
example, the Fry method requires at least two 100-word samples.
3 This question reads, “The next question is about investing in the stock market. Please think
about the type of mutual fund known as a diversified stock fund. This type of mutual fund holds
stock in many different companies engaged in a wide variety of business activities. Suppose that
tomorrow someone were to invest one thousand dollars in such a mutual fund. Please think about
how much money this investment would be worth one year from now. What do you think is the
percent chance that this one thousand dollar investment will increase in value in the year ahead,
so that it is worth more than one thousand dollars one year from now?”
4 Five respondents did not report their educational attainment, and are omitted from this
calculation.
5 We thank an anonymous reviewer for suggesting that we explore the difference in non-response
rates between published research on the HRS and our survey.
6 As shown, average responses reflect a high number of 50% responses. Omitting 50%
responses, the average response was 17.9% (SD = 18.8) for the original version and 21.9% (SD =