Int. J. Electrochem. Sci., 7 (2012) 11123 - 11136
International Journal of
ELECTROCHEMICAL
SCIENCE
www.electrochemsci.org
The Electrochemical Behaviour of Brass in NaHSO
3Solution
Without and With Cl
-Q. Liu1,2, H.Luo1,2, C. F. Dong 1,2,*, K. Xiao 1,2, X. G. Li 1,2 1
Corrosion and Protection Center, University of Science and Technology Beijing, Beijing, China 2
Key Laboratory for Corrosion and Protection (MOE), Beijing, China *
E-mail: [email protected]
Received: 12 September 2012 / Accepted: 9 October 2012 / Published: 1 November 2012
The electrochemical behaviour of brass in NaHSO3 solution without and with Cl- was investigated by potentiodynamic polarization and cyclic voltammetry techniques. The results indicated brass dissolution was accelerated with HSO3- concentration increasing. And the first stable region in polarization curves was attributed to adsorbed layers, while the other to the formation of copper oxides. In the mixed solution containing HSO3- and Cl-, when the potential is under -0.2 VSCE, HSO3-, the dominant factor influencing the corrosion behaviour of brass, inclines to make brass stable; while Cl- becomes the leading aspect above -0.2 VSCE by destroying protective layers.
Keywords: Brass, Polarization, Cyclic Voltammetry, SEM
1. INTRODUCTION
Zn(II), respectively. With the positive shift of potential, current increased abruptly as a result of a simultaneous dissolution of both copper and zinc. And two more anodic peaks were observed, corresponding to the formation of Cu2O/CuCl and CuO[1], respectively, at even higher potential.
On the other hand, with the environmental pollution due to the speedy development of the industry, SO2 is becoming an important factor influencing the performance and the service life of mechanical components by considerable corrosion damage [10-12]. Many studies have been worked on about copper and its alloys in the solution containing SO42-. Fonseca[13]suggested that SO42- ions could promote the film formation in the passive range and increase the amount of soluble Cu species. It was found that a transition region appeared in the cyclic voltammetry due to the formation of adsorbed species, like Cu(SO4)ads2-, or Cu(OH)ads- on the sample surface [14]. Moreover, according to the obtained curves, the anodic current densities were enhanced with the increase of Zn content. In acid chloride and sulphate media, O2 mainly reduced to H2O directly as a cathodic reaction[15,16].
On the other hand, the fact that SO2 accelerates atmospheric corrosion is primarily ascribed to the strong depolarizing agent H2SO3 generated after SO2 being adsorbed in water. So, the NaHSO3 solution was employed to simulate the industrial environments with SO2. There are limited investigations concerning the effect of HSO3- on the corrosion and electrochemical behaviour of brass, less mention on the cooperation of HSO3- and Cl-. The aim of this work is to investigate the electrochemical behaviour of brass in NaHSO3 solution without and with Cl- by polarization curves, cyclic voltammetry (CV) and scanning electron microscopy (SEM). It is anticipated that this research would provide the essential insight for the future protection of brass in the environment containing both SO2 and Cl-, like the industrial district in the offshore area.
2. EXPERIMENTAL
2.1 Preparation of samples and solutions
The brass samples, with the dimension of 10 mm ×10 mm ×3 mm, were used and the chemical composition was Cu (61.56 wt. %), Zn (38.43 wt. %) with Pb balance. After being welded to copper wire to assure the electric connection for electrochemical measurement, the samples were embedded into epoxy resin, leaving an exposed area of 1 cm2. Prior to electrochemical measurements, samples were sequentially ground with silicon carbide emery paper up to 2000 grit, then rinsed with deionised water and alcohol and dried by cool air.
Analytical-grade NaHSO3, NaCl and triply distilled water were used for preparing solutions. The concentrations used in this experiment were as follows: 0.01 M, 0.05 M, 0.1 M, 0.2 M and 0.4 M NaHSO3 with/without 0.1 M NaCl.
2.2 Electrochemical measurements
electrode. Electrochemical measurements were carried out with Princeton Applied Research-VMP3 electrochemical system at 25 ºC.
Polarization measurements were carried out by shifting the potential from -0.6 V (vs. open circuit potential-OCP) to +0.6 VSCE with a scan rate of 1 mV/s. For CV measurements, a potential sweep from -1.0 VSCE to +0.6 VSCE and then back to -1.0 VSCE with a scan rate of 10 mV/s was used. After polarization measurements, surface morphologies of samples were observed by SEM. Each experiment was performed in a freshly prepared solution and with a newly ground electrode surface.
3. RESULTS AND DISCUSSION
3.1 The electrochemical behaviour of brass in NaHSO3 solution 3.1.1 The potentiodynamic polarization of brass
-5 -4 -3 -2 -1 0 1
-1.2 -0.8 -0.4 0.0 0.4
Peak 2
E
/
V
vs
.
S
C
E
log |i| / mA
cm
-20.01 M NaHSO3 0.05 M NaHSO3 0.1 M NaHSO3 0.2 M NaHSO3 0.4 M NaHSO3
Peak 1
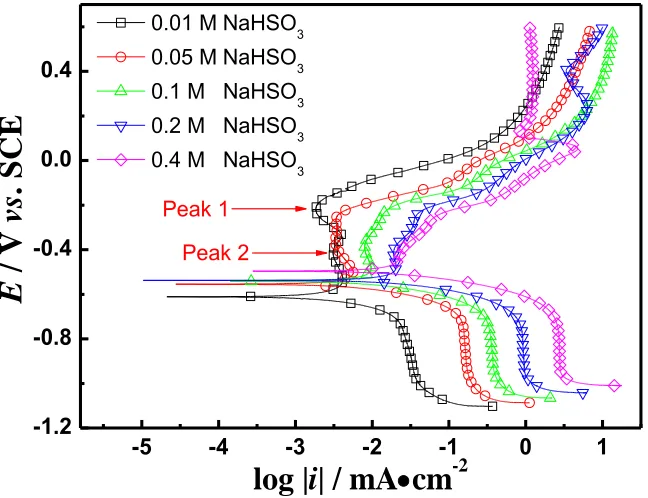
Figure 1. Polarization curves of brass in different concentrations of NaHSO3 solution, scan rate: 1 mV/s.
Fig. 1 shows the polarization curves of brass in NaHSO3 solutions. It is apparent that the corrosion potential (Ecorr) shifts to more noble value with the increase of NaHSO3 concentration. The anodic current density and the cathodic current density increase greatly, indicating that both the anodic and cathodic reactions are accelerated by adding HSO3- ions in the solution.
[image:3.596.136.460.320.569.2]
reduced directly to H2O via 4-electron pathway [15,16]. This is the case that the cathodic process is totally controlled by diffusion process, which prevents linear extrapolation of cathodic curves.
+
-2 2
O +4H +4e 2H O
(1)
For the anodic process, in the polarization curves obtained in the 0.01 M NaHSO3 solution, two anodic current density peaks can be observed in the potential range from -0.55 VSCE to -0.2 VSCE, as shown in Fig. 1. One peak is at about -0.22 VSCE (Peak 1) with the value of 1.9 μA•cm-2 and the other at about -0.41 VSCE (Peak 2) with 3.1 μA•cm-2. And the values at peaks just slightly deviate from the average current density (about 3.2 μA•cm-2
) in this region, revealing a passivation phenomenon. On the other hand, the fluctuant current densities indicate that there is a competition of two kinds of reaction: accelerating and inhibiting the metal dissolution rate, respectively. Whenever the former aspect is larger than the later aspect, the current density will increase. While when the two rates equal to each other, the current density will stay stable. When the potential overtakes -0.2 VSCE, the anodic current density increases quickly, revealing that the metal dissolution rate has been sped up a lot and the inhibitive reaction can be negligible.
With the HSO3- concentration increasing from 0.05 M to 0.4 M, there are also two anodic current density peaks appearing on each curve between -0.55 VSCE and -0.2 VSCE, respectively. But both these two current density peaks and the average current density in this region increase with the HSO3- concentration. From another point of view, this indicates that the reaction inhibiting the metal dissolution rate is weakening by the increasing HSO3- concentration. Moreover, the peak current density at about -0.2 VSCE increases more than that at -0.4 VSCE, indicating that this stable range of current density is gradually transforming into an active region. When the potential surpasses -0.2 VSCE, the anodic current density increases quickly. However, as for the curves obtained in the 0.2 M NaHSO3 solution, the current density begins to drop at 0.24 VSCE though followed by an increase at 0.4 VSCE; while for 0.4 M solution, the current density begins to decrease at 0.05 VSCE, and then keeps stable at 1.2 mA•cm-2
after 0.12 VSCE. As has been discuss above, it can be concluded that in solutions with low and high HSO3- concentration, brass shows different behaviour.
3.1.2 CV curves analysis
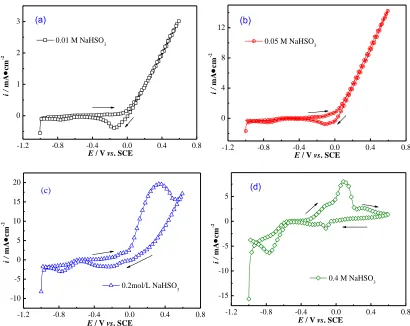
In order to further clarify the HSO3- effect on brass during the polarization process, CV were carried out on brass in the solution with different NaHSO3 concentrations at a scan rate of 10 mV/s (as is shown in Fig. 2). And parts of the CV curves in different potential regions are compared in Fig.3.
-1.2 -0.8 -0.4 0.0 0.4 0.8 0 1 2 3 i / mA cm -2
E / V vs. SCE
0.01 M NaHSO3
(a)
-1.2 -0.8 -0.4 0.0 0.4 0.8 0
4 8 12
E / V vs. SCE
i /
mA
cm
-2
0.05 M NaHSO3
(b)
-1.2 -0.8 -0.4 0.0 0.4 0.8 -10 -5 0 5 10 15 20 i / mA cm -2
E / V vs. SCE
0.2mol/L NaHSO3
(c)
-1.2 -0.8 -0.4 0.0 0.4 0.8 -15
-10 -5 0 5
E / V vs. SCE
i /
mA
cm
-2
0.4 M NaHSO3 (d)
Figure 2. The CV curves obtained in the various concentration of NaHSO3 solution, scan rate: 10mV/s; (a) 0.01 M; (b) 0.05 M; (c) 0.2 M; (d) 0.4 M.
Then a transition region extending up to 0 VSCE, corresponding to the current stable region appeared in the polarization curve in Fig. 1 before the active dissolution of brass occurs. This can be probably ascribed firstly to the formation of adsorbed species Cu (HSO3)-ads on the electrode surface via the reaction:
-
-3 3 ads
Cu+HSO Cu(HSO ) (2)
However, the current density starts to increase due to the dissolution of the absorption layer Cu (HSO3) ads- since HSO3- can be oxidized to SO42- with the increase of polarization potential according to Eq.3 and Eq.4 [17].
-3 2 3
H +HSO H SO (3)
2 + 2 3 2 4 (aq) (aq)
[image:5.596.91.501.75.401.2]
Therefore, the original absorbed HSO3- ions on the sample surface can be replaced by SO42- ions, leading to the appearance of the Cu (SO4)2-ads layer (according to Eq.5 [14]), which decreases current density.
2
2-4 (aq) 4 ads
Cu+SO Cu(SO ) (5)
The formation of this absorption layer corresponds to Peak 2 in the passive region at about -0.21 VSCE in the polarization curves.
Cu (HSO3)-ads or Cu (SO4)2-ads species represent the adsorbed intermediate products for active dissolution. They compete for the adsorption sites at the metal surface, which may promote dissolution or passivation with increasing potential [18]. When the potential over 0 VSCE, the anodic current starts to increase, which can be ascribed to the dissolution process of the absorbed layer and the formation of Cu2 (SO4) (aq.) (Eq.6) [19] and a disproportionation of cuprous ion and the replacement reaction between Znic and copper ions (Eqs. 7~9).
2-
2-4 ads 2 4 (aq.) 4
2Cu(SO ) Cu (SO ) +SO +2e (6)
2+ (aq)
ZnZn +2e (7)
+ 2+ (aq) (aq)
2Cu Cu +Cu (8)
2+ 2+
(aq) (aq)
Cu +ZnZn +Cu (9)
Cu2+ is further replaced by Zinc to redeposit on the substrate, which increases the cathodic area, resulting in the formation of active galvanic couples and the increase in the corrosion rate of brass [18].
The reverse scan shows a cathodic peak 1 (in Fig.3(b)) recorded at −0.15 VSCE, which is due to the reduction of copper ions. And another cathodic peak at −0.76 VSCE corresponds to the electro-reduction of the dissolved oxygen.
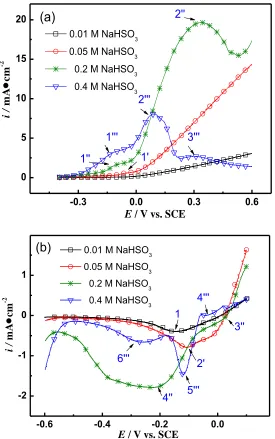
The CV for brass in 0.2 M NaHSO3 solution is shown in Fig. 2(c). The current density shoulder 1’’, corresponding to the formation of Cu(SO4)2-ads, is still higher than that in lower NaHSO3 concentration solutions. This may be due to the acceleration of the oxidation reaction of HSO3-, leading to an approximate H2SO4 surrounding on the sample surface and an increase of the solution aggressiveness. Due to the dissolution of absorbed layer, the current increases sharply until the polarization potential shifts up to 0.336 VSCE (peak 2’’ in Fig. 3a), at which CuO begins to form though Eq.10 [20] and leads to a decrease in the current.
2
Cu+H O CuO+2H2e
-0.3 0.0 0.3 0.6
0 5 10 15 20 i / mA cm -2 1'
E / V vs. SCE 0.01 M NaHSO3
0.05 M NaHSO3 0.2 M NaHSO3 0.4 M NaHSO3
1''' 2'' 3''' 2''' 1''
(a)
-0.6 -0.4 -0.2 0.0
-2 -1 0 1 5''' 1
0.01 M NaHSO3
0.05 M NaHSO3
0.2 M NaHSO3
0.4 M NaHSO3
i /
mA
cm
-2
E / V vs. SCE
[image:7.596.156.431.77.516.2]4''' 2' 6''' 4'' 3'' (b)
Figure 3. Part of the CV curves obtained in various concentrations of NaHSO3 solution, 10mV/s: (a) -0.4 V ~ 0.6 V in the positive scan; (B) 0.1 V~ -0.6 V in the reverse scan.
Therefore, the cathodic peak 3’’ (in Fig. 3(b)) recorded at 0.03 VSCE is due to the reduction of CuO, while another cathodic peak at −0.2 VSCE is related to the reduction of copper ions. Cathodic peak,corresponding to the electro-reduction of the dissolved oxygen, is at -0.76 VSCE.
As for the CV curve obtained in 0.4 M NaHSO3 solution, still the current density shoulder 1’’’ is attributable to Cu(SO4) (aq.)2-. A new anodic current density peak 2’’’ (shown in Fig. 3b) appears on the obtained curve except peak 3’’’, which is due to CuO. The formation of Cu2O on the sample surface can be an explanation for the peak 2’’’. The reaction is shown in Eq.11 [20].
2 2
2Cu+H O Cu O+2H2e
In this case, the peak 4’’’, 5’’’ and 6’’’ in the reverse scan (as shown in Fig.3(b)) are attributed to the reduction of CuO, Cu2O and copper ions respectively.
It is concluded that brass is inclined to be more active with the increase of HSO3- concentration in the low potential range. On the other hand, the formation of CuO and Cu2O at the high potential range in the solution with high HSO3-concentration greatly enhances the corrosion resistance of brass, which results in the relatively stable current density even with the increase of the applied potential. Therefore, brass can be protected either because of the absorbed layer or the copper oxides.
3.2 The electrochemical behaviour of brass in mixed solution with Cl- and HSO3-
-5 -4 -3 -2 -1 0 1
-0.8 -0.4 0.0 0.4
log |i| / mA
cm
-2E
/
V
vs
.
S
C
E
0.4M NaHSO 3 0.4M NaHSO
3 +0.1M NaCl
[image:8.596.144.442.253.493.2]0.1M NaCl
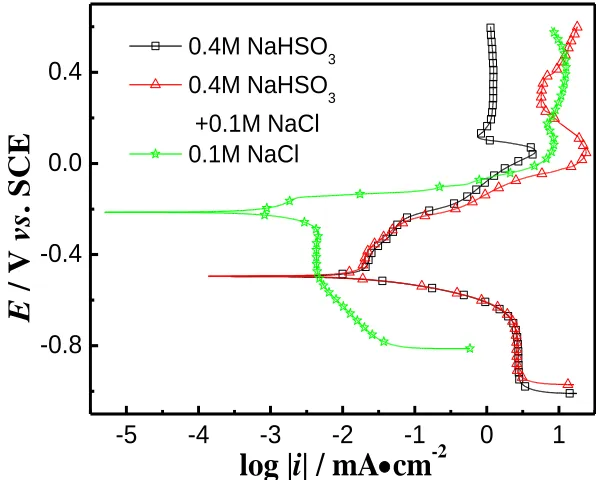
Figure 4. Polarization curves of brass in different electrolytes, scan rate: 1 mV/s.
Fig.4 shows the polarization curves of brass obtained in mixed solution containing 0.1 M NaCl + 0.4 M NaHSO3, 0.1 M NaCl solution and 0.4 M NaHSO3 solution, respectively. With the existence of HSO3- ions in the solution, obviously, Ecorr shifts to a more negative value and icorr (about 10.4 μA•cm-2
) is 20 times higher than that in the solution without HSO3- ions (about 0.6 μA•cm-2), which points out the dissolution of brass was accelerated by adding HSO3- ions.
It is worth noting that the similar polarization character is observed for brass in NaHSO3 solutions with and without Cl- when the potential is below -0.2 VSCE [1]. This suggests that, in this potential range, the corrosion mechanism of brass in the mixed solution is the same as that in NaHSO3 solution. In this case, HSO3- is the main factor influencing the electrochemical behaviour of brass.
the stable region of current density at high potential in the 0.4 M HSO3- solution disappears in the presence of Cl-. This indicates that Cl- begins to involve in the polarization process in the mixed solution containing both HSO3-and Cl-, and has more influence than HSO3- in high potential region.
As mentioned above, the presence of HSO3- accelerates corrosion rate of brass, while the existence of aggressive Cl- can break down the protective film formed on the sample surface[23]. Therefore, in the mixed solution containing HSO3-and Cl-, HSO3- (or Cl-) is the dominant factor when the potential below (or above) -0.2 VSCE.
3.2.1 HSO3- as the main factor in mixed solution containing HSO3-and Cl-
-5 -4 -3 -2 -1 0 1 2
-1.2 -0.8 -0.4 0.0 0.4
E
/
V
vs
.
S
C
E
log |
i
| / mA
cm
-20.1 M NaCl+0.01 M NaHSO3
0.1 M NaCl+0.05 M NaHSO3
0.1 M NaCl+ 0.1 M NaHSO3
0.1 M NaCl+ 0.2 M NaHSO3
[image:9.596.133.459.252.501.2]0.1 M NaCl+ 0.4 M NaHSO3
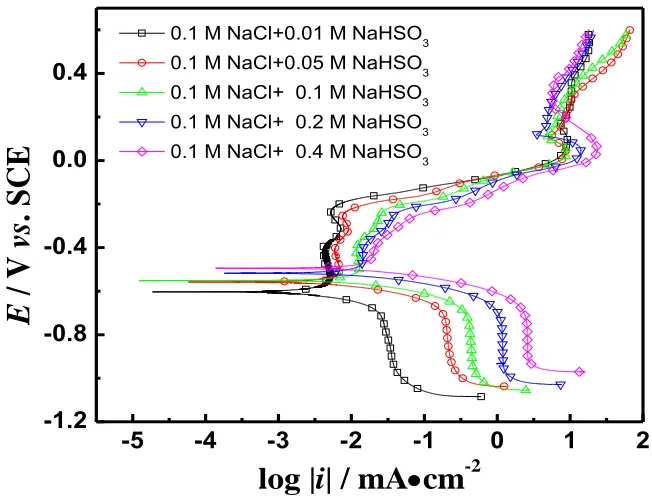
Figure 5. Polarization curves of brass in different concentration of NaHSO3 solution with 0.1 M NaCl, scan rate: 1 mV/s.
Fig.5 shows the polarization curves of brass obtained in various NaHSO3 solutions with 0.1 M Cl-. Compared with Fig.1, it indicates that in each concentration of NaHSO3 solution, similar polarization curves of brass are obtained with and without Cl- when the potential is below -0.2 VSCE.
The same phenomenon happens to icorr and iL as well, as seen in Fig.6(b) and(c). Though they increased with the HSO3- concentration, very corresponding parameter value obtained in the mixed solution is pretty much the same as that obtained in the NaHSO3 solution. All has been stated above confirms that HSO3- is the dominant factor instead of Cl- when the potential is below -0.2 VSCE in the mix solution with HSO3-and Cl-. The specific influence of HSO3- on the corrosion behaviour of brass can be referred in the 3.1.
Figure 6. Comparison of electrochemical several corresponding parameters obtained in NaHSO3 solution and in the mixed solution. (a) Ecorr;( b) icorr;(c) iL; (d) ia.
3.2.2 Cl- as the main factor in mixed solution containing HSO3-and Cl-
As stated above, Cl- is the major factor influencing the corrosion behaviour when the applied potential overtakes -0.2 VSCE. The most direct evidence is the noticeable increase in ia in the solution with Cl-, as can be seen in Fig.6. For instance, ia were 1.8 mA·cm-2 and 12.0 mA·cm-2, respectively, in the 0.1 M NaHSO3 solution and in the solution with Cl-.
It is noticed that when the polarization potential surpassed -0.2 VSCE, the anodic current density begin to increase sharply, indicating that protective layer Cu (SO4) ads2- on the sample surface began to
(a)
(b)
dissolve (according to Eq.6) as well as the replacement reaction between Cu and Zn (according to Eqs. 7 ~ 9) as has been stated in 3.1.2. Moreover, the dissolution of Cu and ZnClads- also results in the current density increasing, according to the following reactions [8, 9]:
-
-2
Cu+2Cl CuCl +e (14)
- -
-ads ads 2
ZnCl +Cl ZnCl +2e (15)
- 2- -ads 4
Zn+4Cl ZnCl +2e (16)
When the potential reaches about 0 VSCE, the increase in current density begins to slow down, mainly due to the formation of Cu2O and CuO on the electrode surface according to Eq. 17[24] and Eq.18 [20].
- - +
2 2 2
2CuCl +H OCu O+4Cl +2H (17)
2 2
Cu O+H O2CuO +2H2e
(18)
Moreover, since the solubility of CuCl-ads is low, a porous film of CuClads can be formed after CuCl-ads precipitating at the surface of the electrode [25]. Eventually, the current density decreases at 0.09 VSCE.
However, these protective products would transfer to soluble complex CuCl2- and ZnCl42- (according to Eq.19 and 20 [8]), leading to an inclination of increasing in the current density. Consequently, the simultaneous formation and dissolution of protective products result in the “S” shape in the anodic polarization curve at high potential region.
-
-ads 2
CuCl +Cl CuCl (19)
2-
-2 4
CuO+Zn+4Cl +H O Cu+ZnCl 2OH (20)
Considering what has been discussed above, the existence of Cl- leads to the inclination of formation of soluble products, like CuCl2- and ZnCl42-, to take place of protective products, like CuClads and CuO on the surface. Therefore, Cl- accelerating the dissolution rate of brass is mainly by destroying protective layer on the sample.
3.3 SEM and EDS results
[image:12.596.93.508.183.360.2]
explanation of the electrochemical behaviour of brass in the electrochemical measurements. Moreover, as can be seen, relatively minor corrosion is observed due to the formation of protective film on the electrode surface in the NaHSO3solution without Cl-. However, corrosion products with irregular shapes are obtained in the mixed solution, reflecting the strong aggressive effect of Cl- on protective film, which verifies the conclusion in the 3.2.2 part.
Figure 7. SEM images of brass after polarization in NaHSO3 soltuion (a) 0.01 M NaHSO3; (b) 0.4 M NaHSO3.
Figure 8. SEM images of brass after polarization in NaCl soltuion without and with NaHSO3: (a) 0.1 M Cl- +0.01 M HSO3-; (b) 0.1 M Cl- +0.4 M HSO3-.
[image:12.596.93.505.425.603.2][image:13.596.166.429.116.505.2]
without HSO3-, respectively, which is less than its original content in brass (about 38%), revealing the dezincification in polarization process.
Figure 9. EDX analysis of the corrosion products of brass after polarization in: (a) 0.1 M NaCl; (b) 0.2 M NaHSO3 + 0.1M NaCl.
4. CONCLUSIONS
In the NaHSO3 solution, the corrosion rate of brass increases with HSO3- concentration increasing. However, HSO3- inclines to lead brass to a stable state either in low concentration of or in higher concentration of HSO3-. The first passive region is attributed to the adsorbed layer consisting of Cu (HSO3) -ads or Cu (SO4) 2-ads. And the appearance of another stable region at more noble potentials can be ascribed to the formation of CuO or Cu2O layer.
potential disappears. This is ascribed that Cl- can destroy and inhibit the formation of protective film on the sample.
ACKNOWLEDGMENTS
This work is supported by the Fundamental Research Funds for the Central Universities (No. FRF-TP-11-006B) and the National Natural Science Foundation of China (No.51131005, 50771020)
References
1. K. Xiao, C. F. Dong, H.Luo, Q. Liu, X. G. Li, Int. J. Electrochem. Sci.7(2012) 7503. 2. A.M. Alfantazi, T.M. Ahmed and D. Tromans, Mater.Des. 30(2009) 2425.
3. Z. Mountassir, A. Srhiri, Corros.Sci. 49(2007) 1350.
4. W.A.Badawy, S.S. El-Egamy and A.S. El-Azab, Corros.Sci. 37(1995) 1969. 5. M. Scendo, Corros.Sci. 47(2005) 2778.
6. M. Scendo, Corros.Sci. 47(2005) 1738.
7. G. Bianchi, P. Longhi, Corros.Sci. 13(1973) 853.
8. M. Kabasakaloglu, T.Kiyak, O.Sendil and A.Asan, Appl.Surf.Sci.193(2002) 167.
9. S. S. Abd. El-Reuim, F. H.Assaf, A.El-Sayed and A. M. Zaky, Br.Corros.J.1995(30) 297. 10.M. Watanabe, Y. Higashi and T. Ichino, J. Electrochem.Soc. 150(2003) B37.
11.R.B.Comizzoli, R.P.Frankenthal, P.C.Milner and J.D.Sinclair, Science. 234(1986) 340. 12.Z.Y.Chen, C.Y.Leygraf, D.Y.Persson and S.Y.Zakipour, 61(2005) 1022.
13.I.T.E.Fonseca, A.C.S. Marin and A.C. Sá, Electrochim.Acta. 37(1992) 2541. 14.K.M. Ismail, R.M. Elsherif and W.A. Badawy, Electrochim.Acta. 49(2004)5151. 15.K.Balakrishnan, V.K. Venkatesan, Electrochim.Acta. 24(1979) 131.
16.M.A. Amin, K.F. Khaled, Corros.Sci. 52(2010) 1194.
17.J.G.Speight, Lange's Handbook of Chemistry (16th Edition), McGraw-Hill.
18.V.P. Parkhutik, J.M. Albella, and J.M. Martinez-Duarte, 1992, Plenum Press: New York. 19.K.M.Ismail, A.M. Fathi and W.A. Badawy, Corrosion. 60(2004) 795.
20.M.Pourbaix, NACE, Houston, TX, 1974.
21.H. Luo, C.F. Dong, X.G. Li, K. Xiao, Electrochim.Acta. 64(2012)211. 22.J.H.Wang, C.C.Siu, Z.Szklarska-Smialowska. Corrosion. 44 (1988)732. 23.C.-O.A. Olsson, D. Landolt, Electrochim.Acta. 48(2003)1093.
24.A.L. Bacarella, J.C. Griess, J. Electrochem.Soc. 120(1973)459. 25.F.Crundwell, Electrochim.Acta. 36(1991) 2135.