Environmental Research Letters
LETTER • OPEN ACCESS
Advancing global flood hazard simulations by
improving comparability, benchmarking, and
integration of global flood models
To cite this article: Jannis M Hoch and Mark A Trigg 2019 Environ. Res. Lett. 14 034001
View the article online for updates and enhancements.
Recent citations
Can regional to continental river hydrodynamic models be locally relevant? A cross-scale comparison
Ayan Fleischmann et al
comparability, benchmarking, and integration of global
fl
ood models
Jannis M Hoch1,2
and Mark A Trigg3
1 Department of Physical Geography, Faculty of Geosciences, Utrecht University, the Netherlands 2 Unit Surface Water Systems, Deltares, Delft, the Netherlands
3 School of Civil Engineering, Faculty of Engineering, University of Leeds, Leeds, United Kingdom
E-mail:[email protected]
Keywords:globalflood models, model validation, framework,flood risk management, model intercomparison
Abstract
In recent years, a range of global
flood models
(
GFMs
)
were developed, each utilizing different process
descriptions as well as validation data sets and methods. To quantify the magnitude of these
differences, studies assessed the performance of GFMs only on the continental and catchment level.
Since the default model set-ups resulted in locally marked deviations, there is a clear need for further
and especially more standardized research to not only maintain credibility, but also support the
application of GFM products by end-users. Consequently, here we conceptually outline the basic
requirements and challenges of a Global Flood Model Validation Framework for more standardized
model validation and benchmarking. With the proposed framework we hope to encourage the much
needed debate, research developments in this direction, and involvement of science with end-users.
By means of the framework, it is possible to streamline the data sets used for input and validation as
well as the validation approach itself. By subjecting GFMs to more thorough and standardized
methods, we think their quality as well as acceptance will increase as a result, especially amongst
end-users of their outputs. Otherwise GFMs may only serve a purely scientific purpose of continued
‘
siloed
’
model improvement but without practical use. Furthermore, we want to invite GFM developers to
make their models more integratable which would allow for representation of more physical processes
and even more detailed comparison on a model component basis. We think this is pivotal to not only
improve the accuracy of model input data sets, but to focus on the core of each model, the process
descriptions. Only if we know more about why GFMs deviate, are we able to improve them accordingly
and develop a next generation of models, not only providing
first-order estimates of
flood extent but
supporting the global disaster risk reduction community with more accurate and actionable
information.
1. Introduction
Economic damage and casualties due to flooding increased remarkably in recent decades. Due to a combination of factors, such as population growth, urbanisation, and a changing climate,flood risk will continue to rise world-wide(Munich Re2010, Ceola et al2014, Winsemiuset al2016). For the implemen-tation of improvedflood risk management as well as efficient adaptation and mitigation measures a better understanding of the processes drivingflood events is required. With most riverineflood events
simultaneously impacting multiple neighbouring countries and catchments (Jongman et al 2014), declining availability of observed discharge data, and increasing computational power, the benefit of using globalflood models(GFMs)was recognized as a key tool in tackling these challenges. Hence, their devel-opment and application increased rapidly in recent years(Wardet al2015, Bateset al2018).
All available GFMs arefit for the purpose of mod-elling globalflood hazard and risk and validated to some extent during their development and dissemina-tion. Yet, they all inherently have, depending on their OPEN ACCESS
RECEIVED
10 August 2018
REVISED
10 November 2018
ACCEPTED FOR PUBLICATION
26 November 2018
PUBLISHED
19 February 2019
Original content from this work may be used under the terms of theCreative Commons Attribution 3.0 licence.
Any further distribution of this work must maintain attribution to the author(s)and the title of the work, journal citation and DOI.
governing processes and structure, distinct properties, strengths, and weaknesses. Since validation data, per-iod, and location are usually not consistent between GFM description studies, model differences do not directly become visible while in fact they can result in locally remarkable deviations when compared with each other(Trigget al2016, Bernhofenet al2018).
In contrast to GFMs, other modelling groups are ahead in benchmarking model schemes and compo-nents. For instance, global hydrologic models and their components are regularly compared, such as their routing scheme(Zhaoet al2017)or simulated runoff(Becket al2017). Also, the land model commu-nity initiated a benchmarking project with regular meetings(Hoffmanet al2017)and the climate model community even developed a downloadable diagnost-ic and performance metrdiagnost-ics tool for routine evaluation of models (Eyring et al 2016). Such model inter-comparison projects are a great way to narrow the above-mentioned knowledge gap, let alone the stimu-lus for intensified scientific collaboration and exchange. To our knowledge, there is no such detailed comparison yet for GFMs besidesfirst benchmarking efforts focussing on overall model only (Trigg et al
2016, Bernhofenet al2018). Consequently, it is fair to say that GFMs are behind in terms of collaborative testing as they lack of more consistent and regular comparison, hampering a better understanding of the discrepancies in model outputs. This epistemic uncer-tainty could, we postulate, lead to problematic model equifinality as results may agree only coincidentally.
A better understanding of why and where each model may or should be used is, however, pivotal. Dis-cerning not only a model’s strengths, but also its uncertainties, limitations, and differences with respect to other models is a central pillar to put model outputs into perspective and increase their credibility. By vir-tue of a transparent comparison process with other models, individual model developers can see more clearly how to improve their own data sets and process representation where they may see these lacking.
Since the relative accuracy would become more tangible, the meaningfulness and applicability of each model for end-users would increase too. Various workshops aimed at bringing together researches and practitioners provide evidence that there is a growing demand for more transparency and better overview of GFMs as well as their characteristics and uncertainties (Salamonet al2016, Salamonet al2017, Willis Towers Watson2018). This is particularly important for non-expert users of model outputs who rely on a clear understanding of the appropriateness and limitations in order to use the data appropriately(Wardet al2015, Trigget al2016).
So, what are some possible ways forward?First, to facilitate obtaining the required understanding, an easily accessible yet demanding validation and bench-marking framework could create a meaningful
starting point. This need is demonstrated by similar developments, for instance towards a framework for operationalflood risk management(Alfieriet al2018), as well as from the above-mentioned need of end-users to get a better grasp of model properties. Second, models are in almost all cases closed systems where output is produced based on the input provided and the subsequent model steps executed. While this works well for default model applications, it hampers the model’s extension and integration with new fea-tures, components or even other models. In times of continued model integration, however, establishing links with other models via interfaces such as the application programming interface, open modelling interface or basic model interface(BMI)can facilitate including additional(physical and non-physical) pro-cesses simulated by other models.
In the remainder of this article, wefirst present a range of state-of-the art GFMs and outline their specific properties. Second, we assess the different validation data sets, periods, and locations of these GFMs as published in peer-reviewed papers to sup-plement our call for streamlined validation approa-ches. Subsequently, we sketch a possible design of a Global Flood Model Validation Framework for model validation and benchmarking. Last, motiv-ation and possible approaches to advance the open-ness and integration capability of GFMs is presented. The article is ended with conclusions, ideas on how to implement the presented ideas and recommenda-tions for further improvement of comparability and applicability.
2. Current GFMs
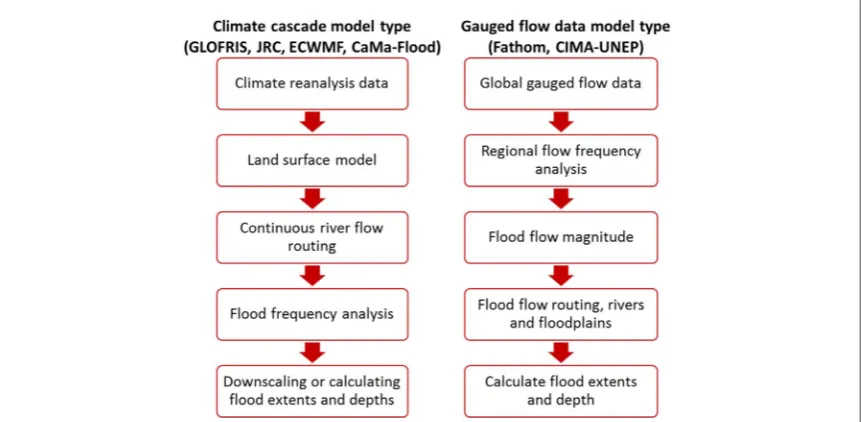
Currently, the openly accessible state-of-the-art GFMs are CaMa-Flood (Yamazaki et al 2011), GLOFRIS (Winsemius et al 2013), JRC (Dottori et al 2016), CIMA-UNEP(Rudariet al2015), as well as the Fathom model(formerly SSBN; Sampsonet al2015)and the ECMWF model (Pappenberger et al 2012). These models can be divided into two main categories of GFMs, depending on theflow derivation modelling steps taken(figure1).
It must be noted that there is also a number of pri-vate or national CAT models(‘catastrophe models’) that include globalflood hazard, each also having its own properties, modelling cascades, and evaluation procedure and criteria. Obtaining information about these CAT models is, however, complicated due to the protection of intellectual property (IP) rights and competitive commercial advantage. The following comparison therefore represents only the most open models and may need updating in the future if these commercial models become more transparent.
The differing operations at various model stages result in a range of modelling approaches, each one
using its own input data, method of calculatingfl ood-plain inundation, and spatial resolution. For instance, GLOFRIS runs at a 30 arcmin spatial resolution before post-processing and downscaling to 1 km, whereas the Fathom model yields output directly at 90 m globally. Such discrepancy in spatial resolution is possible because the models simulate processes with different scaling potential(Bierkenset al2015). As a result, the models perform differently in these scale-dependent processes. For example, GFMs employing a land sur-face or hydrologic model excel in simulating the dif-ferent water balance components. Contrariwise, the routing schemes of land surface or hydrologic models (typically the kinematic wave approximation)are less sophisticated than hydrodynamic models employing higher-order approximations of full shallow water equations. Therefore, their skill in simulating peak discharge (Zhao et al 2017) or backwater effects (Meadeet al1991), which are critical forflood hazard mapping, is curtailed.
Notwithstanding the differences, all models are applied regularly and used to inform policy-makers aboutflood hazard and risk. GLOFRIS, for example, is applied within the World Resources Institute Aque-duct tool, projecting current and future flood risk across the entire globe (World Resources Institute
2018). The JRC model is applied as part of the Global Flood Awareness System GloFAS(Alfieriet al2013), and the Fathom model was recently used to compare
flood risk with Federal Emergency Management Agency estimates across the continental United States (Winget al2018). CIMA-UNEP was applied for esti-mating current and futureflood risk for the Global Assessment Report of the United Nations Office for Disaster Risk Reduction(Rudariet al2015, UNISDR
2015).
3. META study: validation of GFMs
Before employing a GFM forflood hazard and risk assessments, ideally it should undergo thorough test-ing and validation. Due to the wide range of available observation data sets and depending on the model period as well as study area opted for, all GFMs may obtain good validation results, yet without providing any insight into performance relative to other GFMs. To get a grasp of the differences in model validation, here we detail the various data sets, periods, and locations used for the above-mentioned models.
As table 1 shows, the spread in validation (or benchmarking)data sets used is tremendous. Partially, this can be explained by the particular moment of model publication and the availability of data sets at that time. It also shows that most GFMs are validated against inundation extent, but only a few compare simulated discharge and water surface elevation with observations, although these aspects are important for
flood risk management as well. Besides, the river basins, used for model validation, differ widely between studies as does the number of scientific reports documenting the model development over time.
Trigget al(2016)showed that the GFMs listed in chapter 2 agree only for around a third of simulated
flood extent in Africa. Since there can only be one actual realization of inundation at a time, thisfinding shows that a successful individual validation of models without comparison may be misleading with respect to the accuracy of the resulting inundation maps.
[image:4.595.122.553.63.274.2]Together with the lack of congruency in model validation, the results from Trigget al(2016)bolster the above-made claim that, to really get an idea of why model results deviate and to eventually learn from
Table 1.Overview of validation data sets of discharge, inundation extent, and water surface level(WSL)as used in various scientific studies of GFM development.
GFM Study River basin Period Validation data sets
Discharge Extent WSL
CaMa-Flood Yamazakiet al(2011) Amongst others: Amazon, Congo, Brahmaputra, Rhine, Ob
Varying per basin GRDCa SAR imagery(Hesset al2003); GIEMS
(Prigentet al2007)
—
Yamazakiet al(2012) Amazon 2003–2005 ANEELb GIEMS(Prigentet al2007) Envisat RA-2
Yamazakiet al(2013) Global maps used 1991–2000 GRDC — —
Yamazakiet al(2014) Mekong 2001–2005 Inomata and Fukami(2008); MRCc — MRCc
GLOFRIS Winsemiuset al(2013) Ganges–Brahmaputra 1961–1990 — DFOd —
JRC Dottoriet al(2016) Tocantins, Severn, Thames, Elbe, Po, Niger, Indus, Ganges, Mekong, Irrawaddy
2000–2013 DFO; UNOSAT —
Amongst others: Rhine, Danube, Columbia, Thames, Colorado, Yukon
Local observations, based on
(Hirpaet al2016)
—
CIMA-UNEPe Rudariet al(2015) Colombia, Germany and Thailand — Amongst others: GRDC, RivDISf DFO —
Fathom Sampsonet al(2015)g Bow River, North Saskatchewan, Red Deer; Severn,
Thames
Comparing return periods
— Alberta State Government; JRC model —
Winget al(2017)g Conterminous United States Comparing return
periods
— FEMAh, USGSi —
ECMWF Pappenbergeret al
(2012)g
Various major catchments on all continents Comparing return periods
— Flood hazard maps as used by UNISDR —
aGRDC, Global Runoff Data Centre.
bANEEL, Agencia Nacional de Energia Electrica.
cMRC, Mekong River Commission.
dDFO, Dartmouth Flood Observatory.
eDevelopment and validation of the CIMA-UNEP model was not published in peer-reviewed scientific journals.
fRivDIS, Global River Discharge Database.
gboth studies only performed benchmarks with inundations maps from other inundation models or databases for given return periods.
hFEMA, Federal Emergency Management Agency.
iUSGS, United States Geological Survey.
4
Environ.
Res.
Lett.
14
(
2019
)
each other, more standardized validation and bench-marking procedures could be useful.
4. Establishing a GFM validation
framework
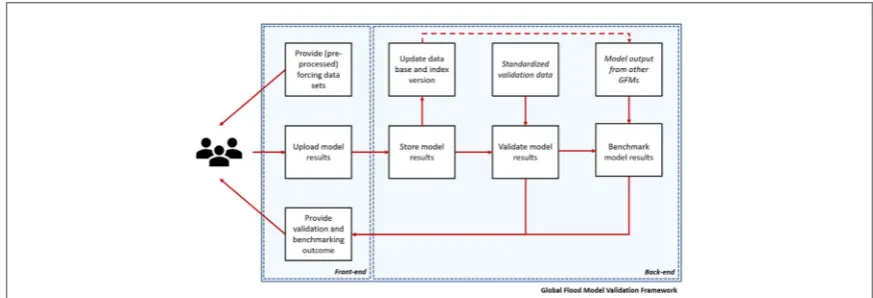
To facilitate standardized validation and benchmark-ing of models and their results, a framework facilitat-ing these steps is needed. A first step towards more systematic benchmarking was set with the GLOFRIM framework by Hoch et al (2017) which allows for forcing different hydrodynamic models with identical hydrologic output. Yet, it can only mark afirst proof-of-concept since much more functionality would eventually be needed. Some key tasks of a Global Flood Model Validation Framework would be, amongst others, to provide a front-end where users can upload model results as well as a back-end to not only execute validation and benchmarking autonomously but also store validation and benchmarking results(figure2). Besides, the framework should provide input data sets to be used for each GFM run.
In its proposed conceptual form, the framework would be designed to only detect differences in simu-latedflood hazard. Since all GFMs employ different ways of how to determine risk by accounting for expo-sure and vulnerability, these aspects should be com-pared at a later stage as well. We here, however, focus on the physical modelling side offlood risk only to keep the scope of the study and proposed framework manageable. Moreover, many end-users such as insur-ance companies do have their own exposure and vul-nerability maps and rely on hazard estimates for risk assessments.
By means of the framework, it would not only be possible to provide standardized input and validation data, but also to clearly define model boundary condi-tions. Using identical data will improve the compar-ability of model validation as this is currently done independently, using different validation data pro-ducts, time periods, and study areas as shown in chapter 3.
4.1. Testing elements
We think it would be essential to test the models for the specific primary aspects listed below, yet this may be extended or altered if needed at any stage:
A.Inundation extent. A key output needed, for instance, by re-insurers to define flood-prone areas and determine premiums for portfolio exposure that intersects with theflood extent.
B.Inundation depth. Model output required by many risk assessments to assess potential damage via a depth-damage curve.
C.Discharge hydrograph. This is the fundamental driver of the out-of-bankflood processes. By subjecting the GFMs to a thorough compar-ison and streamlining their input boundary con-ditions, the impact of the following secondary model aspects can also be tested:
D.Forcing/Input data. Assessing its impact is para-mount to understand to which extent GFM accuracy is defined by model design or input/ forcing data, something not covered by the study of Trigget al(2016).
E.Regionality. Here referred to as a model’s ability to perform in certain regions, differing in their meteorological, geographical, and other proper-ties. Also, this could include an assessment whether GFMs perform well only for large rivers and where the threshold lies in the accurate representation of inundations along smaller reaches.
4.2. Testing challenges
Before establishing the framework, several decisions have to be made and existing challenges addressed, as Alfieriet al (2018)also pointed out. These decisions require but are not limited to the following list:
[image:6.595.116.553.61.210.2](a)Test location. First, is should be clear which river basins are ought to be used. As shown in table1,
most major river basins were already used for validation and thus it would be sensible to use one of them.‘Classic’examples are the Amazon and Ganges–Brahmaputra basin as they both repre-sent large low-lyingfloodplain areas where inun-dations occur regularly. The former is an indicator of performance in simulating large river
flood extents while the latter is particularly relevant from a flood risk perspective due to a large population exposure and vulnerability. To be able to test for regionality, the chosen basins should also differ in their meteorological, geogra-phical, and hydrological properties. Besides, only reasonably large catchments should be used to ensure that all models can sufficiently represent the processes despite differences in spatial resolu-tion. As models and observations improve in resolution, the testing catchment testing scale can be adjusted appropriately.
(b) Forcing data. Despite most model forcing data being openly accessible, a clear decision has to be made which data set shall be used. For models based on meteorology(e.g. GLOFRIS or the JRC and ECMWF models), recent global forcing data such as ERA-Interim or ERA5 should be pro-vided(Berrisfordet al2011, ECMWF2018). In case derivatives such asflood wave hydrographs are required(e.g. Fathom, CIMA-UNEP), pre-processed and possibly bias-corrected data should be made available. In all cases, the data must be downloadable via the front-end of the framework.
(c) Downstream boundaries. Even though not all GFMs can accommodate dynamic sea levels as a downstream boundary condition, we recom-mend that in an initial approach this should be activated to facilitate comparison across default models settings. For advanced comparisons, the effect of changing downstream boundaries can be studied as well by de-activating them or, analo-gously, account for them once model develop-ment allows for it.
More challenging, validation data must be pro-vided which meets the demands for state-of-the-art flood hazard modelling. State-of-the-art in this context also means that all validation data sets used must explicitly address possible uncertain-ties in observations. Hence, these additional aspects should be considered:
(d) Discharge data.Required to validate the models’ skill to simulate discharge dynamics. Depending on the chosen test locations, different sources may be available, either global data sets or from local authorities. In case of the Amazon, for example, discharge data can be retrieved from ORE-HYBAM(ORE-HYBAM2018). One of the few global databases of observed discharge is
maintained by the Global Runoff Data Centre, currently containing data for around 1300 sta-tions(GRDC2018). To provide robust validation results, sufficiently long time series must be available. For those models simulating specific return periods only, corresponding discharge values should be derived from observations. One challenge may emerge from a possible mismatch between gauging station and river network. This issue was already solved for the CaMa-Flood model as described by Zhaoet al(2017)and thus we recommend extending this approach to other GFMs.
(e)Inundation maps. Data ranging across various locations world-wide must be available, prefer-ably open access remotely sensed satellite pro-ducts to maintain global comparability. Since image quality may be hampered by cloud cover (Bernhofenet al2018), this step may require some pre-processing. Alternatively, already pre-pro-cessed maps may be used, for example from the AquaMonitor(Donchytset al2016). Also, maps from the Dartmouth Flood Observatory(http://
floodobservatory.colorado.edu/), the GIEMS data set(Prigentet al2007, Papaet al 2010)or from Tellmanet al(2017)can be used. For those models simulating inundation extent for specific return periods, inundation maps for actual events with corresponding return periods should be used as much as possible for validation, possibly building upon recent methods(Huanget al2014, Giustar-ini et al 2015). Since properties of model and validation maps such as spatial or temporal resolution may deviate, matching model output to observations may be required.
(f)Water levels. To guarantee a globally uniform approach, satellite products should be used, for example ICESAT, ICESAT 2, ENVISAT or SWOT once available. The locations used for validation and benchmarking should be chosen such that potential vertical inaccuracies are limited. Again, the data must be carefully selected and pre-processed, for example to remove measurements affected by land or vegetation signals or differ-ences due to different geoids used by model and satellite.
In a nutshell, the proposed framework’s objectives are threefold:(1)provide forcing data,(2)validate and benchmark model results, and (3) store reference model output per GFM(figure2). Once the user-per-formed simulation runs with the provided forcing data, results can be uploaded via a front-end to the fra-mework’s back-end. Here, both validation and bench-marking will be performed. For the validation, we suggest the following metrics: (i) for inundation extent, the hit ratio H, the false alarm ratio F, and the
critical success index C;(ii)for discharge, the Kling-Gupta-Efficiency KGE(Guptaet al2009)and its indi-vidual components;(iii)for surface water elevation, RMSE. Since these objective functions are only a recommendation, a definite choice should only be made after both developers and end-users agreed on common standards meeting their expectations and needs. This requires involvement of potential end-users in the development of the framework.
To perform the necessary operations, employing the increasing power of cloud computing could be a viable option. For benchmarking purposes, the model results will be stored in cloud-optimized format(for example cloud-optimized GeoTIFF; COG) and ver-sion-controlled according to the version number of tested GFM in a reference data repository, hence con-taining the most recent outputs of GFMs and allowing for tracking the impact of model developments on output. The reference observation data sets will then be used to apply the same objective functions. Once all steps are successfully executed, the resulting validation and benchmark statistics will be made available to the user via the front-end again.
The framework and data could be hosted by a neu-tral institution or other body, for instance within the Global Flood Partnership which already collectedfirst experiences with a common tool for operationalflood risk management (Alfieri et al 2018). Alternatively, such a framework could be hosted under the umbrella of the upcoming Global Risk Assessment Framework which aims at implementing a range of models and with a particularly end-user orientation (UNISDR
2018).
We are aware that setting up such a framework requires both financial and time resources. Yet, we believe that once validation and benchmarking of GFMs is streamlined, they will benefit by reducing uncertainty associated with model output and its application. Using centrally provided data would also enhance the reproducibility of model output, as work
flows and data use would become more transparent. We are confident the efforts made will eventually pay off as model output uncertainty will be reduced while scientific discourse will be improved, leading to better informed decisions and reduced economic damage and casualties.
5. Opening the black box of model code
With the scientific funding bodies increasingly requir-ing research to be openly available, most ( unfortu-nately not all) GFMs can be downloaded freely, advancing the usability and impact of the models. However, even with open code and model output availability, most models follow a‘black box’ model-ling approach of reading input data, executing a prescribed and model dependant set of processes, and thereafter providing output data (figure 1). Such approaches, nonetheless, pose a major limitation to making GFMs more integratable, intuitive, and inter-active due to the lack of process accessibility. However, we consider process integration as key to better comparability as well as future improvements, and thus think that global flood hazard simulations can greatly benefit from opening the black box.
Admittedly, the integration of different models is not rocket science and was already achieved. Models can, for instance, use the output of model A as forcing for model B(Lianet al2007, Biancamariaet al2009, Schumannet al 2013). Such offline-coupling, how-ever, increases overall computation time and may yield large intermediatefiles. Other forms of coupling entail online-coupling where the exchange of variables during model execution and without intermediate
files is hard-coded(Vieroet al2014, Sutanudjajaet al
2017). Clearly, such bespoke model coupling isfit for bespoke purposes, yet it lacks theflexibility to be easily altered for other applications or to be extended with other models or only parts thereof.
To facilitate interactive and intuitive model cou-pling as well as to avoid ‘integronster’, i.e. models whose combined code is hard to disentangle and uncertainties are hard to trace(Voinov and Shugart
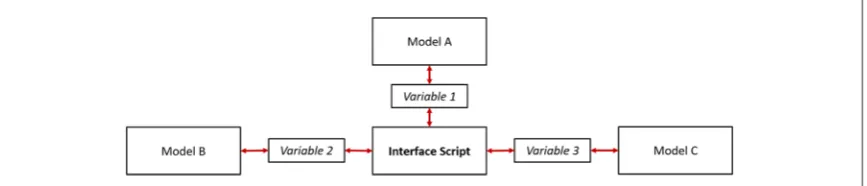
2013), the (BMI; Peckham et al (2013)) provides a powerful andflexible tool to exchange model informa-tion via an (user-defined) interface script (figure 3)
without the need of integrating actual model code into one overarching model as exemplified with the EMELI framework(Peckham2014).
[image:8.595.121.555.64.157.2]The different models can for example be hydro-logic or hydrodynamic models and exchange variables such as runoff or inundation depth, respectively. Yet, also other models could be linked up such as coastal or crop growth models or even non-physical models such as agent-based models.
Within the context of model benchmarking, implementing the BMI functionalities into GFMs may facilitate forcing them with identical data and, in turn, more standardized validation and benchmarking. In addition to the EMELI framework, the applicability of the BMI concept was shown by applying the GLO-FRIM framework to benchmark different hydro-dynamic models(Hochet al2017)as well as different schematizations of the same hydrodynamic model (Hochet al2018).
Unfortunately, none of the above-mentioned GFMs currently contains any BMI functionality (or anything like it). Since the implementation of a BMI is non-invasive, we think more efforts should be directed towards advancing the accessibility of model processes and variables by implementing this interface. In the long term, model integrability via BMI would, besides supporting model validation and benchmarking, allow for a plug-and-play design where applicants can create their‘own’GFM depending on their study spe-cific needs and would also facilitate more efficient modelling efforts. That establishing such a framework is feasible was shown by the examples of EMELI and GLOFRIM.
Conveniently, the proposed framework can help in identifying which components of which models excel. For example, if benchmarking results indicate that Model A may profit from more physical ground-water modelling, such a module from another Model B could be added and forced with variables from Model A, for instance surface water depth. Besides, output from other non-GFM models could be employed such as sea levels from a tide and surge model(Model C)which would even further increase the number physical processes representable (figure3).
We are aware that this would not only require opening the black box, but possibly also developers’ minds. Besides, possible issues with IP rights may have to be solvedfirst. Still, we are confident that such inter-active model functionalities can become a core element of advancing model validation and benchmarking across scales and processes, as they may not only result in improved model skill but also new and promising research possibilities.
6. Conclusion and recommendations
Many GFMs have been successfully used in policy making as well as operational tools and systems, but a lack of model inter-comparison has led to a poor understanding of their differences. However, we think that discerning these differences is pivotal for increased acceptance of GFMs by end-users and thus the existing different approaches to simulate inunda-tion data require a more thorough and streamlined validation and benchmarking procedure.
GFMs were validated with a wide range of data sets for various time periods in numerous river basins all over the World. While the data used for validation is to some extent related to the date of model publication and the data availability at that time, the fact that all models are validated‘successfully’for non-identical settings may lead to the misleading conclusion that all model perform equally well. Additionally, it does not support a clear conclusion as to why results differ between GFMs.
Due to the range in validation approaches, we see great potential for models to improve by comparing with and learning from others. Therefore, we sketch the conceptual outlines of a Global Flood Model Vali-dation Framework serving multiple purposes. First, it provides identical model forcing. Second, it validates simulated discharge, inundation extent, and surface water elevations. Third, it serves as a repository and version-control of GFM output and thus also allows for benchmarking output from different models and model versions. By establishing such a framework, we can ensure that, despite all independent model devel-opment trajectories, the same data and criteria are applied for assessing model output. While we focus on the need for a framework, as well as key testing ele-ments and challenges, we acknowledge that there will be multiple technical hurdles along the way. Even though we addressed several in this article, focussing on and solving all of them is, however, outside of the scope of this study.
Since the framework can only streamline external factors, there will probably still be deviations in model results due to differences in internal model structure, processes, and parameterization such as the use of dif-ferent river networks between models. For now this is perfectly acceptable, as the proposed framework is not meant to converge all GFMs, but rather as a testing and learning environment for researchers to improve usability and acceptance by end-users. In the long run and after reducing uncertainty associated with model forcing and boundary conditions, the knowledge gained through the framework could help to disen-tangle the impact of internal model properties such as the spatial representativeness of model grid and eleva-tion data and the use of different river networks.
By means of the framework, insights could be pro-vided in the upsides and downsides of each tested model design. If the framework is applied for more river basins and hydrologic conditions, it would fur-thermore be possible to identify where and under which circumstances each model performs best. Such knowledge can, in turn, be beneficial when it comes to communicating model strengths and limitations to policy and decision makers and provides them with a tool to identify which GFM may be most appropriate for a project or application in a specific region. Besides, the insights gained may be used to better point towards model shortcomings which could
bene-fit from adopting methods implemented in better
GFMs to improve model performance. Moving away from a black box approach may further stimulate the benchmarking and comparison of GFMs, as assess-ments could be performed at an unprecedented level of detail andflexibility, allowing ranking of the impor-tance of different elements of GFMs. For example, the same spatially varying hydrologic output could be applied to all models, reducing the number of factors influencing model deviations. Vice versa, it could be possible to provide a clearer picture on how the rou-tines calculating hydrologic forcing may differ by applying one routing scheme to all models’designs. Ultimately, the GFMs would move closer together without abandoning their specific properties, and uncertainties surroundingflood hazard outputs could be reduced greatly.
We are aware that the presented conceptual frame-work and the required openness about model perfor-mance may discourage contributions from private CAT models. Nevertheless, we are convinced that an independent validation and benchmarking frame-work can be beneficial for the private sector too, as (a) data providers could present their results from commercial CAT models in a broader context, and (b)data users couldfirst analyse which productsfits their needs best before purchasing aflood product. We hope that thorough benchmarking of inundation maps becomes the new normal, eventually requiring vendors to improve their services and consequently resulting in better risk estimates for end-users. From a technical point of view implementing the CAT models into the proposed framework would be relatively straightforward as they essentially employ the same technology and input data types as the open scientific models. A major requirement for those model devel-opers would of course be that outcomes are not neces-sarily made publicly available.
While the here proposed Global Flood Model Validation Framework focusses on differences in model design and associated differences in model out-put, more steps should be taken to improve the com-parability and consequential uptake of GFMs. First, the nomenclature of model variables and components differs greatly between models, hampering the trace-ability of model workflows. By using more standar-dized terminology, for example the standard names proposed by the Community Surface Dynamics Modelling System(https://csdms.colorado.edu/wiki/
CSDMS_Standard_Names), comparing GFMs would
become easier, particularly for non-expert users. And second, comparability, inter-operability, and usability
To establish a full comparison between GFMs, exposure and vulnerability data should be compared as well. Since these data layers are not based on a model-ling cascades, the proposed Global Flood Model valida-tion and benchmarking framework may not be the right means. Nevertheless, we think that further invest-igation is needed to better understand to which extent differences in simulated risk assessment outputs are dependent on hazard, exposure or vulnerability. Even-tually, the three pillars of risk could be compared alto-gether. Such an extensive inter-comparison project would help greatly to advance the current state of GFMs and to identify new research possibilities.
More efforts should be taken to advance our understanding of GFMs and their differences. With our proposed validation and benchmarking frame-work together with greater model accessibility, we see great potential for future model developments as well as an increased number of GFM applications and hope that model comparison will play a more significant role in futureflood hazard modelling studies.
Acknowledgments
We thank two anonymous reviewers for their critical and helpful remarks on a previous version of this manuscript.
ORCID iDs
Jannis M Hoch https://orcid.org/ 0000-0003-3570-6436
Mark A Trigg https://orcid.org/ 0000-0002-8412-9332
References
Alfieri L, Burek P, Dutra E, Krzeminski B, Muraro D, Thielen J and Pappenberger F 2013 GloFAS-global ensemble streamflow forecasting andflood early warningHydrol. Earth Syst. Sci.17
1161–75
Alfieri Let al2018 A global network for operationalflood risk reductionEnviron. Sci. Policy84149–58
Bates P D, Neal J, Sampson C, Smith A and Trigg M 2018 Progress toward hyerresolution models of globalflood hazardRisk Modeling for Hazards and Disastersed G Michel(Amsterdam: Elsevier)ch 9pp 211–32
Beck H E, van Dijk A I J M, de Roo A, Dutra E, Fink G, Orth R and Schellekens J 2017 Global evaluation of runoff from 10 state-of-the-art hydrological modelsHydrol. Earth Syst. Sci.21
2881–903
Bernhofen Met al2018 Afirst collective validation of globalfluvial
flood models for majorfloods in Nigeria and Mozambique
Berrisford P, Dee D P, Poli P, Brugge R, Fielding K, Fuentes M, Kållberg P W, Kobayashi S, Uppala S and Simmons A 2011 The ERA-Interim archive Version 2.0ERA Report Series
ECMWF, Shinfield Park, Reading(www.ecmwf.int/ node/8174)
Biancamaria S, Bates P D, Boone A and Mognard N M 2009 Large-scale coupled hydrologic and hydraulic modelling of the Ob river in SiberiaJ. Hydrol.379136–50
Bierkens M F Pet al2015 Hyper-resolution global hydrological modelling: what is next?:‘Everywhere and locally relevant’
Hydrol. Process.29310–20
Ceola S, Laio F and Montanari A 2014 Satellite nighttime lights reveal increasing human exposure tofloods worldwide
Geophys. Res. Lett.417184–90
Donchyts G, Baart F, Winsemius H, Gorelick N, Kwadijk J and van de Giesen N 2016 Earth’s surface water change over the past 30 yearsNat. Clim. Change6810
Dottori F, Salamon P, Bianchi A, Alfieri L, Hirpa F and Feyen L 2016 Development and evaluation of a framework for globalflood hazard mappingAdv. Water Resour.9487–102
Copernicus Climate Change Service(C3S)2017 ERA5: Fifth generation of ECMWF atmospheric reanalyses of the global climate. Copernicus Climate Change Service Climate Data Store(CDS) (https://cds.climate.copernicus.eu/cdsapp#!/ home) (Accessed: 21 December 2018)
Eyring Vet al2016 ESMValTool(v1.0)—a community diagnostic and performance metrics tool for routine evaluation of Earth system models in CMIPGeosci. Model Dev.91747–802
Giustarini L, Chini M, Hostache R, Pappenberger F and Matgen P 2015 Flood hazard mapping combining hydrodynamic modeling and multi annual remote sensing dataRemote Sens.
714200–26
GRDC 2018 GRDC Composite Runoff Fields v1.0(http://grdc.sr. unh.edu/) (Accessed: 9 March 2018)
Gupta H V, Kling H, Yilmaz K K and Martinez G F 2009 Decomposition of the mean squared error and NSE performance criteria: Implications for improving hydrological modellingJ. Hydrol.37780–91
Hess L L, Melack J M, Novo E M L M, Barbosa C C F and Gastil M 2003 Dual-season mapping of wetland inundation and vegetation for the central Amazon basinRemote Sens. Environ.87404–28
Hirpa F A, Salamon P, Alfieri L, Pozo J T, Zsoter E and
Pappenberger F 2016 The effect of reference climatology on globalflood forecastingJ. Hydrometeorol.171131–45
Hoch J M, Neal J C, Baart F, van Beek R, Winsemius H C, Bates P D and Bierkens M F P 2017 GLOFRIM v1.0—a globally applicable computational framework for integrated hydrological-hydrodynamic modellingGeosci. Model Dev.10
3913–29
Hoch J M, Van Beek L P H, Winsemius H C and Bierkens M F P 2018 Benchmarkingflexible meshes and regular grids for large-scalefluvial inundation modellingAdv. Water Resour.
121C350–60
Hoffman F Met al2017 2016 international land model
benchmarking(ILMB)workshop reportDOE/SC-0186U.S. Department of Energy(https://science.energy.gov/
~/media/ber/pdf/workshop%20reports/2016_ILAMB_ Report.pdf)
Huang C, Chen Y and Wu J 2014 Mapping spatio-temporalflood inundation dynamics at large river basin scale using time-seriesflow data and MODIS imageryInt. J. Appl. Earth Obs. Geoinf.26350–62
Inomata H and Fukami K 2008 Restoration of historical
hydrological data of Tonle Sap Lake and its surrounding areas
Hydrol. Process.221337–50
Jongman B, Hochrainer-Stigler S, Feyen L, Aerts J C J H, Mechler R, Botzen W J W, Bouwer L M, Pflug G, Rojas R and Ward P J 2014 Increasing stress on disaster-riskfinance due to large
floodsNat. Clim. Change41–5
Lian Y, Chan I-C, Singh J, Demissie M, Knapp V and Xie H 2007 Coupling of hydrologic and hydraulic models for the Illinois River BasinJ. Hydrol.344210–22
Meade R H, Rayol J M, Conceicão S C and Natividade J R G 1991 Backwater effects in the Amazon River basin of Brazil
Environ. Geol. Water Sci.18105
Munich Re 2010 Topics geo natural catastrophes 2009: analyses, assessments, positions 302-06295 Munich Reinsurance Group, Munich, Germany
ORE-HYBAM 2018 HYBAM ORE-South America(http:// ore-hybam.org/index.php/eng/Data/Station-Access-Maps/ HYBAM-ORE-South-America) (Accessed: 19 July 2018) Papa F, Prigent C, Aires F, Jimenez C, Rossow W B and Matthews E
2010 Interannual variability of surface water extent at the global scale, 1993–2004J. Geophys. Res. Atmos.1151–17
Pappenberger F, Dutra E, Wetterhall F and Cloke H L 2012 Deriving globalflood hazard maps offluvialfloods through a physical model cascadeHydrol. Earth Syst. Sci.164143–56
Peckham S D 2014 MELI 1.0: An Experimental Smart Modeling Framework For Automatic Coupling Of Self-Describing Models 9 CUNY Academic Works(https://academicworks. cuny.edu/cc_conf_hic/464)
Peckham S D, Hutton E W H and Norris B 2013 A component-based approach to integrated modeling in the geosciences: the design of CSDMSComput. Geosci.533–12
Prigent C, Papa F, Aires F, Rossow W B and Matthews E 2007 Global inundation dynamics inferred from multiple satellite observations, 1993–2000J. Geophys. Res.112D12107
Rudari R, Silvestro F, Campo L, Rebora N, Boni G and Herold C 2015 Improvement of the globalflood model for
theGAR2015(https://preventionweb.net/english/hyogo/ gar/2015/en/bgdocs/risk-section/CIMA%20Foundation, %20Improvement%20of%20the%20Global%20Flood% 20Model%20for%20the%20GAR15.pdf)
Salamon Pet al2016 The Global Flood Partnership Conference
Linking globalflood information with local needs (Ispra, Italy, 29 June–1 July 2016)(Luxembourg: Publications Office of the European Union) (https://doi.org/10.2788/84223)
Salamon Pet al2017 The Global Flood Partnership Conference
From hazards to impacts (Ispra, Italy , 27–29 June 2017)
(Luxembourg: Publications Office of the European Union) (https://doi.org/10.2760/68734)
Sampson C C, Smith A M, Bates P D, Neal J C, Alfieri L and Freer J E 2015 A high-resolution globalflood hazard modelWater Resour. Res.517358–81
Schumann G J-P, Neal J C, Voisin N, Andreadis K M, Pappenberger F, Phanthuwongpakdee N, Hall A C and Bates P D 2013 Afirst large-scaleflood inundation forecasting modelWater Resour. Res.496248–57
Sutanudjaja E Het al2017 PCR-GLOBWB 2.0: a 5 arc-minute global hydrological and water resources modelGeosci. Model Dev. Discuss.112429–53
Tellman B, Sullivan J, Doyle C, Kettner A, Brakenridge GR, Erickson T and Slayback D A 2017 A global geospatial database of 5000+historicflood event extentsAGU Fall Meeting Abstracts
Trigg M Aet al2016 The credibility challenge for globalfluvialflood risk analysisEnviron. Res. Lett.11094014
UNISDR 2015 Global Assessment Report on Disaster Risk Reduction, Making Development Sustainable: The Future of Disaster Risk Management, Geneve
UNISDR 2018 Putting science to work for resilience(https:// unisdr.org/archive/58772)
Viero D P, Peruzzo P, Carniello L and Defina A 2014 Integrated mathematical modeling of hydrological and hydrodynamic response to rainfall events in rural lowland catchmentsWater Resour. Res.505941–57
Voinov A and Shugart H H 2013‘Integronsters’, integral and integrated modelingEnviron. Modelling Softw.39149–58
Ward P Jet al2015 Usefulness and limitations of globalflood risk modelsNat. Clim. Change5712–5
Willis Towers Watson 2018 Insights from the Willis Re Flood Club: the Weaknesses and Strengths of Flood Modelling(Willis Towers Watson Wire) (https://blog.willis.com/2018/06/ insights-from-the-willis-re-fl ood-club-the-weaknesses-andstrengths-of-flood-modelling) (Accessed: 19 July 2018)
Bouwman A 2013 A framework for global riverflood risk assessmentsHydrol. Earth Syst. Sci.171871–92
Winsemius H Cet al2016 Global drivers of future riverflood risk
Nat. Clim. Change6381–5
World Resources Institute 2018 Aqueduct Global Flood Analyzer (http://floods.wri.org) (Accessed: 8 March 2018) Yamazaki D, Kanae S, Kim H and Oki T 2011 A physically
based description offloodplain inundation dynamics
based river network mapWater Resour. Res.497221–35
Yamazaki D, Sato T, Kanae S, Hirabayashi Y and Bates P D 2014 Regionalflood dynamics in a bifurcating mega delta simulated in a global river modelGeophys. Res. Lett.41
3127–35
Zhao Fet al2017 The critical role of the routing scheme in simulating peak river discharge in global hydrological models