The influence of obesity-related factors in the
etiology of renal cell carcinoma—A mendelian
randomization study
Mattias Johansson1☯*, Robert Carreras-TorresID1☯, Ghislaine Scelo1, Mark P. Purdue2, Daniela Mariosa1, David C. Muller3, Nicolas J. TimpsonID4, Philip C. HaycockID4, Kevin M. BrownID2, Zhaoming Wang5, Yuanqing Ye6, Jonathan N. Hofmann2, Matthieu Foll1, Valerie Gaborieau1, Mitchell J. MachielaID2, Leandro M. Colli2, Peng LiID1,7, Jean-Guillaume Garnier8,9, Helene Blanche9, Anne Boland8, Laurie Burdette2,
Egor Prokhortchouk10, Konstantin G. Skryabin10,11, Meredith Yeager2, Sanja Radojevic-SkodricID12,13, Simona Ognjanovic14,15, Lenka Foretova16, Ivana HolcatovaID17,
Vladimir Janout18, Dana MatesID19, Anush MukeriyaID20, Stefan Rascu21, David Zaridze20, Vladimir Bencko22, Cezary Cybulski23, Eleonora FabianovaID24, Viorel JingaID21,
Jolanta Lissowska25, Jan Lubinski23, Marie Navratilova16, Peter Rudnai26,
Simone Benhamou27,28, Geraldine Cancel-TassinID29,30, Olivier CussenotID29,30,31, Elisabete WeiderpassID32,33,34,35, Bo¨ rje Ljungberg36
, Raviprakash Tumkur Sitaram36, Christel Ha¨ggstro¨ m37,38, Fiona BruinsmaID39, Susan J. JordanID40,41,
Gianluca SeveriID42,43, Ingrid WinshipID44, Kristian Hveem45, Lars J. Vatten46,
Tony FletcherID47, Susanna C. LarssonID48, Alicja WolkID48, Rosamonde E. BanksID49, Peter J. Selby50, Douglas F. Easton51,52, Gabriella Andreotti2, Laura E. Beane FreemanID2, Stella Koutros2, Satu Ma¨nnisto¨53, Stephanie WeinsteinID2, Peter E. Clark54, Todd
L. EdwardsID55, Loren Lipworth54, Susan M. GapsturID56, Victoria L. StevensID56, Hallie CarolID57, Matthew L. Freedman57, Mark M. PomerantzID57, Eunyoung Cho58, Kathryn M. Wilson59, J. Michael Gaziano60, Howard D. Sesso59,61, Neal D. FreedmanID2, Alexander S. Parker62, Jeanette E. Eckel-Passow63, Wen-Yi HuangID2, Richard
J. Kahnoski64, Brian R. Lane64,65, Sabrina L. Noyes66,67, David PetilloID66,68, Bin Tean Teh66,69,70,71,72, Ulrike Peters73, Emily White73, Garnet L. AndersonID74, Lisa Johnson75, Juhua Luo76, Julie Buring60,61, I-Min Lee60,61, Wong-Ho Chow6, Lee E. MooreID2, Timothy Eisen77, Marc HenrionID78,79, James Larkin80, Poulami BarmanID63, Bradley C. Leibovich81, Toni K. ChoueiriID57, G. Mark Lathrop82, Jean-Francois Deleuze8,9, Marc Gunter1, James D. McKayID1, Xifeng Wu6, Richard S. Houlston78, Stephen
J. Chanock2, Caroline Relton4,83, J. Brent RichardsID84, Richard M. MartinID4,83,85, George Davey SmithID4,83, Paul BrennanID1*
1 International Agency for Research on Cancer (IARC), Lyon, France, 2 Division of Cancer Epidemiology and Genetics, National Cancer Institute, National Institutes of Health, Department Health and Human Services, Bethesda, Maryland, United States of America, 3 Imperial College, London, United Kingdom, 4 MRC Integrative Epidemiology Unit, University of Bristol, Bristol, United Kingdom, 5 St. Jude Children’s Research Hospital, Memphis, Tennessee, United States of America, 6 Department of Epidemiology, Division of Cancer Prevention and Population Sciences, The University of Texas MD Anderson Cancer Center, Houston, Texas, United States of America, 7 Max Planck Institute for Demographic Research, Rostock, Germany, 8 Centre National de Genotypage, Institut de Genomique, Centre de l’Energie Atomique et aux Energies Alternatives, Evry, France, 9 Fondation Jean Dausset - Centre d’Etude du Polymorphisme Humain, Paris, France, 10 Federal Research Centre “Fundamentals of Biotechnology” of the Russian Academy of Sciences, Moscow, Russian Federation, 11 Kurchatov Scientific Center, Moscow, Russian Federation, 12 Institute of Pathology, Medical School of Belgrade, Belgrade, Serbia, 13 Clinic of Urology, Clinical Center of Serbia, Belgrade, Serbia, 14 Mayo Clinic Graduate School of Biomedical Sciences, Rochester, Minnesota, United States of America, 15 International Organization for Cancer Prevention and Research (IOCPR), Belgrade, Serbia, 16 Department of Cancer Epidemiology and Genetics, Masaryk Memorial Cancer Institute, Brno, Czech Republic, 17 Institute of Public Health and Preventive Medicine, 2nd Faculty of Medicine, Charles University, Prague, Czech Republic, 18 Department of Preventive Medicine, Faculty of Medicine, Palacky University, Olomouc, Czech Republic, 19 National Institute of Public Health, Bucharest, Romania, 20 Russian N.N. Blokhin Cancer Research Centre, Moscow, Russian Federation, 21 Carol Davila University
a1111111111 a1111111111 a1111111111 a1111111111 a1111111111 OPEN ACCESS
Citation: Johansson M, Carreras-Torres R, Scelo
G, Purdue MP, Mariosa D, Muller DC, et al. (2019) The influence of obesity-related factors in the etiology of renal cell carcinoma—A mendelian randomization study. PLoS Med 16(1): e1002724.
https://doi.org/10.1371/journal.pmed.1002724
Academic Editor: Cosetta Minelli, Imperial College
London, UNITED KINGDOM
Received: May 22, 2018
Accepted: December 7, 2018
Published: January 3, 2019
Copyright: This is an open access article, free of all
copyright, and may be freely reproduced, distributed, transmitted, modified, built upon, or otherwise used by anyone for any lawful purpose. The work is made available under theCreative Commons CC0public domain dedication.
Data Availability Statement: All data needed to
reproduce our results are included inS1 Table.
Funding: This analysis was supported by the World
Cancer Research Fund International—https://www. wcrf.org/(2014/1193, to MJ) and Cancer Research UK—https://www.cancerresearchuk.org/(C18281/ A19169, to RMM and CR). Funding for the genome-wide genotyping was provided by the US National Institutes of Health (NIH), National Cancer Institute—https://www.cancer.gov
of Medicine and Pharmacy, Th. Burghele Hospital, Bucharest, Romania, 22 Institute of Hygiene and Epidemiology, 1st Faculty of Medicine, Charles University, Prague, Czech Republic, 23 International Hereditary Cancer Center, Department of Genetics and Pathology, Pomeranian Medical University, Szczecin, Poland, 24 Regional Authority of Public Health in Banska Bystrica, Banska Bystrica, Slovakia, 25 The M Sklodowska-Curie Cancer Center and Institute of Oncology, Warsaw, Poland, 26 National Public Health Center, National Directorate of Environmental Health, Budapest, Hungary, 27 INSERM U946, Paris, France, 28 CNRS UMR8200, Institute Gustave Roussy, Villejuif, France, 29 CeRePP, Paris, France, 30 UPMC Univ Paris 06, GRC n˚5, Institut Universitaire de Cance´ rologie, Paris, France, 31 AP-HP, Department of Urology, Hopitaux Universitaires Est Parisien Tenon, Paris, France, 32 Department of Research, Cancer Registry of Norway, Institute of Population-Based Cancer Research, Oslo, Norway, 33 Department of Medical Epidemiology and Biostatistics, Karolinska Institutet, Stockholm, Sweden, 34 Genetic Epidemiology Group, Folkha¨lsan Research Center, Helsinki, Finland, 35 Department of Community Medicine, University of Tromsø, The Arctic University of Norway, Tromsø, Norway, 36 Department of Surgical and Perioperative Sciences, Urology and Andrology, UmeåUniversity, Umeå, Sweden, 37 Department of Biobank Research, UmeåUniversity, Umeå, Sweden, 38 Department of Surgical Sciences, Uppsala University, Uppsala, Sweden, 39 Cancer Epidemiology Centre, Cancer Council Victoria, Melbourne, Australia, 40 QIMR Berghofer Medical Research Institute, Herston, Queensland, Australia, 41 School of Public Health, The University of Queensland, Brisbane, Australia, 42 “Health across generations” team, CESP Inserm, Faculte´ s de Me´dicine Universite´ Paris-Sud, UVSQ, Universite´ Paris-Saclay, Gustave Roussy, Villejuif, France, 43 Human Genetics Foundation (HuGeF), Torino, Italy, 44 Department of Medicine, Royal Melbourne Hospital, University of Melbourne, Melbourne, Australia, 45 K. G. Jebsen Center for Genetic Epidemiology, Department of Public Health, Norwegian University of Science and Technology, Trondheim, Norway, 46 Department of Public Health and General Practice, Faculty of Medicine, Norwegian University of Science and Technology, Trondheim, Norway, 47 London School of Hygiene and Tropical Medicine, University of London, London, United Kingdom, 48 Institute of Environmental Medicine, Karolinska Institutet, Stockholm, Sweden, 49 Leeds Institute of Cancer and Pathology, University of Leeds, St James’s University Hospital, Leeds, United Kingdom, 50 National Institute for Health Research Diagnostic Evidence Cooperative, Division of Surgery, Imperial College London, St Mary’s Hospital, London, United Kingdom, 51 Department of Oncology, University of Cambridge, Cambridge, United Kingdom, 52 Department of Public Health and Primary Care, University of Cambridge, Cambridge, United Kingdom, 53 National Institute for Health and Welfare, Helsinki, Finland, 54 Vanderbilt-Ingram Cancer Center, Nashville, Tennessee, United States of America, 55 Department of Medicine, Division of Epidemiology, Vanderbilt-Ingram Cancer Center, Vanderbilt Genetics Institute, Nashville, Tennessee, United States of America, 56 American Cancer Society, Atlanta, Georgia, United States of America, 57 Dana-Farber Cancer Institute, Boston, Massachusetts, United States of America, 58 Brown University, Providence, Rhode Island, United States of America, 59 Harvard T.H. Chan School of Public Health, Boston, Massachusetts, United States of America, 60 Brigham and Women’s Hospital, Harvard Medical School, Boston, Massachusetts, United States of America, 61 Department of Medicine, Brigham and Women’s Hospital, Boston, Massachusetts, United States of America,
62 Department of Health Sciences Research, Mayo Clinic, Jacksonville, Florida, United States of America, 63 Department of Health Sciences Research, Division of Biomedical Statistics and Informatics, Mayo Clinic, Rochester, Minnesota, United States of America, 64 Division of Urology, Spectrum Health, Grand Rapids, Michigan, United States of America, 65 College of Human Medicine, Michigan State University, Grand Rapids, Michigan, United States of America, 66 Van Andel Research Institute, Center for Cancer Genomics and Quantitative Biology, Grand Rapids, Michigan, United States of America, 67 Spectrum Health, Grand Rapids, Michigan, United States of America, 68 Diagnostics Program at Ferris State University, Grand Rapids, Michigan, United States of America, 69 Program in Cancer and Stem Cell Biology, Duke-National, University of Singapore Medical School, Singapore, Singapore, 70 Institute of Molecular and Cell Biology, A*STAR, Singapore, Singapore, 71 Laboratory of Cancer Epigenome, Division of Medical Sciences, National Cancer Centre Singapore, Singapore, Singapore, 72 Cancer Science Institute of Singapore, National University of Singapore, Singapore, Singapore, 73 Cancer Prevention Program, Fred Hutchinson Cancer Research Center, Seattle, Washington, United States of America, 74 WHI Clinical Coordinating Center, Fred Hutchinson Cancer Research Center, Seattle, Washington, United States of America, 75 Fred Hutchinson Cancer Research Center, Seattle, Washington, United States of America, 76 Department of Epidemiology and Biostatistics, School of Public Health Indiana University Bloomington, Bloomington, Indiana, United States of America, 77 University of Cambridge, Cambridge, United Kingdom, 78 The Institute of Cancer Research, London, United Kingdom, 79 Dept. of Genetics and Genomic Sciences, Icahn School of Medicine at Mount Sinai, New York, New York, United States of America, 80 Royal Marsden NHS Foundation Trust, London, United Kingdom, 81 Department of Urology, Mayo Clinic, Rochester, Minnesota, United States of America, 82 McGill University and Genome Quebec Innovation Centre, Montreal, Quebec, Canada, 83 School of Social and Community Medicine, University of Bristol, Bristol, United Kingdom, 84 Departments of Medicine, Human Genetics, Epidemiology and Biostatistics, Jewish General Hospital, McGill University, Montreal, Quebec, Canada, 85 University Hospitals Bristol NHS Foundation Trust National Institute for Health Research Bristol Nutrition Biomedical Research Unit, University of Bristol, Bristol, United Kingdom
IARC, and by the intramural research program of the National Cancer Institute, US NIH, for those studies coordinated by the NCI; and the MD Anderson GWAS was supported in part by the NIH (grant R01 CA170298) and the Center for Translational and Public Health Genomics, Duncan Family Institute for Cancer Prevention and Risk Assessment, The University of Texas MD Anderson Cancer Center. RMM is supported by the National Institute for Health Research (NIHR) Bristol Nutritional Biomedical Research Unit based at University Hospitals Bristol NHS Foundation Trust and the University of Bristol. RCT, PCH, CR, RMM, GDS, MJ, and PB are investigators or researchers on a Cancer Research UK (C18281/A19169) Programme Grant (the Integrative Cancer Epidemiology Programme). CR, GDS, and NT work within the MRC Integrative Epidemiology Unit at the University of Bristol (MC_UU_12013/1, MC_UU_12013/2, MC_UU_12013/3). JBR is supported by the Canadian Institutes of Health Research and the Fonds du Recherche Que´bec-Sante´. JL is supported by the RM/ICR NIHR Biomedical Research Centre for Cancer. The funders had no role in the design of the study; the collection, analysis, and interpretation of the data; the writing of the manuscript; and the decision to submit the manuscript for publication.
Competing interests: I have read the journal’s
policy and the authors of this manuscript have the following competing interests: TE declared employment, research support, and stock in AstraZeneca and research support from Bayer and Pfizer. PCH is a population health fellow of Cancer Research UK. GDS is a member of the Editorial Board of PLOS Medicine.
Abbreviations: BMI, body mass index; CI,
confidence interval; DBP, diastolic blood pressure; GIANT, Genetic Investigation of ANthropometric Traits; GLGC, Global Lipids Genetics Consortium; GWAS, genome-wide association study; HDL, high-density lipoprotein cholesterol; IARC, International Agency for Research on Cancer; IGF1, insulin-like growth factor 1; LD, linkage
☯These authors contributed equally to this work. *johanssonm@iarc.fr(MJ);gep@iarc.fr(PB)
Abstract
Background
Several obesity-related factors have been associated with renal cell carcinoma (RCC), but it is unclear which individual factors directly influence risk. We addressed this question using genetic markers as proxies for putative risk factors and evaluated their relation to RCC risk in a mendelian randomization (MR) framework. This methodology limits bias due to con-founding and is not affected by reverse causation.
Methods and findings
Genetic markers associated with obesity measures, blood pressure, lipids, type 2 diabetes, insulin, and glucose were initially identified as instrumental variables, and their association with RCC risk was subsequently evaluated in a genome-wide association study (GWAS) of 10,784 RCC patients and 20,406 control participants in a 2-sample MR framework. The effect on RCC risk was estimated by calculating odds ratios (ORSD) for a standard deviation (SD) increment in each risk factor. The MR analysis indicated that higher body mass index increases the risk of RCC (ORSD: 1.56, 95% confidence interval [CI] 1.44–1.70), with com-parable results for waist-to-hip ratio (ORSD: 1.63, 95% CI 1.40–1.90) and body fat percent-age (ORSD: 1.66, 95% CI 1.44–1.90). This analysis further indicated that higher fasting insulin (ORSD: 1.82, 95% CI 1.30–2.55) and diastolic blood pressure (DBP; ORSD: 1.28, 95% CI 1.11–1.47), but not systolic blood pressure (ORSD: 0.98, 95% CI 0.84–1.14), increase the risk for RCC. No association with RCC risk was seen for lipids, overall type 2 diabetes, or fasting glucose.
Conclusions
This study provides novel evidence for an etiological role of insulin in RCC, as well as confir-matory evidence that obesity and DBP influence RCC risk.
Author summary
Why was this study done?
• Traditional observational studies wherein putative risk factors are measured directly have found several obesity-related factors associated with increased risk of renal cell car-cinoma (RCC).
• This study used an alternative methodology commonly referred to as mendelian ran-domization (MR). MR circumvents many of the inherent limitations of traditional observational study by use of genetic proxies of putative risk factors when evaluating their associations with disease risk, as they are not subject to reverse causation and are less likely to be confounded by other risk factors.
What did the researchers do and find?
• First, we used large-scale genome-wide association studies (GWAS) to identify genetic variants associated with obesity measures, blood pressure, lipids, type 2 diabetes, insulin, and glucose. Second, these genetic variants were used as proxies for the above-men-tioned risk factors and evaluated in relation RCC risk using GWAS data from 10,000 RCC patients and 20,000 control participants.
• Based on these genetic data, we found that multiple measures of obesity, as well as dia-stolic blood pressure (DBP) and fasting insulin, are associated with RCC risk. In con-trast, we found little evidence for an association with RCC risk for systolic blood pressure (SBP), circulating lipids, overall diabetes, or fasting glucose.
What do these findings mean?
• This study provided robust and confirmatory evidence of an important role of obesity as an important risk factor of RCC.
• Further confirmatory evidence was found for elevated DBP as a risk factor of RCC, but it is not clear why DBP rather than SBP is important in RCC.
• The study, to our knowledge, provided novel evidence of an important role of circulat-ing insulin in RCC etiology.
• This study provided some novel insights into the pathways involved in mediating the risk increase in RCC that is caused by obesity, most notably through insulin and DBP, but further research is needed to fully elucidate the important relationship between obe-sity and RCC.
Introduction
The etiology of renal cell carcinoma (RCC) is only partly understood [1]. An increased risk of RCC has been observed for individuals with high body mass index (BMI), elevated blood pres-sure, and triglycerides [2]. However, these obesity-related exposures are inherently interre-lated, and traditional epidemiological studies have not been able to untangle which individual factors directly influence RCC risk and which are merely correlated with the underlying causal factor.
MR-based studies can therefore circumvent many of the inherent limitations of traditional observa-tional studies, and an association between genetic proxies and the disease of interest would indicate that the risk factor being proxied influences risk in a causal manner [5].
We evaluated the role of obesity-related factors in RCC etiology using a two-sample MR framework wherein genetic variants associated with 13 relevant risk factors were identified from genome-wide association studies (GWASs). Subsequently, we evaluated the association of these genetic variants with RCC risk in a large RCC GWAS comprising 10,784 RCC patients and 20,406 control participants.
Materials and methods
Analytical strategy
The goal of our analytical strategy was to clarify the role of obesity and obesity-related risk fac-tors in RCC etiology using a two-sample MR framework. This involved reviewing the GWAS literature to identify obesity-related risk factors for which valid proxy single nucleotide poly-morphisms (SNPs) could be identified or by carrying out de novo GWAS analyses (e.g., for risk factors measured in UK Biobank) (first sample). This led to assembling SNP-based instru-mental variables for obesity-related factors that were evaluated in relation to risk in the largest RCC GWAS published to date (second sample) [6]. This MR-based risk analysis involved using the likelihood-based approach to estimate the RCC odds ratio (OR) associated with a standard deviation (SD) increment in each risk factor of interest, with several complementary MR methods being applied to evaluate consistency in association estimates and between-study heterogeneity. No changes to the analytical strategy were done following the initial analysis. Further details on the specific methods used are indicated in the Statistical analysis section below.
Identification of genetic markers as instrumental variables for
obesity-related factors (first sample)
Genetic markers for various obesity-related risk factors comprised SNPs that were associated
with the risk factor of interest (P<5×10⁻⁸) based on study participants with European
ances-try. Correlated SNPs were excluded based on measures of linkage disequilibrium (LD) R2<
Consortium (MAGIC) [11,12]. Finally, instruments for type 2 diabetes were identified from a genetic fine-mapping study by Gaulton and colleagues [13]. Because SNPs associated with risk of type 2 diabetes may act by increasing insulin resistance or affecting pancreatic beta-cell function, we also evaluated subgroups of type 2 diabetes SNPs by stratifying for these two pathophysiologic mechanisms [14].
SNPs with ambiguous strand codification (A/T or C/G) were replaced by SNPs in genetic
linkage (R2>0.8) using theproxysnpsR package (European populations) (R Project) or were
removed from the analyses if the minor allele frequency was higher than 0.4. For each SNP included in the different instrumental variables, the genetic effect estimate on exposure
expressed in SDs of the trait per allele (βGE) was retrieved from each respective GWAS, along
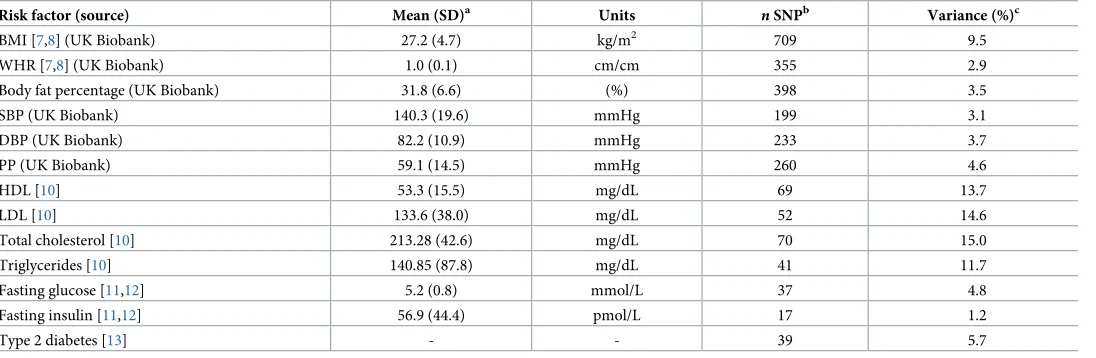
with the corresponding standard errors (SEGE).Table 1provides details on the number of
SNPs that constituted the instrumental variable for each potential risk factor, the proportion of variance explained by the instrument (or cumulative SNP liability in the case of type 2 diabe-tes), and the mean and SD of the respective risk factors in the original discovery study. Effect
estimates for each individual SNP regarding their association with risk factor (βGE) are
pre-sented inS1 Table.
RCC association results (second sample)
To evaluate the association of each SNP used in the respective instrumental variables with
RCC risk, we used summary genetic effect estimates on RCC risk (βGD) with the
[image:6.612.37.585.88.267.2]correspond-ing standard errors (SEGD) from the most recent GWAS on RCC [15]. This study encom-passed data from 31,190 study participants, including 5,586 RCC patients and 13,075 control participants from previous GWASs [16–20], as well as an additional 5,198 RCC patients and 7,331 control participants with new GWA data, resulting in a total of 10,784 RCC patients and 20,406 control participants. These samples comprised prospective and retrospective case-con-trol studies coordinated by four institutes, including the International Agency for Research on
Table 1. Description of SNPs used as instrumental variables for obesity-related factors.
Risk factor (source) Mean (SD)a Units nSNPb Variance (%)c
BMI [7,8] (UK Biobank) 27.2 (4.7) kg/m2 709 9.5
WHR [7,8] (UK Biobank) 1.0 (0.1) cm/cm 355 2.9
Body fat percentage (UK Biobank) 31.8 (6.6) (%) 398 3.5
SBP (UK Biobank) 140.3 (19.6) mmHg 199 3.1
DBP (UK Biobank) 82.2 (10.9) mmHg 233 3.7
PP (UK Biobank) 59.1 (14.5) mmHg 260 4.6
HDL [10] 53.3 (15.5) mg/dL 69 13.7
LDL [10] 133.6 (38.0) mg/dL 52 14.6
Total cholesterol [10] 213.28 (42.6) mg/dL 70 15.0
Triglycerides [10] 140.85 (87.8) mg/dL 41 11.7
Fasting glucose [11,12] 5.2 (0.8) mmol/L 37 4.8
Fasting insulin [11,12] 56.9 (44.4) pmol/L 17 1.2
Type 2 diabetes [13] - - 39 5.7
aMean and SD for each risk factor in the original discovery study for the SNPs used as instrumental variables.
bNumber of SNPs used in the instrument variable when evaluating each risk factor of interest with risk.
cVariance explained by the instrumental variable for each risk factor as indicated in the discovery GWAS (see marker publication).
Abbreviations: BMI, body mass index; DBP, diastolic blood pressure; GWAS, genome-wide association study; HDL, high-density lipoprotein cholesterol; LDL, low-density lipoprotein cholesterol; PP, pulse pressure; SBP, systolic blood pressure; SD, standard deviation; SNP, single nucleotide polymorphism; WHR, waist-to-hip ratio.
Cancer (IARC), the United States National Cancer Institute (NCI), MD Anderson Cancer Center (MDA), and United Kingdom cancer research centers (UK) (S2 Table). Sex-stratified analyses were performed for study participants from the IARC study sample (3,227 male RCC patients and 4,915 male control participants; 1,992 female RCC patients and 3,095 female
con-trol participants). SNPs with an imputation quality score (R2or info score) lower than 0.7 were
not used in the MR analysis. Effect estimates for association with disease risk for each SNP (βGD) can be observed inS1 Table.
Statistical analysis
A priori power calculations for the MR analysis to detect an association of nominal statistical
significance (P<0.05) were performed for instrumental variables explaining a range in
vari-ance of a causal risk factor, using the method proposed by Burgess [21]. Fig A inS1 Text
depicts the statistical power of instrumental variables for different levels of explained variance for the risk factor of interest.
ORSDwere calculated as effect estimates on RCC risk for an SD increment for each risk
fac-tor of interest using the corresponding instrumental variable. The primary MR analysis and the instrumental SNP heterogeneity analysis were conducted using the likelihood-based approach described by Burgess and colleagues [6]. Heterogeneity of initial effect estimates between the four data sources were investigated by estimating the percentage of variance that is attributable
to study heterogeneity (I2statistic). ThePvalue for heterogeneity (PStudy-Heterogeneity) assumed
a fixed-effect model with 3 degrees of freedom. For the sex-stratified risk analysis, thePvalue
for heterogeneity (PSex-Heterogeneity) was obtained from a fixed-effect model with 1 degree of
freedom.
As a sensitivity test, the presence of pleiotropy (i.e., genetic contribution to disease risk through a separate pathway) and potential outlier SNPs among genetic instruments were assessed using a novel approach labeled “MR pleiotropy residual sum and outlier” (MR-PRESSO) [22]. SNPs behaving as outliers were excluded from the instrument, and the effect estimate for the relevant risk factor of interest was reassessed. We also provided OR estimates using the complementary weighted-median method, wherein the effect estimate is weighted toward the median of the distribution of SNPs used in the instrumental variable [23]. This approach is less sensitive to individual SNPs strongly influencing the overall effect estimate. Furthermore, to evaluate the extent to which directional pleiotropy (nonbalanced
horizontal pleiotropy in the MR risk estimates) may affect the ORSDestimates, we used an
Egger regression approach (SIMEX version that does not assume the absence of
measure-ment error on theβGEestimate) [24]. As a visual evaluation of pleiotropy, we also provided
funnel plots depicting the weight exerted on the effect estimate along the y-axis (βGE/SEGD)
and estimates of the effect on RCC along the x-axis (exp[βGD/βGE]) for each SNP used in
the corresponding instrumental variable. Finally, we removed one SNP at a time from the instrument and reestimated the risk estimate to evaluate whether individual SNPs domi-nated the overall effect estimate. Statistical analyses were performed using R (R Project) and Plink [9].
Results
MR results of RCC for obesity-related risk factors
BMI, WHR, and body fat percentage. We estimated that each SD increment in BMI
(1 SD: 4.7 kg/m2) increased the risk of RCC by 56% (ORSD: 1.56, 95% confidence interval [CI]
1.44–1.70) (Fig 1; Fig B inS1 Textfor study stratification). A similar increase in risk was also
study stratification) and for body fat percentage (1 SD: 6.6%) (ORSD: 1.66, 95% CI 1.44–1.90)
(Fig 1; Fig D inS1 Textfor study stratification). SNP heterogeneity (PSNP_heterogeneity=
9×10⁻⁸) and horizontal pleiotropy (PMR_PRESSO<1×10⁻⁴) were observed for each obesity
instrument (S3 Table), but there was little evidence of outlier SNPs or directional pleiotropy (PMR-Egger intercept>0.12,S3 Table). The funnel plot for the BMI instruments (Fig 2A) indicated
a symmetric distribution of effect estimates, and the leave-one-out histogram (Fig E inS1
Text) did not indicate that any individual SNPs were driving the overall association with risk,
with similar results for WHR (Fig 2Band Fig F inS1 Text) and body fat percentage (Fig G in
S1 Text). Accordingly, the complementary weighted-median MR method provided similar
results (ORSD: 1.75, 95% CI 1.50–2.03, for BMI; ORSD: 1.45, 95% CI 1.14–1.86, for WHR;
ORSD: 1.63, 95% CI 1.31–2.03, for body fat %;S3 Table). Sex heterogeneity was not observed in
[image:8.612.61.570.81.478.2]the IARC study sample (P>0.41; Fig B–D inS1 Text).
Fig 1. Forest plot depicts OR estimates of RCC for the instrumental variables defined by genetic markers of obesity-related risk factors.aNumber of SNPs
used in each instrumental variable.bOR of RCC associated with one SD increment for each risk factor, as estimated using the instrumental variable. These ORs were estimated using the likelihood method. CI, confidence interval; OR, odds ratio; RCC, renal cell carcinoma; SD, standard deviation; SNP, single nucleotide polymorphism.
Blood pressure. The MR analysis indicated that DBP (1 SD of DBP: 10.9 mmHg) (ORSD:
1.28, 95% CI 1.11–1.47) (Fig 1; Fig H inS1 Textfor study stratification), but not SBP (ORSD:
0.98, 95% CI 0.84–1.14) (Fig 1; Fig I inS1 Textfor study stratification), influences RCC risk (P
for difference in OR: 0.01). In accordance with the risk association of DBP, we also observed
an inverse association for PP with RCC risk (ORSD: 0.77, 95% CI 0.68–0.88) (Fig J inS1 Text
for study stratification). Sensitivity analyses did not detect any nonbalanced pleiotropic effect biasing the DBP risk estimates (S3 Table), and the funnel plot demonstrated a symmetric dis-tribution of effect estimates from DBP SNPs (Fig 2C). The leave-one-out histogram for DBP
can be seen in Fig K inS1 Text. Funnel plots and leave-one-out histograms for SBP and PP can
be observed in Fig L and Fig M inS1 Text, respectively. In the IARC study samples, sex
hetero-geneity was not observed for DBP and SBP. However, the inverse association for PP with RCC
risk was observed in men (ORSD: 0.74, 95% CI 0.58–0.94) but not in women (ORSD: 1.25, 95%
CI 0.93–1.69) (PSex-heterogeneity= 7×10⁻³) (Fig J inS1 Text).
Blood lipids. For blood lipid levels—including HDL, LDL, total cholesterol, and
[image:9.612.49.577.78.446.2]triglycer-ides—the MR analysis indicated little evidence for an influence on RCC risk, with the overall
Fig 2. Funnel plots depict the weight exerted for each SNP used in the genetic instruments, along the y-axis (βGP/SEGD), into the estimated effect on RCC odds,
along the x-axis (exp[βGD/βGP]), for (A) BMI, (B) waist-to-hip ratio, (C) diastolic blood pressure, and (D) fasting insulin. Funnel plot x-axis is in logarithmic
scale. BMI, body mass index; MR, mendelian randomization; OR, odds ratio; RCC, renal cell carcinoma; SD, standard deviation; SNP, single nucleotide polymorphism.
ORSDestimates ranging from 0.97 to 1.04 (P�0.40,Fig 1, Fig N-Q inS1 Textfor stratified
analyses, Fig R–U inS1 Textfor sensitivity analyses).
Type 2 diabetes, insulin, and glucose. Overall type 2 diabetes was not associated with
RCC risk (ORSD: 0.99, 95% CI 0.93–1.05), but when analyzing subgroups related to type 2
dia-betes in a secondary analysis, SNPs related to beta-cell dysfunction were nominally inversely
associated with risk (ORSD: 0.91, 95% CI 0.83–0.99), and SNPs related to insulin resistance
were nominally positively associated with risk (ORSD: 1.37, 95% CI 1.02–1.84) (Fig 1). Notably,
fasting insulin was positively associated with RCC risk, with each SD increment (44.4 pmol/L)
increasing RCC risk by 82% (ORSD: 1.82, 95% CI 1.30–2.55) whereas little evidence was seen
for a role of fasting glucose in RCC (P= 0.43) (Fig 1). No clear evidence of heterogeneity by
study or sex was observed for any of the diabetes-related risk factors (Fig V–X inS1 Text), nor
did the Egger regression or other sensitivity analyses indicate the presence of pleiotropy (S3 Tableand Fig Y–AA inS1 Text).
Discussion
This MR analysis confirmed a role for higher BMI and DBP in RCC etiology and provided novel evidence for a role of fasting insulin. In contrast, we found little evidence for a role of other obesity-related risk factors RCC etiology, with evaluated risk factors including diagnosis of type 2 diabetes, SBP, and blood lipid levels.
There is an abundance of observational studies implicating obesity in RCC development, and several reviews have concluded that there is convincing evidence that being overweight or obese increases RCC risk [25,26]. Although a previous MR analysis on obesity and RCC did not provide unequivocal support for such a relation, the statistical power of that study was limited by a small sample size [27]. The current study leveraged results of several large-scale GWAS initiatives on both the metabolic risk factors of interest and RCC risk. We identified 709 SNPs as instrumental variables for BMI through meta-analyses of the existing GIANT GWAS and the novel UK Biobank GWAS, as well as results from our recent RCC GWAS ini-tiative of over 10,000 RCC patients and 20,000 control participants. This enabled a well-pow-ered two-sample MR analysis that provided strong support for a role of obesity and being
overweight in RCC etiology (Fig 1and Fig A inS1 Text). In particular, we estimated that an
SD increment in BMI—approximately equivalent to 5 kg/m2—increases the risk of RCC by
56% (Fig 1). Considering that most observational studies have estimated risk increases of approximately 30% per 5 units of BMI [25,26], these results are notable, as they suggest that the impact of higher BMI and obesity in RCC etiology may be even more important than previously thought. This difference in effect estimates may reflect an inherent weakness in observational studies that use single direct measures of the risk factor of interest, whereas the genetic variants used to proxy the risk factor in an MR study would be expected to reflect the life-course exposure, thus better capturing the cumulative exposure.
whereas no association with risk was seen for SBP nor for blood lipids, including HDL, LDL, total cholesterol, and triglycerides. Based on the fraction of variance explained by the instru-mental variables of these factors (Table 1), we estimated that there was sufficient statistical
power (>80%) to detect even modest log-linear relative risks of 1.2 per SD increment in a risk
factor and close to complete statistical power (100%) to detect relative risks of 1.5 (Fig A inS1
Text). As such, this MR-based analysis did not support a role of SBP and blood lipids in RCC [2]. However, the positive association between the instrumental variable of DBP with risk is in line with previous epidemiological evidence. We also note that the difference in risk effect esti-mates between the DBP and SBP was significant, suggesting that it was not due to chance and lack of statistical power [2,31]. The mechanisms by which elevated blood pressure might influ-ence RCC development are not established, but several plausible mechanisms have been sug-gested, including by influencing angiogenesis, growth factors, and renal function, thereby making the kidney more susceptible to carcinogens [31]. We are not aware of any hypothesis for why DBP rather than SBP would be important in RCC, but note that some epidemiological studies have indicated a stronger association with risk for DBP than for SBP [31].
We further observed a strong association between the instrumental variables of fasting insu-lin and RCC risk (Fig 1). In particular, we estimated that one SD increment in fasting insuinsu-lin results in 82% increased risk of RCC. Whereas no association with RCC risk was seen for type 2 diabetes, we found an inverse association with risk for SNPs related to beta-cell dysfunction and a positive association with risk for SNPs related to insulin resistance, even though these subanalyses were conducted with limited statistical power. Insulin resistance may lead to com-pensatory hyperinsulinemia when pancreatic beta cells increase insulin secretion to maintain normal blood glucose. The contrasting associations with risk for the beta-cell dysfunction and insulin-resistance SNPs would therefore lend further support for a role of insulin in RCC etiol-ogy, as well as explain the lack of association with RCC risk for overall type 2 diabetes. Based on previously published data on the relationship between fasting insulin and BMI [32], we esti-mated that approximately one-fifth of the effect of BMI on RCC risk would be mediated by fast-ing insulin. Whereas the experimental data on the role of insulin in RCC tumorigenesis are still limited [33], there is ample in vivo and in vitro data describing pro-proliferative and antiapop-totic properties of insulin together with insulin-like growth factor 1 (IGF1) [33–35]. Prospective studies evaluating the association between directly measured fasting insulin (prediagnostically) and RCC risk are further warranted, and improving our understanding of insulin and IGF1 sig-naling in RCC development and progression may also offer therapeutic opportunities [36].
An overarching observation was that little evidence was found for sex heterogeneity in the relation between any of the risk-associated factors and RCC. This result is interesting, as it con-trasts with some traditional observational studies that have reported stronger associations for obesity-related factors with RCC risk among women [37,38].
In conclusion, this study confirmed the important role of being overweight and having ele-vated DBP in affecting RCC risk and provided novel evidence for an etiological role of eleele-vated insulin. The study gave little support for SBP or blood lipids and glucose being important in RCC. Taken together, these results advance our understanding of RCC etiology but highlight the need for further research focused on understanding how DBP and insulin-related ways affect RCC risk, as well as complementary research aiming to identify additional path-ways explaining the mechanisms by which obesity influences RCC development.
Supporting information
S1 Table. Association parameters of instrumental SNPs of obesity-related risk factors for
type 2 diabetes.Β, beta estimate; BMI, body mass index; BP, base position; CHR, chromo-some; DBP, diastolic blood pressure; EffAl, effect allele; GD, genotype-to-disease; GE, geno-type-to-exposure; HDL, high-density lipoprotein cholesterol; LDL, low-density lipoprotein cholesterol; OthAl, other allele; PP, pulse pressure; SBP, systolic blood pressure; SE, standard error.
(PDF)
S2 Table. Description of the studies participating in the RCC GWAS meta-analysis.
GWAS, genome-wide association study; RCC, renal cell carcinoma. (PDF)
S3 Table. Pleiotropy assessment and risk increase of obesity-related factors on RCC pro-vided by sensitivity tests. LCI, lower confidence interval;nSNPs, number of SNPs; OR, odds
ratio; P,Pvalue; PSNP-Heterogeneity, heterogeneityPvalue between instrumental SNP causal
estimates (βGD/βGE) from genetic effects inS1 Table; UCI, upper confidence interval.
(PDF)
S1 Text. Supplementary figures.
(PDF)
Acknowledgments
The authors thank all of the participants who took part in this research and the funders and support staff who made this study possible. We further thank Paul Pharoah for his valuable contribution to the study.
The funders had no role in the design of the study; the collection, analysis, and interpreta-tion of the data; the writing of the manuscript; and the decision to submit the manuscript for publication.
Author Contributions
Conceptualization: Mattias Johansson, Robert Carreras-Torres, David C. Muller, Nicolas J.
Timpson, Philip C. Haycock, Matthieu Foll, Marc Gunter, James D. McKay, Caroline Relton, J. Brent Richards, Richard M. Martin, George Davey Smith, Paul Brennan.
Data curation: Mattias Johansson, Kevin M. Brown, Yuanqing Ye, Jonathan N. Hofmann,
Valerie Gaborieau, Mitchell J. Machiela, Leandro M. Colli, Peng Li.
Formal analysis: Mattias Johansson, Daniela Mariosa, Kevin M. Brown, Yuanqing Ye,
Jona-than N. Hofmann, Valerie Gaborieau, Mitchell J. Machiela, Leandro M. Colli, Peng Li.
Funding acquisition: Mattias Johansson, Robert Carreras-Torres, Ghislaine Scelo, Mark P.
Purdue, G. Mark Lathrop, Xifeng Wu, Stephen J. Chanock, Paul Brennan.
Investigation: Mattias Johansson, Robert Carreras-Torres, Ghislaine Scelo, Mark P. Purdue,
Easton, Gabriella Andreotti, Laura E. Beane Freeman, Stella Koutros, Satu Ma¨nnisto¨, Ste-phanie Weinstein, Peter E. Clark, Todd L. Edwards, Loren Lipworth, Susan M. Gapstur, Victoria L. Stevens, Hallie Carol, Matthew L. Freedman, Mark M. Pomerantz, Eunyoung Cho, Kathryn M. Wilson, J. Michael Gaziano, Howard D. Sesso, Neal D. Freedman, Alexan-der S. Parker, Jeanette E. Eckel-Passow, Wen-Yi Huang, Richard J. Kahnoski, Brian R. Lane, Sabrina L. Noyes, David Petillo, Bin Tean Teh, Ulrike Peters, Emily White, Garnet L. Anderson, Lisa Johnson, Juhua Luo, Julie Buring, I-Min Lee, Wong-Ho Chow, Lee E. Moore, Timothy Eisen, Marc Henrion, James Larkin, Poulami Barman, Bradley C. Leibo-vich, Toni K. Choueiri, G. Mark Lathrop, Jean-Francois Deleuze, Stephen J. Chanock.
Methodology: Mattias Johansson, Robert Carreras-Torres, Ghislaine Scelo, Mark P. Purdue,
Laurie Burdette, Egor Prokhortchouk, Konstantin G. Skryabin, Meredith Yeager, Sanja Radojevic-Skodric, Simona Ognjanovic, Lenka Foretova, Ivana Holcatova, Vladimir Janout, Dana Mates, Anush Mukeriya, Stefan Rascu, David Zaridze, Vladimir Bencko, Cezary Cybulski, Eleonora Fabianova, Viorel Jinga, Jolanta Lissowska, Jan Lubinski, Marie Navrati-lova, Peter Rudnai, Simone Benhamou, Geraldine Cancel-Tassin, Olivier Cussenot,
Elisa-bete Weiderpass, Bo¨rje Ljungberg, Raviprakash Tumkur Sitaram, Christel Ha¨ggstro¨m,
Fiona Bruinsma, Susan J. Jordan, Gianluca Severi, Ingrid Winship, Kristian Hveem, Lars J. Vatten, Tony Fletcher, Susanna C. Larsson, Alicja Wolk, Rosamonde E. Banks, Peter J. Selby, Douglas F. Easton, Gabriella Andreotti, Laura E. Beane Freeman, Stella Koutros, Satu Ma¨nnisto¨, Stephanie Weinstein, Peter E. Clark, Todd L. Edwards, Loren Lipworth, Susan M. Gapstur, Victoria L. Stevens, Hallie Carol, Matthew L. Freedman, Mark M. Pomerantz, Eunyoung Cho, Kathryn M. Wilson, J. Michael Gaziano, Howard D. Sesso, Neal D. Freed-man, Alexander S. Parker, Jeanette E. Eckel-Passow, Wen-Yi Huang, Richard J. Kahnoski, Brian R. Lane, Sabrina L. Noyes, David Petillo, Bin Tean Teh, Ulrike Peters, Emily White, Garnet L. Anderson, Lisa Johnson, Juhua Luo, Julie Buring, I-Min Lee, Wong-Ho Chow, Lee E. Moore, Timothy Eisen, Marc Henrion, James Larkin, Poulami Barman, Bradley C. Leibovich, Toni K. Choueiri.
Project administration: Mattias Johansson, Ghislaine Scelo, Mark P. Purdue, Zhaoming
Wang, Guillaume Garnier, Helene Blanche, Anne Boland, G. Mark Lathrop, Jean-Francois Deleuze, Xifeng Wu, Richard S. Houlston, Stephen J. Chanock, Paul Brennan.
Resources: Mattias Johansson, Ghislaine Scelo, Mark P. Purdue, Zhaoming Wang,
Jean-Guil-laume Garnier, Helene Blanche, Anne Boland, Jean-Francois Deleuze, Xifeng Wu, Richard S. Houlston, Stephen J. Chanock, Paul Brennan.
Software: Mattias Johansson, Kevin M. Brown, Yuanqing Ye, Jonathan N. Hofmann, Mitchell
J. Machiela, Leandro M. Colli.
Supervision: Mattias Johansson.
Validation: Mattias Johansson, Robert Carreras-Torres, Daniela Mariosa, Kevin M. Brown,
Yuanqing Ye, Jonathan N. Hofmann, Valerie Gaborieau, Mitchell J. Machiela, Leandro M. Colli, Peng Li, Jean-Guillaume Garnier, Helene Blanche, Anne Boland, Jean-Francois Deleuze, Xifeng Wu.
Visualization: Robert Carreras-Torres.
Writing – original draft: Mattias Johansson, Robert Carreras-Torres, Ghislaine Scelo, Stephen
Writing – review & editing: Mark P. Purdue, Daniela Mariosa, David C. Muller, Nicolas J.
Timpson, Philip C. Haycock, Kevin M. Brown, Zhaoming Wang, Yuanqing Ye, Jonathan N. Hofmann, Matthieu Foll, Valerie Gaborieau, Mitchell J. Machiela, Leandro M. Colli, Peng Li, Jean-Guillaume Garnier, Helene Blanche, Anne Boland, Laurie Burdette, Egor Prokhortchouk, Konstantin G. Skryabin, Meredith Yeager, Sanja Radojevic-Skodric, Simona Ognjanovic, Lenka Foretova, Ivana Holcatova, Vladimir Janout, Dana Mates, Anush Mukeriya, Stefan Rascu, David Zaridze, Vladimir Bencko, Cezary Cybulski, Eleo-nora Fabianova, Viorel Jinga, Jolanta Lissowska, Jan Lubinski, Marie Navratilova, Peter Rudnai, Simone Benhamou, Geraldine Cancel-Tassin, Olivier Cussenot, Elisabete Weider-pass, Bo¨rje Ljungberg, Raviprakash Tumkur Sitaram, Christel Ha¨ggstro¨m, Fiona Bruinsma, Susan J. Jordan, Gianluca Severi, Ingrid Winship, Kristian Hveem, Lars J. Vatten, Tony Fletcher, Susanna C. Larsson, Alicja Wolk, Rosamonde E. Banks, Peter J. Selby, Douglas F. Easton, Gabriella Andreotti, Laura E. Beane Freeman, Stella Koutros, Satu Ma¨nnisto¨, Ste-phanie Weinstein, Peter E. Clark, Todd L. Edwards, Loren Lipworth, Susan M. Gapstur, Victoria L. Stevens, Hallie Carol, Matthew L. Freedman, Mark M. Pomerantz, Eunyoung Cho, Kathryn M. Wilson, J. Michael Gaziano, Howard D. Sesso, Neal D. Freedman, Alexan-der S. Parker, Jeanette E. Eckel-Passow, Wen-Yi Huang, Richard J. Kahnoski, Brian R. Lane, Sabrina L. Noyes, David Petillo, Bin Tean Teh, Ulrike Peters, Emily White, Garnet L. Anderson, Lisa Johnson, Juhua Luo, Julie Buring, I-Min Lee, Wong-Ho Chow, Lee E. Moore, Timothy Eisen, Marc Henrion, James Larkin, Poulami Barman, Bradley C. Leibo-vich, Toni K. Choueiri, G. Mark Lathrop, Jean-Francois Deleuze, Marc Gunter, James D. McKay, Xifeng Wu, Richard S. Houlston.
References
1. Torre LA, Bray F, Siegel RL, Ferlay J, Lortet-Tieulent J, Jemal A. Global cancer statistics, 2012. CA: a cancer journal for clinicians. 2015; 65(2):87–108.https://doi.org/10.3322/caac.21262PMID:25651787. 2. Haggstrom C, Rapp K, Stocks T, Manjer J, Bjorge T, Ulmer H, et al. Metabolic factors associated with
risk of renal cell carcinoma. PLoS ONE. 2013; 8(2):e57475.https://doi.org/10.1371/journal.pone. 0057475PMID:23468995.
3. Smith GD, Ebrahim S. ’Mendelian randomization’: can genetic epidemiology contribute to understand-ing environmental determinants of disease? Int J Epidemiol. 2003; 32(1):1–22. Epub 2003/04/12. PMID:12689998.
4. Davey Smith G, Hemani G. Mendelian randomization: genetic anchors for causal inference in epidemio-logical studies. Hum Mol Genet. 2014; 23(R1):R89–98. Epub 2014/07/30.https://doi.org/10.1093/hmg/ ddu328PMID:25064373.
5. Burgess S, Butterworth AS, Thompson JR. Beyond Mendelian randomization: how to interpret evidence of shared genetic predictors. J Clin Epidemiol. 2016; 69:208–16.https://doi.org/10.1016/j.jclinepi.2015. 08.001PMID:26291580.
6. Burgess S, Butterworth A, Thompson SG. Mendelian randomization analysis with multiple genetic vari-ants using summarized data. Genet Epidemiol. 2013; 37(7):658–65.https://doi.org/10.1002/gepi.21758
PMID:24114802.
7. Locke AE, Kahali B, Berndt SI, Justice AE, Pers TH, Day FR, et al. Genetic studies of body mass index yield new insights for obesity biology. Nature. 2015; 518(7538):197–206.https://doi.org/10.1038/ nature14177PMID:25673413.
8. Shungin D, Winkler TW, Croteau-Chonka DC, Ferreira T, Locke AE, Magi R, et al. New genetic loci link adipose and insulin biology to body fat distribution. Nature. 2015; 518(7538):187–96.https://doi.org/10. 1038/nature14132PMID:25673412.
9. Purcell S, Neale B, Todd-Brown K, Thomas L, Ferreira MA, Bender D, et al. PLINK: a tool set for whole-genome association and population-based linkage analyses. Am J Hum Genet. 2007; 81(3):559–75.
https://doi.org/10.1086/519795PMID:17701901.
11. Scott RA, Lagou V, Welch RP, Wheeler E, Montasser ME, Luan J, et al. Large-scale association analy-ses identify new loci influencing glycemic traits and provide insight into the underlying biological path-ways. Nat Genet. 2012; 44(9):991–1005.https://doi.org/10.1038/ng.2385PMID:22885924.
12. Morris AP, Voight BF, Teslovich TM, Ferreira T, Segre AV, Steinthorsdottir V, et al. Large-scale associ-ation analysis provides insights into the genetic architecture and pathophysiology of type 2 diabetes. Nat Genet. 2012; 44(9):981–90.https://doi.org/10.1038/ng.2383PMID:22885922.
13. Gaulton KJ, Ferreira T, Lee Y, Raimondo A, Magi R, Reschen ME, et al. Genetic fine mapping and genomic annotation defines causal mechanisms at type 2 diabetes susceptibility loci. Nat Genet. 2015; 47(12):1415–25.https://doi.org/10.1038/ng.3437PMID:26551672.
14. Dimas AS, Lagou V, Barker A, Knowles JW, Magi R, Hivert MF, et al. Impact of type 2 diabetes suscep-tibility variants on quantitative glycemic traits reveals mechanistic heterogeneity. Diabetes. 2014; 63 (6):2158–71.https://doi.org/10.2337/db13-0949PMID:24296717.
15. Scelo G, Purdue MP, Brown KM, Johansson M, Wang Z, Eckel-Passow JE, et al. Genome-wide associ-ation study identifies multiple risk loci for renal cell carcinoma. Nature communicassoci-ations. 2017; 8:15724. Epub 2017/06/10.https://doi.org/10.1038/ncomms15724PMID:28598434.
16. Han SS, Yeager M, Moore LE, Wei MH, Pfeiffer R, Toure O, et al. The chromosome 2p21 region harbors a complex genetic architecture for association with risk for renal cell carcinoma. Hum Mol Genet. 2012; 21(5):1190–200. Epub 2011/11/25.https://doi.org/10.1093/hmg/ddr551PMID:
22113997.
17. Henrion MY, Purdue MP, Scelo G, Broderick P, Frampton M, Ritchie A, et al. Common Variation at 1q24.1 (ALDH9A1) Is a Potential Risk Factor for Renal Cancer. PLoS ONE. 2015; 10(3):e0122589. Epub 2015/04/01.https://doi.org/10.1371/journal.pone.0122589PMID:25826619.
18. Purdue MP, Johansson M, Zelenika D, Toro JR, Scelo G, Moore LE, et al. Genome-wide association study of renal cell carcinoma identifies two susceptibility loci on 2p21 and 11q13.3. Nat Genet. 2011; 43 (1):60–5.https://doi.org/10.1038/ng.723PMID:21131975.
19. Wu XF, Scelo G, Purdue MP, Rothman N, Johansson M, Ye YQ, et al. A genome-wide association study identifies a novel susceptibility locus for renal cell carcinoma on 12p11.23. Hum Mol Genet. 2012; 21(2):456–62.https://doi.org/10.1093/hmg/ddr479PMID:22010048
20. Henrion M, Frampton M, Scelo G, Purdue M, Ye Y, Broderick P, et al. Common variation at 2q22.3 (ZEB2) influences the risk of renal cancer. Hum Mol Genet. 2013; 22(4):825–31. Epub 2012/11/28.
https://doi.org/10.1093/hmg/dds489PMID:23184150.
21. Burgess S. Sample size and power calculations in Mendelian randomization with a single instrumental variable and a binary outcome. Int J Epidemiol. 2014; 43(3):922–9.https://doi.org/10.1093/ije/dyu005
PMID:24608958.
22. Verbanck M, Chen CY, Neale B, Do R. Detection of widespread horizontal pleiotropy in causal relation-ships inferred from Mendelian randomization between complex traits and diseases. Nat Genet. 2018; 50(5):693–8.https://doi.org/10.1038/s41588-018-0099-7PMID:29686387.
23. Bowden J, Davey Smith G, Haycock PC, Burgess S. Consistent Estimation in Mendelian Randomiza-tion with Some Invalid Instruments Using a Weighted Median Estimator. Genet Epidemiol. 2016; 40 (4):304–14.https://doi.org/10.1002/gepi.21965PMID:27061298.
24. Bowden J, Davey Smith G, Burgess S. Mendelian randomization with invalid instruments: effect estima-tion and bias detecestima-tion through Egger regression. Int J Epidemiol. 2015; 44(2):512–25.https://doi.org/ 10.1093/ije/dyv080PMID:26050253.
25. Lauby-Secretan B, Scoccianti C, Loomis D, Grosse Y, Bianchini F, Straif K, et al. Body Fatness and Cancer—Viewpoint of the IARC Working Group. N Engl J Med. 2016; 375(8):794–8.https://doi.org/10. 1056/NEJMsr1606602PMID:27557308.
26. World Cancer Research Fund International/American Institute for Cancer Research. Continuous Update Project Report: Diet, Nutrition, Physical Activity and Kidney Cancer. 2015.https://www.wcrf.org/ sites/default/files/Kidney-cancer-report.pdf
27. Brennan P, McKay J, Moore L, Zaridze D, Mukeria A, Szeszenia-Dabrowska N, et al. Obesity and can-cer: Mendelian randomization approach utilizing the FTO genotype. Int J Epidemiol. 2009; 38(4):971–5.
https://doi.org/10.1093/ije/dyp162PMID:19542184.
28. Aguilar-Salinas CA, Rojas R, Gomez-Perez FJ, Mehta R, Franco A, Olaiz G, et al. The metabolic syn-drome: a concept hard to define. Arch Med Res. 2005; 36(3):223–31.https://doi.org/10.1016/j.arcmed. 2004.12.003PMID:15925012.
29. Chow WH, Dong LM, Devesa SS. Epidemiology and risk factors for kidney cancer. Nat Rev Urol. 2010; 7(5):245–57.https://doi.org/10.1038/nrurol.2010.46PMID:20448658.
31. Chow WH, Gridley G, Fraumeni JF Jr., Jarvholm B. Obesity, hypertension, and the risk of kidney cancer in men. N Engl J Med. 2000; 343(18):1305–11.https://doi.org/10.1056/NEJM200011023431804PMID:
11058675.
32. Richmond RC, Wade KH, Corbin L, Bowden J, Hemani G, Timpson NJ, et al. Investigating the role of insulin in increased adiposity: Bi-directional Mendelian randomization stuy. bioRxiv. 2017. Epub June 28 2017.https://doi.org/10.1101/155739
33. Solarek W, Czarnecka AM, Escudier B, Bielecka ZF, Lian F, Szczylik C. Insulin and IGFs in renal cancer risk and progression. Endocr Relat Cancer. 2015; 22(5):R253–64. https://doi.org/10.1530/ERC-15-0135PMID:26330483.
34. Frasca F, Pandini G, Sciacca L, Pezzino V, Squatrito S, Belfiore A, et al. The role of insulin receptors and IGF-I receptors in cancer and other diseases. Arch Physiol Biochem. 2008; 114(1):23–37.https:// doi.org/10.1080/13813450801969715PMID:18465356.
35. Bowers LW, Rossi EL, O’Flanagan CH, deGraffenried LA, Hursting SD. The Role of the Insulin/IGF System in Cancer: Lessons Learned from Clinical Trials and the Energy Balance-Cancer Link. Front Endocrinol (Lausanne). 2015; 6:77. Epub 2015/06/02.https://doi.org/10.3389/fendo.2015.00077PMID:
26029167.
36. Gallagher EJ, Fierz Y, Ferguson RD, LeRoith D. The pathway from diabetes and obesity to cancer, on the route to targeted therapy. Endocr Pract. 2010; 16(5):864–73.https://doi.org/10.4158/EP10098.RA
PMID:20841312.
37. Wilson KM, Cho E. Obesity and Kidney Cancer. Recent Results Cancer Res. 2016; 208:81–93. Epub 2016/12/03.https://doi.org/10.1007/978-3-319-42542-9_5PMID:27909903.
38. Graff RE, Sanchez A, Tobias DK, Rodriguez D, Barrisford GW, Blute ML, et al. Type 2 Diabetes in Rela-tion to the Risk of Renal Cell Carcinoma Among Men and Women in Two Large Prospective Cohort Studies. Diabetes Care. 2018; 41(7):1432–7. Epub 2018/04/22.https://doi.org/10.2337/dc17-2518

![Fig 2. Funnel plots depict the weight exerted for each SNP used in the genetic instruments, along the y-axis (βGP/SEGD), into the estimated effect on RCC odds,along the x-axis (exp[βGD/βGP]), for (A) BMI, (B) waist-to-hip ratio, (C) diastolic blood pressur](https://thumb-us.123doks.com/thumbv2/123dok_us/1860689.142923/9.612.49.577.78.446/funnel-weight-exerted-genetic-instruments-estimated-diastolic-pressur.webp)
