by
P. Wilson
A thesis presented for the degree of Master of Arts at the Research School of Social Sciences in
Demography, the Australian National University, during 1973-74.
ACKNOWLEDGEMENTS
I am extremely grateful to: the Colombo Plan authorities in Sri Lanka as well as in Australia for awarding a scholarship enabling me to undertake this study; the Vidyodaya Campus, University of
Sri Lanka, for granting me necessary study leave; Dr C.A.Price and Dr L.T.Ruzicka, Department of Demography, Australian National University, for their helpful comments and constructive advice as my supervisors; Professor J.C.Caldwell, Department of Demography, and Dr R.M.Sundrum, Department of Economics (Research School of Pacific Studies), A.N.U., for their encouragement; Mr S .Selvaratnam, for his help in the initial stages of this study; Mr R.K.Srivastava, for making available the unpublished data of the 1968 Labour Force Survey; Mr L .B.Rajakaruna and his staff, Department of Census and Statistics, Sri Lanka, for granting access to unpublished data of the 1963 and 1971 censuses; the staff, Department of Demography, A.N.U., for their kind co-operation; and finally, my wife, Wimal,
and my daughter, Wasana, for enduring painful situations and
disruptions experienced far away in Sri Lanka while I was doing this study in Australia.
P. Wilson Australian National University,
Canberra.
Page
ACKNOWLEDGEMENTS iii
LIST OF TABLES vi
LIST OF FIGURES xii
INTRODUCTION 1
CHAPTER 1 STATISTICAL DATA ON THE LABOUR FORCE: AVAILABILITY
AND COMPARABILITY 7
1.1 The Labour Force Concept 7
1.2 Limitations of the Recommended Definition 10 1.3 Availability of the Labour Force Data 17 1.4 Comparability of the Census Data 20 CHAPTER 2 MAJOR DETERMINING FACTORS OF THE LABOUR FORCE 32
2.1 Males in the Labour Force 35
2.1.1 Demographic Factors 35
2.1.2 Socio-economic Factors 47
2.1.3 Pattern of Labour Force Participation:
Males 53
2.2 Females in the Labour Force 55
2.2.1 Demographic Factors 55
2.2.2 Socio-economic Factors 61
2.2.3 Pattern of Labour Force Participation:
Females 68
CHAPTER 3 LABOUR FORCE TRENDS 72
3.1 Growth of the Labour Force 72
3.2 Population Trends and Labour Force Participation 74 3.3 Adult Population and Trends in Labour Force
Participation 80
3.4 Trends in the Age Specific Activity Rates 81
3.5 Length of Active Life 87
3.6 Components of the Annual Changes of the Size of
the Male Labour Force 94
3.7 Intercensal Comparison of the Cohort Activity
Rates 96
CHAPTER 5 LABOUR FORCE PROJECTIONS, 1971-1981 149
5.1 Population Projections 149
5.1.1 Mortality 149
5.1.2 Fertility 153
5.1.3 Migration 160
5.1.4 Rural-Urban Distribution of the
Projected Population 163
5.2 Projection of School-going Population 169
5.3 Labour Force Projections 175
5.3.1 Future Activity Rates for Males 175 5.3.2 Future Activity Rates for Females 178 5.3.3 Rural-Urban Distribution of the
Projected Labour Force ' 185
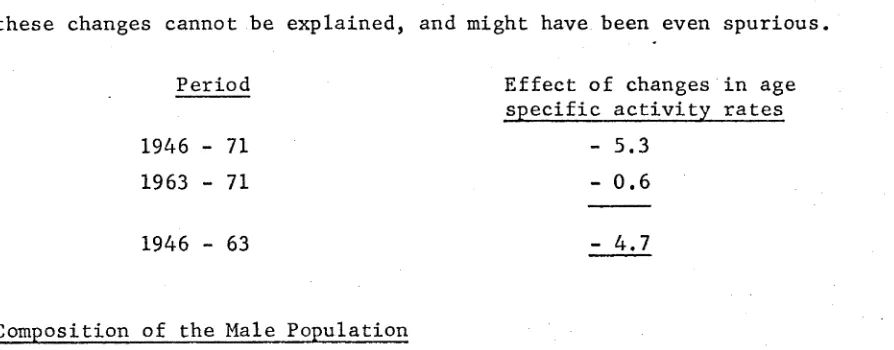
CONCLUSIONS 192
APPENDIX 1 Proposed Method of the Measurement of Visible
and Invisible Underemployment 207
APPENDIX II Estimation of the Effect of Changes in the Age Structure 208 APPENDIX III Standardized Activity Rates for Males, 1946 and 1971 209 APPENDIX IV Participation Rates by Districts and Sex, 1968 210 APPENDIX V Standardized Activity Rates for Females, 1946 and 1971 211 APPENDIX VI Methodology of Deriving Functions of the Abridged
Tables of Economically Active Life and Working Life
Tables for Males, 1946-71 212
APPENDIX VII Estimation of Annual Number of Entries into and Losses from the Labour Force and Tables Containing Entries
and Losses for Males, 1946-71 219
APPENDIX VIII Adjustment of the Unemployed Data, 1963 226 APPENDIX IX Estimation of the Underemployed Population, 1971 229 APPENDIX X IMR, MMR and Age Specific Death Rates, 1946-69 231 APPENDIX XI Survival Rates by Age and Sex, 1971-76 and 1976-81 232 APPENDIX XII Population Projections 1968-1998: Average Age
Specific Fertility Rates 233
APPENDIX XIII Components of the Increase in the Urban Population,
1963-71 234
APPENDIX XIV Comparison of Projected Activity Rates with the
Previous Projections 235
APPENDIX XV The Effects of Rural-Urban Migration on the Future
Labour Force 238
T a b l e
C h a p t e r 1
1 . 1
1. 2
1 . 3
1 . 4
LIST OF TABLES
P a g e
The Mo s t S i g n i f i c a n t F e a t u r e s o f t h e D e f i n i t i o n s Whic h Were Us e d i n t h e C e n s u s e s B e t w e e n 1946 a n d 1971
t o E n u m e r a t e t h e E c o n o m i c a l l y A c t i v e P o p u l a t i o n 21
Type o f Q u e s t i o n s As k ed i n t h e C e n s u s e s 1946 t o 1971 t o I d e n t i f y t h e Volume o f t h e E c o n o m i c a l l y A c t i v e
P o p u l a t i o n and i t s S t r u c t u r e 22
F a c t o r s L e a d i n g t o O v e r e s t i m a t i o n a n d / o r U n d e r e s t i m a t i o n o f t h e D a t a o f t h e E c o n o m i c a l l y A c t i v e
P o p u l a t i o n i n t h e 1946 a n d 1953 C e n s u s e s 26
C e n s u s D a t e s , 1 9 4 6- 7 1 28
C h a p t e r 2
2 . 1 P o p u l a t i o n o f S r i L a n k a , 1 8 7 1 - 1 9 7 1 : I n t e r c e n s a l P e r c e n t a g e I n c r e a s e s a n d A v e r a g e A n n u a l R a t e s o f
G r o w t h 32
2 . 2 M a j o r D e t e r m i n i n g F a c t o r s o f S i z e , C o m p o s i t i o n a n d
G r o w t h o f t h e L a b o u r F o r c e 34
2 . 3 B r o a d Age S t r u c t u r e o f M a le P o p u l a t i o n , 1 9 4 6 - 7 1 37
2 . 4 Age S p e c i f i c A c t i v i t y R a t e s f o r M a l e s by R e s i d e n c e :
U r b a n a n d R u r a l , 1963 a n d 1971 41
2 . 5 D i s t r i b u t i o n o f t h e T o t a l L a b o u r F o r c e by R e s i d e n c e :
U r b a n , R u r a l a nd E s t a t e , 1 9 6 9/ 7 0 43
2 . 6 Age S p e c i f i c A c t i v i t y R a t e s f o r M a l e s by R e s i d e n c e :
U r b a n , R u r a l a n d E s t a t e , 1968 a n d 1 9 6 9 / 7 0 45
2 . 7 P e r c e n t a g e D i s t r i b u t i o n o f T o t a l P o p u l a t i o n by E t h n i c
O r i g i n , 1971 46
2 . 8 Age S p e c i f i c E n r o l m e n t R a t e s i n S c h o o l s a nd
P a r t i c i p a t i o n R a t e s i n t h e L a b o u r F o r c e : M a l e s 1 0 - 2 9
Y e a r s O l d , 1963 a n d 1971 48
2 . 9 F u n c t i o n a l D i s t r i b u t i o n o f t h e M a l e P o p u l a t i o n Ag es
1 0 - 2 9 Y e a r s No t i n t h e L a b o u r F o r c e by A ge , 1971 49
2 . 1 0 Age S p e c i f i c A c t i v i t y R a t e s f o r M a l e s by L e v e l o f
E d u c a t i o n , 1 9 6 9 / 7 0 51
2 . 1 1 B r o a d Age S t r u c t u r e o f F e m a l e P o p u l a t i o n , 1 9 4 6 - 7 1 56
2 . 1 2 Age S p e c i f i c A c t i v i t y R a t e s f o r F e m a l e s by R e s i d e n c e :
2.13 Age Specific Activity Rates for Females by Residence:
Urban, Rural and Estate, 1968 and 1969/70 60 2.14 Age Specific Enrolment Rates in Schools and
Participation Rates in the Labour Force: Females
10-29 Years Old, 1963 and 1971 62
2.15 Functional Distribution of the Female Population Ages
10-29 Years Not in the Labour Force by Age, 1971 63 2.16 Age Specific Activity Rates for Females by Level of
Education, 1969/70 63
Chapter 3
3.1 Growth of the Labour Force, 1946-71 73
3.2 Growth of the Labour Force by Sex, 1946-71 74 3.3 Proportion of the Total Population in the Labour
Force (Crude Activity Rates), 1946-71 75
3.4 Dependency Ratios, 1946-71 78
3.5 Persons Not in the Labour Force Per 100 in the Labour
Force, 1963 and 1971 79
3.6 Proportion of the Population 15 Years and Over in the
Labour Force (Refined Activity Rates), 1946-71 81 3.7 Age Specific Activity Rates by Sex, 1946-71 83 3.8 Length of Gross Years of Active Life by Sex, 1946-71 89 3.9 Average Expectation of Life and Economically Active
Life for Males, 1946-71 90
3.10 Impact of Mortality on the Length of Active Life for
Males, 1946-71 93
3.11 Components of the Annual Changes of the Male Labour
Force, 1946-71 94
3.12 Age Specific Activity Rates for Males by Birth
Cohorts, 1946-71 98
3.13 Net Rates of Entry Into (+) or Retirement from (-) the Labour Force in Successive Age Intervals:
1946-71 (Males) 99
3.14 Expectation of Active Life for Males by Level of
Education, 1969/70 102
3.15 Age Specific Activity Rates for Males by Level of
3.16 Components of the Annual Changes of the Male Labour Force by Level of Education (Crude Rates per 1,000),
1969/70 105
3.17 Expectation of Active Life for Males by Place of
Residence, 1968 108
3.18 Components of the Annual Changes of the Male Labour Force by Place of Residence (Crude Rates per 1,000),
1968 n o
Chapter 4
4.1 Employed Population, 1946-71 112
4.2 Percentage Distribution of Employed Population by
Age and Sex, 1946-71 113
4.3 Age Specific Employment Rates, 1963-71 115
4.4 Percentage Distribution of Employed Population by
Major Industrial Sectors and Sex, 1953-71 117 4.5 Percentage Distribution of Employed Population by
Major Occupations and Sex, 1953-71 120
4.6 Percentage Distribution of Employed Population by
Occupational Status and Sex, 1953-71 121 4.7 Employed Population by Occupational Status and
Major Industrial Sectors, 1963-71 123
4.8 Employed Population by Occupational Status and
Major Occupations, 1963-71 125
4.9 Percentage Distribution of Employed Population by
Level of Education and Sex, 1963, 1969/70 and 1971 126 4.10 Activity Rates for Employed Population by Level of
Education and Sex, 1969/70 127
4.11 Unemployed Population, 1959/60, 1963 and 1971 131 4.12 Percentage Distribution of Unemployed Population by
Age and Sex, 1963 and 1971 132
4.13 Age Specific Unemployment Rates, 1963-71 134
4.14 Percentage Distribution of Unemployed Population by
Level of Education and Sex, 1963-71 135
4.15 Activity Rates for Unemployed Population by Level of
Education and Sex, 1969/70 136
4.16 Percentage Distribution of Unemployed Population by
4.17 Distribution of Unemployed (Not Actively Seeking Work and Actively Seeking Work) by Age and Sex,
1963-71 140
4.18 Distribution of Unemployed Actively Seeking Work by Period for which they were Seeking Work, Age and
Sex, 1971 143
4.19 Unemployed Population by Type of Work they were
Looking for and Sex, 1968 144
4.20 Unemployed Population by Sex, Educational Status and
Type of Work they were Looking for, 1968 145 4.21 Percentage Distribution of Employed Population by
Hours Worked, 1959/60 and 1968 147
Chapter 5
5.1 Crude Death Rates, 1946-71 150
5.2 Expectation of Life by Age and Sex, 1963 and 1969 151 5.3 Total and Age Specific Fertility Rates, 1952-69 154 5.4 Percentage of Women Currently Married by Age, 1953-71 156 5.5 Number of Live Births Borne by Ever-married Women
According to Age and Level of Education 157 5.6 Progress of New Acceptors of Family Planning
Methods, 1966-70 158
5.7 Projected Age Specific Fertility Rates, 1971-81 5.8 Migration and Natural Increase of Population,
1946-71 161
5.9 Trends in Crude Birth Rates, Crude Death Rates and
Annual Average Rates of Growth, 1971-81 161 5.10 Population of Sri Lanka by Age and Sex, 1971-81 162 5.11 Broad Age Structure of Population, 1971-81 164 5.12 Percentage Distribution of Urban and Rural Population,
1946-71 165
5.13 Rural-Urban Distribution of the Projected Population
by Age and Sex, 1971-81 170
5.14 Percentage of School-going Population 5-24 Years Old
by Sex, 1963-71 171
5.15 Projected Rates of School Enrolment and School-going
5 . 1 6 N o n - s c h o o l - g o i n g P o p u l a t i o n by Age a n d S e x , 1 9 7 1 - 8 1 175
5 . 1 7 P r o j e c t e d A c t i v i t y R a t e s by Age a n d S e x , 1 9 7 1 - 8 1 181
5 . 1 8 P r o j e c t e d L a b o u r F o r c e by Age a n d S e x , 1 9 7 1 - 8 1 182
5 . 1 9 C h a n g e s i n t h e P r o j e c t e d L a b o u r F o r c e , A r i s i n g f rom C h a n g e s i n t h e Age S t r u c t u r e and C h a n g e s i n A c t i v i t y
R a t e s , 1 9 7 1 - 8 1 183
5 . 2 0 B r o a d Age S t r u c t u r e o f t h e P r o j e c t e d L a b o u r F o r c e
by S e x , 1 9 7 1 - 8 1 184
5 . 2 1 R u r a l - U r b a n D i s t r i b u t i o n o f t h e P r o j e c t e d A c t i v i t y
R a t e s by Age a n d S e x , 19 7 1 - 81 186
5 . 2 2 R u r a l - U r b a n D i s t r i b u t i o n o f t h e P r o j e c t e d L a b o u r
F o r c e by Age a n d S e x , 1 971 -8 1 187
5 . 2 3 P r o j e c t e d L a b o u r F o r c e by P l a c e o f R e s i d e n c e a n d
Se x U n d e r T h r e e M i g r a t i o n A s s u m p t i o n s , 1981 189
A p p e n d i x VI
A . V I .1 A b r i d g e d T a b l e M a l e s , 1946
o f E c o n o m i c a l l y A c t i v e L i f e f o r
215
A . V I . 2 A b r i d g e d T a b l e M a l e s , 1953
o f E c o n o m i c a l l y A c t i v e L i f e f o r
216
A . V I . 3 A b r i d g e d T a b l e M a l e s , 1963
o f E c o n o m i c a l l y A c t i v e L i f e f o r
217
A . V I . 4 A b r i d g e d T a b l e M a l e s , 1971
o f E c o n o m i c a l l y A c t i v e L i f e f o r
218
A p p e n d i x V I I
A . V I I .1
A . V I I . 2
A . V I I . 3
A . V I I . 4
E s t i m a t i o n o f A n n u a l E n t r i e s t o t h e L a b o u r F o r c e a n d L o s s e s by D e a t h s a nd R e t i r e m e n t s f ro m t h e L a b o u r F o r c e ( M a l e s ) , 1946
E s t i m a t i o n o f A n n u a l E n t r i e s t o t h e L a b o u r F o r c e a n d L o s s e s by D e a t h s a n d R e t i r e m e n t s f ro m t h e L a b o u r F o r c e ( M a l e s ) , 1953
E s t i m a t i o n o f A n n u a l E n t r i e s t o t h e L a b o u r F o r c e a n d L o s s e s by D e a t h s an d R e t i r e m e n t s f r om t h e L a b o u r F o r c e ( M a l e s ) , 1963
E s t i m a t i o n o f A n n u a l E n t r i e s t o t h e L a b o u r F o r c e a n d L o s s e s by D e a t h s a nd R e t i r e m e n t s f r om t h e L a b o u r F o r c e ( M a l e s ) , 1971
222
223
224
Appendix VIII
A.VIII. 1 Adjusted Unemployed Data by Age and Sex, 1963 227 A.VIII.2 Adjusted Age Specific Activity Rates by Sex, 1963 227
Appendix IX
A.IX.l Estimation of the Number of Job Opportunities
Required by Underemployed, 1971 230
Appendix XIV
A.XIV.l Projected Activity Rates in Three Projections
by Age and Sex - 2 3 6
Appendix XV
A.XV.l Urban-Rural Sex Ratios, 1963 and 1971 241 A.XV.2 Annual Average Rates of Growth of Population in
Selected Nineteen Cities, 1963-71 243
A.XV.3 Estimated Volume of Net Rural-Urban Migration by Settlement Size, 1963-71:
A. Identical Rates of Growth 246
A.XV.4 Estimated Volume of Net Rural-Urban Migration by Settlement Size, 1963-71:
B. Differential Rates of Growth 247
A.XV.5 Rural-Urban Distribution of the Projected Population by Age and Sex, 1981:
A. With 228.5 Thousand Net Rural-Urban Migration 249 A.XV.6 Rural-Urban Distribution of the Projected Population
by Age and Sex, 1981:
B. With 457 Thousand Net Rural-Urban Migration 250 A.XV.7 Rural-Urban Distribution of the Projected Labour
Force by Age and Sex, 1981:
A. With 228.5 Thousand Net Rural-Urban Migration 251 A.XV.8 Rural-Urban Distribution of the Projected Labour
Force by Age and Sex, 1981:
F i g u r e
L I S T O F F I G U R E S
P a g e
C h a p t e r 2
2 . 1 T o t a l P o p u l a t i o n a n d L a b o u r F o r c e b y A g e a n d
S e x , 1 9 4 6 - 7 1 3 6
2 . 2 P a t t e r n o f L a b o u r F o r c e P a r t i c i p a t i o n : M a l e s ,
1 9 4 6 - 7 1 5 4
2 . 3 L a b o u r F o r c e P a r t i c i p a t i o n b y A g e a n d L e v e l o f
E d u c a t i o n : F e m a l e s , 1 9 6 9 / 7 0 6 4
2 . 4 P a t t e r n o f L a b o u r F o r c e P a r t i c i p a t i o n : F e m a l e s ,
1 9 4 6 - 7 1 70
C h a p t e r 3
3 . 1 P r o p o r t i o n o f t h e T o t a l P o p u l a t i o n i n t h e L a b o u r
F o r c e ( C r u d e A c t i v i t y R a t e s ) , 1 9 4 6 - 7 1 7 6
3 . 2 P r o p o r t i o n o f t h e P o p u l a t i o n 1 5 Y e a r s a n d O v e r i n t h e L a b o u r F o r c e ( R e f i n e d A c t i v i t y R a t e s ) ,
1 9 4 6 - 7 1 8 2
3 . 3 a T r e n d s i n A g e S p e c i f i c A c t i v i t y R a t e s f o r M a l e s ,
1 9 4 6 - 7 1 8 4
3 . 3 b T r e n d s i n A g e S p e c i f i c A c t i v i t y R a t e s f o r F e m a l e s ,
INTRODUCTION
Sri Lanka'*' is an island of 25,330 square miles, located eighteen miles off the south-western tip of the Indian subcontinent. It lies between the parallels of 5° and 10° north latitude, and the meridians of 79° and 82° east longitude. The island measures 270 miles from North to South and 140 miles from East to West.
About four-fifths of the island consists of plain land or gently-undulating lowland along the coastal belt, while the remaining one-fifth consists of hills and mountains in the central region. Climatically, the island can be divided into two zones: wet and dry. The wet zone, which comprises the west coast and the central highlands, receives from about 100" to 200" annual average rainfall, and the dry zone (approximately three-quarters of the country) receives from 50" to 75" annual average rainfall. The climate is generally warm and humid, with an annual average temperature
o o
ranging between 78 and 85 Fahrenheit.
Sri Lanka achieved political independence in 1948 after 443 years of foreign domination. During this period the country was under three foreign powers: first, the Portuguese - 1505 to 1655; secondly, the Dutch - 1656
to 1795; and finally the British - 1796 to 1947. The Portuguese and the Dutch were able to take control of only the maritime provinces along the
coastal belt. Several attempts to take control of the central highlands were made, but were resisted by the local kings. However, the British were able to overthrow the Sinhalese kingdom and to establish dominion over the entire island in 1815.
Prior to the declaration of Republic on 22nd May, 1972 Sri Lanka was known as Ceylon. The new name has an historical background. 'Lanka'
Since then regular decennial censuses have been conducted until the series was interrupted in 1931 and 1941 by the Great Depression and the Second World War. However, the population of the capital city, Colombo, was
enumerated in 1931, and the total population was estimated accordingly. The census which should have been held in 1941 was carried out in 1946. The first census after independence was held in 1953, and the next followed 10 years later, in 1963. The latest census was taken in 1971, completing a century of demographic history.
The registration of vital statistics was first introduced in 1847 (Legislative Council of Ceylon, 1847) but, a proper registration was
delayed until 1895 (Legislative Council of Ceylon,1895) when penalties for non-registration were legalised. However, the registration was not
2
particularly reliable until it was influenced by a number of socio-economic factors. For instance, in the case of births, "... encouraged by a system of social medicine, a large proportion of births occur in government
hospitals. This ensures registration. Second, the system of free education, the advantage of which is liberally taken, acts as an incentive to birth registration. Third, the rice ration scheme, through which rice is distributed free of charge or at a subsidised price to Ceylonese, makes it imperative that a birth be registered " (Jayewardena, 1970, p.247).
In Sri Lanka, as in most developing countries, the population has been growing at a relatively high rate; during the 75 years from 1871
to 1946 the population increased at an average annual rate of 1.4 percent. This was a result of both the natural increase as well as the immigration;
immigration played a significant part, contributing about 27 percent (Republic of Sri Lanka, 1972, p.22) of the total increase in population. However, since 1948 migration has ceased to be significant, largely because
of restrictive measures adopted by the government. Nevertheless, the population has increased at a higher rate, averaging 2.6 percent per year, during the subsequent period, 1946-71.
The year 1946 was land-mark in the demographic history of Sri Lanka, as the death rate suddenly dropped from 20.3 per thousand in 1946 to 14.3 per thousand in 1947. This decline in mortality of about 30 percent in one year - a most unusual phenomenon - was mainly the result of the island-wide D.D.T. campaign started in 1945 against malaria - a disease
3
which until 1946 was the main cause of mortality in the country. This drop in mortality was further encouraged by the more widespread use of antibiotics and drugs, the extension of health education and the develop ment of environmental sanitation. Since 1947 the death rate recorded a
downward trend, reaching the low level of 7.5 per thousand in 1971. With such a low death rate, Sri Lanka ranks amongst the countries with the
4 lowest mortality rate in the world.
The factors which influenced the decline of mortality in 1946 have been discussed in detail. Some of the important contributions are Sarkar, 1957, pp.121-36; Newman, 1965; Meegama, 1967, pp.207-38; Newman and Meegama, 1969, pp.285-306; Gray, 1974, pp.205-29.
The crude death rate is affected by the age structure of the population. Therefore, a low crude death rate does not necessarily correspond to a
Since the natural increase is the difference between crude birth rate and crude death rate, any change in one of the factors not
accompanied by a corresponding change in the other, will tend to bring about an increase or decrease in the rate of growth of population accordingly. The spectacular decline in the death rate in Sri Lanka was not accompanied by an equal decline in the high birth rate, 38.4 per thousand in 1946. During the 1950's there was a small and irregular decline in the crude birth rate, followed by a definite downward trend, from 37.0 per thousand in 1959 to 29.9 per thousand in 1971. However, the gap between the crude birth rate and the crude death rate is still wide.
A rapidly falling death rate and a high birth rate have resulted in a very high rate of population growth since 1946.^ One of the implications of the rapid population growth is a fast growing labour force - at an average annual rate of 2.1 percent during the 25 years from 1946-71 - creating a number of important social, economic and probably political consequences. Among them the most important is the growing gap between the labour supply and demand; the supply has been
increasing rapidly overtaking the demand by 0.8 percent points per year. The result has been manifested in the rising number of unemployed and under employed.
However, a comprehensive study of the labour force in Sri Lanka is somewhat premature. The lack of comparable data together with the insufficiency of available information about the determinants of the
5
labour force participation rates are strong deterrants which limit research in this field. Despite these limitations an attempt was made in this study
a. to examine the availability and comparability of the statistical data on the labour force. b. to investigate the major determinant factors
of the labour force,
c. to analyse the labour force trends and their relationship to the population.
d. to examine the structure and characteristics of the labour force.
In the pursuit of these objectives our main concern was with the demographic rather than the economic aspects of the labour force.
The data of the 1946 census can be taken as bench mark, because no complete census was held in 1931, and the accuracy of the labour force data in the 1921 census was controversial (Ranasinha, 1950). In addition, there was no similarity between the definitions used in enumerating the economically active population in the prewar and post-war censuses. The censuses held before 1946 used the concept of 'earner' to identify the economically active population. "It was believed that the definition of the term 'earner' which had been adopted without qualification at previous censuses was too wide and likely to confuse and mislead the enumerator, and that the requirement to record subsidiary occupations imposed on him a difficult task " (Ranasinha, 1950, p.225)* However, the post-war
censuses used the 'gainful worker' concept. The gap between the 'earner' concept and the 'gainful worker' concept is too wide to allow a worthwhile comparison to be made.
in a future year it was decided this study should consist of a labour force projection. The view of the United Nations (1971a, p.6), "The average projection period is approximately ten years, which means that in the calculations the factors which determine trends are long-term factors; short-term variations, generally associated with the effect of a changing economic situation on the size of the labour supply, are disregarded" determined the limitation of this study to the period ending 1981, with a labour force projection for the ten years period from 1971 to 1981.
CHAPTER 1
STATISTICAL DATA ON THE LABOUR FORCE: AVAILABILITY AND COMPARABILITY
1.1 THE LABOUR FORCE CONCEPT
There are two concepts, namely, 'labour force' and 'gainful worker', which have been applied generally, to the measurement of the size of the
economically active population. The labour force approach was developed in the United States during the depression decade of the 1930's, and its prime objective was the measurement of the extent of unemployment, an objective which had not been well achieved with its predecessor, the 'gainful w o r k e r ’
approach (Hauser, 1973, p.l). The major purpose of the 'gainful worker' approach was to enumerate the occupations. Analysis of labour supply,
employment, unemployment etc., was a secondary consideration. The measurement of the size of the potential labour force was based on a question relating to usual occupation, without reference to the labour market activity within a
specific time reference. Many persons, such as retired persons, who were neither employed nor looking for work at the time of the enumeration, were
counted as gainful workers. On the other hand persons who were seeking employment for the first time, but who had no occupation to report, were excluded from the labour force, even though they were actively seeking
’ L a b o u r f o r c e ' i s an e c o n o m i c c o n c e p t w h i c h i s u s e d t o i d e n t i f y a l l
t h o s e p e r s o n s w i t h i n a s p e c i f i e d a g e g r o u p who s u p p l y ( e m p l o y e d ) a s w e l l
a s who a r e w i l l i n g and a b l e t o s u p p l y ( u n e m p lo y e d ) t h e i r l a b o u r f o r t h e
p r o d u c t i o n o f m a r k e t a b l e g o o d s a n d s e r v i c e s d u r i n g t h e p e r i o d u n d e r r e f e r e n c e ,
g e n e r a l l y w eek p r e c e d i n g t h e d a t e o f t h e e n u m e r a t i o n . T h i s recom m ended^
d e f i n i t i o n i n v o l v e s f o u r v e r y i m p o r t a n t c r i t e r i a o f t h e l a b o u r f o r c e , n a m e l y ,
s p e c i f i e d a g e g r o u p o r minimum and maximum a g e , e m p lo y e d p e r s o n s , u n e m p lo y e d
o r p e r s o n s who a r e s e e k i n g and a v a i l a b l e f o r work and s p e c i f i c t i m e r e f e r e n c e ,
a l l o f w h i c h r e q u i r e f u r t h e r c l a r i f i c a t i o n .
C o n c e r n i n g t h e ’ s p e c i f i e d a g e g r o u p ’ , i t i s recom m ended t h a t t h e .
minimum a g e l i m i t s h o u l d b e s e t i n a c c o r d a n c e w i t h t h e c u s t o m s and t r a d i t i o n s
p r e v a i l i n g i n t h e c o u n t r y ( U . N . , 1 9 6 7 , p . 6 1 ) . I n c o u n t r i e s w h e r e a l a r g e
p r o p o r t i o n o f t h e l a b o u r f o r c e i s i n t h e a g r i c u l t u r a l s e c t o r , i n w h i c h n o r m a l l y
many y o u n g c h i l d r e n p a r t i c i p a t e , i t w i l l b e n e c e s s a r y t o s e l e c t a l o w e r
minimum a g e t h a n i n i n d u s t r i a l i z e d c o u n t r i e s w h e r e e m p lo y m e n t o f y o u n g c h i l d r e n
i s i n m o s t c a s e s p r o h i b i t e d by l a w . I n an y c a s e , t h e minimum a g e s h o u l d n o t
2
b e h i g h e r t h a n 15 y e a r s ( U . N . , 1 9 6 7 , p . 6 1 ) . As f a r a s t h e maximum a g e l i m i t
i s c o n c e r n e d no r e c o m m e n d a ti o n h a s b e e n made s o f a r , t h o u g h n o r m a l p r a c t i c e
i s t o a c c e p t 64 y e a r s . H o w e v e r, i n a g r i c u l t u r e an d some t r a d e s p e o p l e c o n t i n u e
t o b e i n t h e l a b o u r f o r c e a s l o n g a s t h e y a r e p h y s i c a l l y a n d m e n t a l l y c a p a b l e .
T h i s i s p a r t i c u l a r l y i m p o r t a n t f o r d e v e l o p i n g c o u n t r i e s w h e r e t h e b u l k o f
The i n t e r n a t i o n a l d e f i n i t i o n o f t h e l a b o u r f o r c e i s s y n on ym ou s w i t h t h a t o f t h e w o r k f o r c e a n d e c o n o m i c a l l y a c t i v e p o p u l a t i o n .
population is engaged in agriculture. It is obvious, therefore, that there is no clear-cut definition of minimum and maximum age limits. However, the over-whelming majority of labour force is between ages 15 and 64 years: in Sri Lanka (1971) 94.7 percent of male and 96.1 percent female labour force were within these age limits. Thus demographically, the population at ages
15-64 years represents largely the bulk of potential labour force.
Employed persons include all those persons above the minimum age limit working for pay or profit, those who have a job but are not at work for
temporary reasons, and the unpaid family workers who assist in the operation of a farm or business, run by the householder, for at least one third of the normal working hours during the reference period (I.L.O., 1959, p.45).
Unemployed persons include all persons above the minimum age limit who are without a job, but are actively seeking and available for work for pay or profit and all persons on temporary or indefinite lay off without pay
(I.L.O., 1959, p.45).
All other persons above the minimum age limit who do not fall in the above categories are not classified as being in the labour force. They can
3
be categorised into six groups as follows:
a. Persons living on independent incomes. b. Inmates of institutions.
c. Unpaid family workers who work less than one third of normal working hours.
d. Retired persons.
e. School children and persons attending schools full time.
f. All other persons not falling into any of the above five categories.
3
The choice of a specific reference period is fundamental since it affects the size of the labour force and the classification of persons
therein according to whether they are employed or unemployed (Social Science Research Council, 1947, p.17). The reference period should not be too long or too short. If it is too short, one day for example, the unemployed segment of the labour force will tend to increase and some persons who do not manifest any labour market activity on that day will appear neither as employed nor unemployed but as non-workers. On the other hand, if the
reference period is too long, a month or a year for example, the labour force will be larger and the employed segment will tend to increase. To overcome
this discrepancy, the acceptance of the week preceding the census or survey date is recommended as the reference period.
1.2 LIMITATIONS OF THE RECOMMENDED DEFINITION
The limitations of labour force data can be considered under two headings, general and special. General limitations apply to the definition and coverage of the labour force; special limitations are concerned with reporting, editing and classification.
When the enumeration is made, the definition concerning the employed persons of the labour force raises a number of limitations and practical problems. There is no problem at all with persons employed in government and well established private businesses. The enumerator can readily identify
them, since in most cases they are employed full-time throughout the year. However, there are seasonal and part-time workers who cannot be identified easily. The enumeration of seasonal workers is a far more acute problem in developing countries which are predominantly agricultural. Since most crops require only seasonal work in agriculture, there arises the problem of
t h i s c a t e g o r y J a f f e e t a l . ( 1 9 5 1 , p . 5 9 ) s a y , " O f t e n o t h e r w o rk o p p o r t u n i t i e s
may n o t b e a v a i l a b l e s o t h a t t h e i n d i v i d u a l , i n t h e o r y , c o u l d b e c l a s s i f i e d
a s i n a c t i v e l y s e e k i n g w o r k . On t h e o t h e r h a n d , h e c o u l d b e c l a s s i f i e d a s
n o t i n t h e l a b o u r f o r c e s i n c e h e was n o t w o r k i n g an d was m a k in g n o e f f o r t
t o s e e k w o r k . F u r t h e r , i f h e h a s a s m a l l p l o t o f g r o u n d on w h i c h h e c a n
s p e n d a few h o u r s ’ w o rk p e r w e e k , h e i s c l a s s i f i e d a s e m p l o y e d , . . . " . The
q u e s t i o n o f e n u m e r a t i n g s u c h p e r s o n s a s p a r t o f t h e l a b o u r f o r c e i s d i s p u t a b l e .
I n o r d e r t o m e a s u r e s e a s o n a l v a r i a t i o n s , t h e ILO recom m ended ( 1 9 5 9 ) t h a t
t h e r e b e s p e c i a l s t u d i e s m ore f r e q u e n t l y t h a n o n c e a y e a r . T h i s , h o w e v e r ,
c a n n o t b e i m p l e m e n t e d i n many d e v e l o p i n g c o u n t r i e s s i n c e s u c h s u r v e y s i n v o l v e
a l a r g e e x p e n d i t u r e a n d a r e a d r a i n on r e s o u r c e s .
I n a d d i t i o n , i n a g r a r i a n s o c i e t i e s t h e r e i s a s y s t e m o f s h a r i n g a v a i l a b l e
w o r k among a v a i l a b l e p e o p l e . T h i s c a n b e s e e n p a r t i c u l a r l y i n r u r a l a r e a s .
I f t h e r e i s w o rk a l m o s t a l l o f t h e v i l l a g e r s (who a r e c a p a b l e t o w o rk ) a r e 4
f u l l y o c c u p i e d . On t h e o t h e r h a n d , i f t h e r e i s n o w o rk a v a i l a b l e a l m o s t a l l
o f th e m a r e u n e m p l o y e d . The i n t e r n a t i o n a l l y recom mended d e f i n i t i o n o f t h e
l a b o u r f o r c e i s n o t w i d e e n o u g h t o c o v e r t h i s k i n d o f s p e c i a l s i t u a t i o n .
D i f f i c u l t i e s a l s o a r i s e w i t h t h e t r e a t m e n t o f p a r t - t i m e w o r k e r s , a s
i t i s d i f f i c u l t t o i n c l u d e some o f th e m i n t h e p r e s e n t d e f i n i t i o n . F o r
i n s t a n c e , a f u l l - t i m e s t u d e n t may w o rk a s a c l e r k o r a c l e a n e r d u r i n g t h e
n i g h t , o r d u r i n g h i s ' o f f ' p e r i o d s , a n d may l i v e on t h o s e e a r n i n g s . The
e n u m e r a t i o n o f s u c h p e r s o n s a s p a r t o f t h e l a b o u r f o r c e i s n o t e a s y .
H o w e v e r, t h e e x c l u s i o n o f p a r t - t i m e w o r k e r s r e s u l t s i n a n u n d e r s t a t e m e n t
o f t h e t o t a l l a b o u r f o r c e . The b e s t e x a m p l e can b e g i v e n f r o m t h e
4
1961 census of Australia, where a fraction of the part-time workers were excluded. They were enumerated as part of the labour force in the 1966 census for the first time in Australia, and the 1966 census report (Bureau of
Census and Statistics, 1971, p.7) summarizes the effect in these terms*. "The net effect of the new definition is to include approximately 108,000 additional persons in the Australian work force. ... The major factor in this change was females working part-time (sometimes for only a few hours a week) some of whom in 1961, did not consider themselves as ... engaged in an
industry, business, profession, trade or service". Therefore, the observed data of the 1961 census in Australia were not comparable in all respect with the 1966 data. To overcome this kind of difficulty, and to obtain a more meaningful measure of labour supply, it is suggested that attention be paid
to the distribution of the labour force either according to part-time versus full-time status or else by taking into account hours of work (Bowen
et al.. 1969, p.14).
The size of the labour force is not independent of the demand for
labour, and these are not always in equilibrium in any country. Even though a country is at full-employment level there can be some involuntary unemploy ment, say up to 3 percent. It is true that the definition of the labour force covers unemployed persons. But the problem is that unemployment itself tends to reduce the overall labour force participation rates. The higher the unemployment rates, the greater the effect of 'discouraged worker' on the
labour force. This hypothesis has been supported by recent empirical evident In a discussion of married women in the labor force Cain (1966, p.64)
groups (i.e. 65 years and over and 55 years and over respectively) who are discouraged from entering the labour force because of the prevailing unemployment. In contrast to the ’discouraged worker’ hypothesis, attention should be given to the 'additional worker' hypothesis also, because it tends to increase the overall labour force participation rates when unemployment exists. According to the 'additional worker' hypothesis, when the head of the household or the breadwinner of the family is unemployed, there is a greater tendency for the other members of the family to enter the labour force than when the head of the household or the breadwinner is employed, since they have to attempt to supplement the family income. However, recent findings (Cain, 1970, p.27) suggest that, for the labour force as a whole the 'discouraged worker' effect predominates, with the result that the net effect of unemployment is to reduce the total labour force. Therefore, it may be assumed that in any country where unemployment exists, there are persons outside the labour force who could be put to work immediately if jobs were offered. The problem is more acute and the value of the labour force data is severely limited in such countries, particularly developing countries, where the unemployment rates are substantially high and represent a long-term trend.
The third category is unpaid family workers. This group is mainly composed of children attending schools, and housewives who work more than one-third of the normal working hours in an economic enterprise operated by a related person living in the same household without pay or profit. A
few of them can be easily identified as unpaid family workers, but the
majority cannot be so identified. It is very difficult to draw a distinction between the women who prepare meals for the farm labourers and do other odd
the discretion of the enumerator or the respondent. Sometimes the respondents may not be in a position to give the correct number of hours which they spend
in such a business or farm. Another difficulty is that some unpaid family workers may not think of themselves as employed, and may not be so regarded by other members of their families, although they are engaged in work which can be classified as work done by unpaid family workers. The problem of the measurement of this category as part of the labour force is not confined to agriculture; it influences even manufacturing industries where production is organised in small family-operated units.
The definition of the labour force does not cover underemployed persons, and until very recently there has been no general agreement about defining underemployment. Underemployment is generally divided into two distinct categories: visible and invisible. "The former includes less than full
time employment on the part of persons who want more work; the latter includes persons who, although they work ’full time’ (however that may be defined), are engaged in activity with such low productivity as to produce miserably low returns, or persons who are working at an occupation below the level
for which they have been educated or trained" (Hauser, 1973, p.5). At present, when an enumeration is made, underemployed persons are counted as employed. This situation may affect the quality of the labour force data, particularly in the developing countries where underemployment is common. However, at a meeting of experts convened in Geneva by the I.L.O. in November 1971, to study the under-utilization of labour in developing countries, Professor Hauser
(1973, p.5) suggested a method to obtain measurement of both the invisible
At the census enumerations normal practice is to measure the number of days worked during the week preceding the census date, but no questions are asked to measure the number of hours worked. Therefore, a person who worked less than normal working hours, say 2 hours a day, will be
and visible underemployment (See Appendix I). Empirical studies are being conducted in 11 countries to test the method.
The lack of uniformity concerning the age limits in the recommended definition of the labour force raises special limitations in the case of statistics for comparative purposes. Not all countries have established minimum age limits for labour force statistics, while some have adopted
relatively low ones. For instance, the 1946 and 1953 censuses of Sri Lanka did not prescribe a lower age limit for determining a person’s activity status. Reviewing more than sixty censuses and surveys conducted in African and Asian countries during the period from 1955 to 1964, Yuki Miura (1967, p.374)
observed that Libya, United Arab Republic and Kong Kong had set their lower age limits as 6 years and Sudan as 5 years. Even if there are accepted age limits, the transition of a young person from student to working status, or of an adult from working to retired status, does not always take place in a clearcut way. It is a gradual process. During a specific period of time, an individual may have dual characteristics (U.N., 1962, p.3). There is no provision in the recommended definition to cover this category.
Moreover, according to the recommended definition, any person who was neither employed nor seeking work during the reference week is excluded from
the labour force though he might have worked during the rest of the year (Durand, 1948, p.14)^. On the other hand, a person who did any work at all during the reference week is enumerated as a member of the labour force.
The next limitation arises with the selected date of enumeration. The volume of the labour force depends on the week preceding the date of
6
enumeration. If the census or survey date falls during the cultivating or harvesting seasons, or during the summer vacation, the volume of the labour force tends to be higher than during the rest of the year. When selecting the date of enumeration, particular attention should be given to minimizing the seasonal variations.
Finally, during the specified week, the number of days or hours a person should work to be classified as part of the labour force is also difficult to ascertain. No provision is made in this regard in the recom mended definition. Yuki Miura (1967, p.373) observed that the limit of amount, of time worked was totally overlooked in four African censuses, and that some Asian countries had set varying limits - in Japan the minimum was one hour during the reference week, whereas in India (National Sample
Survey) it was one day. The comparability of such data is very limited, since the situation may tend unduly to inflate or deflate the volume of the labour force.
Limitations of reporting may occur because of mistakes by the enumerator or the respondent. The labour force data are obtained by hundreds of field workers who are frequently part-time and intermittent workers.^ Not all of them are highly trained for the purpose. This is particularly true in the case of the developing countries.
The results of a census or survey depends on the respondents’ answers. Whatever the reasons, if they give incorrect particulars, both the quantity and the quality of the data will be adversely affected. The rate of
illiteracy in the developing countries is high as compared with the deve loped countries. In such cases, most people do not know the value of the
7
census count. They simply answer the enumerators' questions without
g
ascertaining facts, or they deliberately supply incorrect particulars. Similarly, if people are apprehensive or sensitive about the census or
9
survey, they may tend to conceal the correct information. In the great majority of the cases information is furnished by the head of the household
for the whole family. It appears reasonable to assume that he or she can give correct information regarding the members of the family who are at work, but the same person cannot be expected to give correct answers
regarding the intentions of others to seek work or not. Therefore, the information obtained may tend to understate the extent of the unemployed segment of the labour force.
When discussing the labour force concept, Bancroft (1958, p.186) summarizes the limitations of definition in these terms. "In the system of labor force concept, the labor force itself is a by-product. It has no independent definition or identification. Persons were not tagged
as members of the labor force and then queried about their employment status".
1.3 AVAILABILITY OF THE LABOUR FORCE DATA
The major source of the labour force data is the population census. In Sri Lanka, there were four censuses during the period from 1946 to 1971; viz, 1946, 1953, 1963 and 1971. The results of the 1963 census are not yet
Generally, in any country, there are some people who like to exaggerate their present position. For instance a clerk may report as an accountant.
published, to say nothing of the 1971 census results, which are still being processed. However, unpublished data of the censuses of 1963 and 1971 were made available for this study (in the case of the 1971 census, the
10 percent sample tabulation).
In addition to the population censuses, data on economically active population are available as a result of six sample surveys^as follows:
a. Survey of Consumer Finances 1953
b. Survey of Employment, Unemployment and Underemployment 1959-60
c. Survey of Consumer Finances 1963
d. Sample Survey of Rural Employment 1964 e. Labour Force Survey 1968
f. Socio Economic Survey 1969-70
It is important to note that the labour force data in most of these surveys are by-products. The main purpose of the two Consumer Finances Surveys (i.e. 1953 and 1963), and of the Socio Economic Survey 1969-70, was not to measure the volume of the economically active population but to
collect data on other variables. For instance, the report of the Consumer Finances 1963(Central Bank of Ceylon, 1964, p.4) says that its primary objective was to "secure direct estimates relating to income, expenditure, housing and other social characteristics and indebtedness of households
and spending units". Even the reliability of the data in the 1964 Rural Employment Survey is far from being satisfactory, since the size of the
sample was too small to be considered representative for the country as a
The 10 percent sample tabulation of the 1963 census results were published in 1967.
whole (Srivastava et al., 1970). In fact, for the purpose of the measure ment of the total labour force of the country there were only two household sample surveys undertaken during the period 1946 - 1971, i.e.,'Survey of Employment, Unemployment and Underemployment 1959/60' and 'Labour Force Survey 1968'.^
There are also other subsidiary sources of labour force data. Some of these are: data collected under Employees Provident Fund Act, Annual Censuses of Employment under the Department of Labour, Annual Surveys of Industrial Production and Employment, Returns of Employment under the Wages Board Ordinance and the Reports of the Employment Exchanges. With the exception of the last, the Reports of the Employment Exchanges, all the subsidiary sources consist of data of only one segment of the employed population, i.e., persons employed in government and private institutions which come under the Wages Board Ordinance. The data on thousands of self-
employed persons, as well as unpaid family workers and unemployed persons, were not included in those reports. Similarly, the Reports of the Employment Exchanges supply information only on persons registered at such institutions who are unemployed and who are seeking better employment. Probably the
unemployed persons in the estate and rural sectors, who in general make little use of these institutions, are excluded from their reports. Therefore, for the purpose of analysing the labour force trends the data of the subsidiary sources are very limited.
It is widely accepted that a population census is a complete and detailed inventory of demographic, economic and social characteristics of the population, since it covers the total population of a country. However, in Sri Lanka even population censuses do not provide detailed information
12
on all aspects of economically active population, such as ethnic composition, marital status. Nevertheless, this study is mainly based on the results of the censuses 1946, 1953, 1963 and 1971.
1.4 COMPARABILITY OF THE CENSUS DATA
There are four main kinds of conceptual problems influencing the comparison between the data of the economically active population in the four censuses. The first one arises with the definitions used in the enumeration of the economically active population. It is true that all four censuses used the 'gainful worker' concept, but the problem is .that the definition of the 'gainful worker' concept itself has varied from one census to the other. Tables 1.1 and 1.2 summarise the most significant features of the definitions and the questions asked in the censuses to
identify the economically active population and their occupational structure respectively.
It will be seen from Table 1.1 that, of the four censuses, the 1946 and 1953 censuses enumerated only the unemployed persons with previous experience as part of the 'gainfully employed', while the 1963 and 1971 censuses enumerated both categories; the persons who were seeking jobs
TABLE 1.1
THE MOST SIGNIFICANT FEATURES OF THE DEFINITIONS WHICH WERE USED IN THE CENSUSES BETWEEN 1946 AND 1971
TO ENUMERATE T1IE ECONOMICALLY ACTIVE POPULATION
Census Year
Approach (Gainful worker
or
labour force)
Time reference
Lower age limit
* U.F.W.
Treatment of Unemployed p .E .** F.T.***
1946 Gainful worker — — NI I NI
1953 Gainful worker One week**** I I NI
1963 Gainful worker One week 5 I I I
1971 Gainful worker One week 10 I I I
* Unpaid Family Workers.
** Unemployed persons with previous experience. *** Persons who are seeking jobs for the first time.
**** To enumerate seasonal workers the reference period was extended to cover the entire cultivation period.
NI = Not included. I = Included.
[image:33.555.58.524.31.590.2]pH £ X P M H H O 2 : P w X
o H
P CO
o CO
EH Eh P P r^ P X rH 3 O P H O M vO Eh <3 P iH P X c o O w X CO O £3 CO > !Z M w EH o P < w h-P H >HP
P P3 C P o M n S w o p CO o C o p CO X w o p
M Eh H CO P W O X C ö X pH O P O X > X S P ►7“* E x
r* P 6 0
cd cd cd cu
3 • (U •H r£d
Cß Cß cd cu • j d X P p •
>_4 0 • o a CU p p P ' 0 cd
1 cd X •H O CJ • cd O P ÖD o
<u CU p P P r\•H Cß p cd •H
p P -Cd •H cd X > d> X P X p P
Cß p p > X X p P p P Q pH cd p cd
0 •H o •H 0 P p CU cd rH p p cu p
Cß 0 > p CU P o o Cß Cß p cd p o cu
0 O P p O CJ £ dd Cß d> • cd cu cu E
CU •H P Cß cd cd o P p p p dJ cd p 0
C J P CJ cd CJ cp cd o p cj o P o cx cd
Cß cd o • H i—I P O p cd cd cd o cu
p CU Cß X cd cd Cß cu cd p X
e' 0 4H P 0 X x p p Cß e P p Cß CU4M
er» O' O CU •H •H p cd o cu x cu o cd cd CU O
P P O CJ P c d o -cd o QJ £
<U P Cd cd Pi p p p p X Cß i—1 CU
P P CU •H p cd Cß cx cu P P 0) p
P O > P p p p d) e jC O CU 4-J -cd cd
Eh 4H o X CP o X r & w 3 £ c x cd p p
o uo vO p <X)
p p p P P P
4-1 •H Cn X
Cd ÖO
cd cd
> o P P P P
CJ O £ cd £ o -C P ÖD
<u cd p
-Cd P O P -bd 4M
< u cu
£ (!) O 3 0) (0 CT! P Cß Cß Cd CU o CO o CTx t — I
Cß Cß
cd cd «
CO o o cd <u
Cß Cß o cd
cd p p PH P o
• Cd 4M Q) <u PH cu Cß cu P p p
X O pH P cd ÖD P cx dd cx Cß cd
P P Cß o cd •H o • D CX X
•H Cß P Cß Ln •H e p •H CU p O 0 P
P> cd > cd o £ • cd <u > o cu *H • CJ O P O P P nd p O p 4M • pH <U cd PH > p O £ cd P P P CJ CD cd i—1 . cu Cß o P <u O (U cu o o CJ P CJ CO *H P Cß pH P P p CX P P P pH 4M •H < cß cd o cd o CU o P <U cx P CX CX o P o
P CU P p 4M •H P cd jsd E - e (U E 1—1 cd
Cß 4M dd mm Cß <u P cx (X P 0) p cx <u p cx CX P <U O e r o p cd > CU o e cd o cd •H X cd o E p cd
d) -cd o o j d t o w X £ X £ CU x Cd cu O P
O ' <U cu cu t o Cß p cu cd - x
cx j d c x d) P p p . • . • p
pH EH Ph O CU cd 4M cd •H •H p > p P
Eh ^ P Cß CX cd O o •H p p x o
p O l CM
Z I CM
CO CM
cd E i cu
o o E p i
cu p P -cd <u cd
Cß p p CU S cd x p o
Cd cd cd cd cd cd cu Cß p Cß o p cx P cd p .
&1 cd •H Cß 0 cd o 4M p E
cu P o cu P P Pd X cu
o Cß 1 u cd <U >_' cu cd
cu o 4h o P rH dd
CO O cd •H Cß . P O
uo o o p p P P o • P 4M er» P cd <u cd o -H X O 1—1 P CX 4h X cu ✓ *h P . E
cd •H 1—1 xd xd o P Cß cu X cx o cu 4M cd cu ^ ' Cß Cd cd o • 0 cd Cß o (U X Cd P dJ p p o p X o xd X cd p cd u p 4h p cu P X) cd p 4M CU <U o X O o xd x cd p CO W x E
o X CO X
X rH p P CM
£h
1 p P -cd
-cd rH * i cd cd p
cd Cß o o p di p cd
o 1 cd p p cu P o cd o
p Cß cd -cd X Ch o CJ Cß E Cß cd p p CU 4H E o s CJ 0 o cd Cß . E o cu i—i cd a p
Cß •H a -Q P P cd X p cu cu
cd P 0 0 cu »» CU S o p p E o cd cu X cu Cß CJ Cß cd P o o o cu S r H
o cu O p cu cd -cd Ch Cß CUo o Cß d> o 4M cd cd cu £ P Cß X p (U I—1 cu X O o cu P p • P cu CU (U Ch cd X ÖÖ HT 1—1 cd cß cd p Cß cd Ö D jd o o E cd o> cd Cß 4M CU P o cd d) p cd p p <u £ p cx cd o Cß cu X Cß 00 • CU X ö D
p cd P -Q cd X cd di cd x -cd E cd 4M P o <U cu o p o cd p -O <u cu <up P o cd S CJ cd cß Cß cu
•H cd P X • • .
P P cu 4M 4M cu cu p •H P CX o p P O X xd •H P P
o . . .
X o rH CM
!--1 rH CM
these reasons the majority of rural youths were confined to villages where they helped their parents. Moreover, as a consequence of the Second World War there was an improvement in the economic structure of the country and
there might have been enough job opportunities in the estate (tea, rubber and coconut) sector. This was further improved by the effort of the
government to produce more food to meet the war time situation. Therefore, the persons who entered the labour force might have been able to find jobs without difficulty.
Similarly, as a result of the Second World War, there were many job opportunities in the urban areas. "Immediately following the Second World War, Colombo was the head-quarters of the Supreme Allied Command for the
South-east Asia Campaign. This may have had the effect of providing higher than usual opportunities for employment" (Sundrum, 1959, p.ll). In addition, the privilege of English education, which was well established in the urban areas under the Colonial Government, had helped the urban youth to find a
job very easily compared to his counterpart in the villages.
The 1953 census also excluded persons who were seeking jobs for the first time from the 'gainfully employed'. The economic structure of the country was still able to absorb its people in employment. Moreover, the effects of the Korean War were favourable to the economy during the early 1950's. The increasing export prices resulted in the expansion of production as well as a demand for labour. In addition to that, hugh colonization