Int. J. Electrochem. Sci., 10 (2015) 7212 - 7226
International Journal of
ELECTROCHEMICAL
SCIENCE
www.electrochemsci.org
Electrochemical Corrosion Behavior of a Co20Cr Alloy in
Artificial Saliva.
R. A. Rodríguez-Díaz2,4*
, A. L. Ramirez-Ledesma2, M. A. Aguilar-Mendez3, J. Uruchurtu Chavarin1, M. A. Hernández Gallegos3
, J A Juarez-Islas2. 1
Centro de Investigación en Ingeniería y Ciencias Aplicadas, UAEM, Av. Universidad 1001, Col. Chamilpa, Cuernavaca Mor., México.
2
Instituto de Investigaciones en Materiales-UNAM, circuito exterior S/N, Ciudad Universitaria, C. P. 04510, México DF, México.
3
Facultad de Ingeniería, Universidad Nacional Autonoma de México, Circuito Exterior s/n Ciudad Universitaria, 04510 Mexico, DF, Mexico.
4
Universidad Politécnica del Estado de Morelos, Boulevard Cuauhnáhuac No. 566, Col. Lomas del Texcal, Jiutepec, Morelos.
*
E-mail: rdiaz.unam@gmail.com
Received: 29 November 2014 / Accepted: 2 February 2015 / Published: 28 July 2015
The corrosion behavior of Co20Cr (at. %) together with 316L stainless steel (SS) in artificial saliva solution during nine immersion days at room temperature have been studied and assessed by means of electrochemical techniques. Techniques included potentiodynamic polarization curves, electrochemical impedance spectroscopy (EIS) and linear polarization resistance (LPR) measurements. Results have shown that the corrosion rate of Co20Cr alloy resulted higher as compared with that of stainless steel 316L biomaterial, using polarization curves. Besides, corrosion potential of Co-20Cr alloy resulted more active. 316 L stainless steel exhibited a more defined passivation zone, while the Co20Cr alloy exhibited a pseudo-passivation zone. Although the pitting potential of binary alloy is higher. The measured values of Rp at the end of the exposure time are related to a higher stability of the film composed by the corrosion products formed on Co20Cr alloy as compared with those of the 316 L SS, which is related to a minor corrosion rate of the CoCr alloy after the third day of immersion. Corrosion behavior is explained in terms of the stability of the corrosion products formed film.
Keywords: Corrosion, Co-Cr alloy, dental materials, electrochemical techniques, artificial saliva.
1. INTRODUCTION
cost, availability, biocompatibility, and aesthetic values. The corrosion behavior of metallic materials for dental applications usually is the most important property because of biocompatibility and cytotoxicity of the products generated by the corrosion process [1].
Metal alloys are extensively used materials in prosthetic dentistry due to their high durability and good mechanical properties. Nowadays the use of non-precious metals and alloys is rapidly growing and are replacing precious or noble alloys in dentistry. They are being used in full-cast and metal-ceramic restorations and also as removable partial dentures. Around 90% of all removable partial dentures are now cast from non-precious alloys containing Co, Cr, and Ni [2].
These alloys possess good mechanical properties, and therefore can be easily cast into desired thinner shapes viz. crowns, bridges, fixed or removable partial dentures without losing the rigidity [3-5].
Co-Cr-Mo alloys are extensively used in orthopedic implants due to their high mechanical resistance combined with good corrosion properties in human body fluids. The latter are due to the formation of a protective passive film mainly composed by Cr oxide.
With the exception of noble metals, most dental materials corrode in the oral cavity. The majority of dental metals and alloys are resistant to corrosion due to the formation of a passive and protective film on its surface. This passive layer can usually be quickly re-formed if it is destroyed. An impediment to this process of re-establishment of the passive layer, however, is the presence of chlorine which is present in the oral cavity; the presence of Cl ions inhibits the re-formation of the layer and accelerates corrosion. The consequences of corrosion promoted by chlorides are reduced by the fact that there are other molecules present in saliva that help to protect the metal [6].
The performance of Co-Cr based alloys has motivated several investigators to study their mechanical properties, corrosion behavior and their degree of tolerance by tissues under simulated physiological conditions [7-10].
In order to obtain more information about the mechanisms of corrosion that occurs in alloys exposed to the simulated physiological media, electrochemical techniques are more convenient than conventional gravimetric methods in which the weight loss is measured and sometimes meaningless for localized attack.
Ameer et al. [11] studied the corrosion behavior of Ni-Cr and Co-Cr base alloys by potentiodynamic polarization and electrochemical impedance techniques and the authors concluded that Co-Cr-Mo alloys are more corrosion resistant as compared to Ni-Cr-Mo alloys.
Mareci et al. [12] studied the corrosion behavior of Ag–Pd and Co-Cr (Vitallium 2000) alloys exposed to artificial saliva using the potentiodynamic polarization and electrochemical impedance spectroscopy (EIS) techniques. They concluded that the Vitallium2000 alloy exhibited excellent corrosion resistance and can be used as an alternative to Ag–Pd alloys to fabricate fixed prosthetic elements.
Hodgson et al [14] studied the electrochemical properties of a CoCrMo alloy exposed to simulated body conditions and the relevant mechanisms in the passive and transpassive states. For this study, the electrochemical techniques such as potentiodynamic and potentiostatic polarization, cyclic voltammetry, rotating disc electrode and electrochemical impedance spectroscopy were employed. The authors found that the passive film on CoCrMo changed in composition and thickness with both potential and time. They concluded that the passive behavior of the CrCrMo alloy is due to the formation of an oxide film highly enriched with Cr (≈90% Cr oxides) on the alloy surface. The passive and transpassive behavior of the alloy is hence dominated by the alloying element Cr.
Thus, the purpose of this work is to investigate the corrosion behavior of binary Co20Cr (at. %) alloy in simulated human saliva solution for their potential application as biomaterial.
2. EXPERIMENTAL PROCEDURE
2.1. Materials
The Co-20Cr % wt. alloy was elaborated by mixing pieces of commercial elements of Co, Cr (ingots with a purity of 99.8 at. %). The alloy was prepared by the high-frequency vacuum induction melting technique. The high purity elements (Co and Cr) were placed in an alumina crucible (the alumina crucible, in turn, was put inside a graphite crucible in order to protect it from thermal shock). It is noteworthy that the molten cobalt-chromium alloy was cast by gravity, using a mechanical system implemented in the induction furnace accompanied by a modification to the crucible of alumina. This change was made by machining a small hole in the base of the crucible for placing a rod of the same material (alumina) in this hole and cover it with a top. Thus, when the alloy was completely molten, then the hole was uncovered to let the metal to flow by gravity into a rectangular copper mold.
2.2 Sample preparation
In order to prepare the samples for corrosion tests, the produced ingots were cut by a diamond wheel cutter into small parallelepiped pieces. Samples with an exposed area ranging from 0.5 to 1.0 cm2 were prepared by encapsulation in epoxy resin.
For revealing the internal structure of as-cast Co-20Cr alloy, the specimens were metallographically prepared prior to observation and examination by optical and electron microscopy in order to gain valuable data about Co-Cr alloy characteristics. Metallographic preparation of encapsulated specimens was performed by grinding the specimens from 400 to 2000 grit paper and polished with 1 μm alumina powder.
2.3. Electrochemical Techniques.
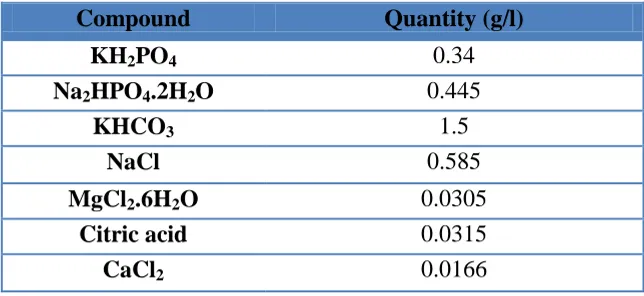
chemical composition for this environment for in vitro corrosion studies is given in Table 1. It was prepared with double distilled water and analytical grade reagents.
Potentiodynamic polarization curves were obtained by varying the applied potential from -1250 mV with respect to the free corrosion potential, Ecorr, up to 1250 mV at a scan rate of 0.5 mV/s. A conventional three electrodes glass cell was used with a graphite sheet as auxiliary electrode and a saturated calomel electrode (SCE) as reference. Corrosion current density values, Icorr, were calculated by using the Tafel extrapolation method and by taking an extrapolation interval of ± 250 mV around the Ecorr value once stable. Linear polarization resistance, LPR, measurements were carried out by polarizing the specimen from ± 20 mV with respect to Ecorr, at a scanning rate of 0.166 mV/s periodically within the total immersion time of 9 days. Electrochemical impedance spectroscopy tests were carried out at Ecorr by using an AC signal with amplitude of ±10 mV and a frequency interval of 0.05 Hz – 10 kHz. The electrochemical free corrosion potential as a function of time of the working electrodes Ecorr, was measured versus a saturated calomel reference electrode (SCE).
[image:4.596.137.459.397.545.2]An ACM potentiostat controlled by a desktop computer was utilized for all the electrochemical tests. The linear polarization resistance and electrochemical impedance spectroscopy were performed during different days within a period of 9 days.
Table 1. Chemical composition of the Artificial Saliva.
Compound Quantity (g/l)
KH2PO4 0.34
Na2HPO4.2H2O 0.445
KHCO3 1.5
NaCl 0.585
MgCl2.6H2O 0.0305
Citric acid 0.0315
CaCl2 0.0166
Corrosion Rate in terms of penetration rate was determined by using Faraday’s law according to equation 1.
1 Where: CR is given in mm/yr, icorr in μA/cm2, K1 = 3.27 x 10⁻³ mm g / μA cm yr, ρ = density in g/cm3. The alloy equivalent weight, EW can be determined from equation 2.
2.4 Microstructural analysis of as-cast and corroded specimens.
The specimens in as-cast condition was encapsulated in epoxy resin and the metallographic preparation of the encapsulated specimen was performed by grinding the sample from 400 to 2000 grit paper and polished with 1 μm alumina slurry. The as-cast and corroded specimen surfaces (taken after potentiodynamic polarization test) were analyzed with a scanning electron microscope (SEM). Chemical microanalysis and (ray chemical mapping), were carried out with an energy dispersive X-ray analyzer (EDX) attached to the SEM).
In order to determine the crystal structure and phases identification of the corrosion products, a Siemens D5000 X-ray diffractometer was employed, using Co tube (Kα line radiation: λco = 1.79 Å), and a diffracting beam graphite monochromator. The XRD patterns were recorded in the 2θ range from 5 to 90° with step size of 0.008° and a time per step of 3.2 s.
3. RESULTS AND DISCUSSION
3.1 Microstructural characterization of un-corroded alloys.
[image:5.596.97.498.367.670.2]3.1.1 Microstructure characterization by scanning electron microscopy
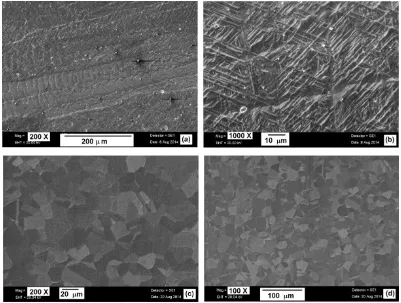
Figure 1. Microstructures of a), b) the as-cast Co20Cr alloy and c), d) 316 L stainless steel.
surface of the sample which was perpendicular to the mold during solidification. This illustration shows the dendritic growth which shows dendrites growing from the edge of ingot that was in contact with the casting mold to the center of ingot. Bright small precipitates are also distributed inside the dendrites and in the inter-dendritic region. The chemical analysis performed on precipitates observed in figure 1 b) by The Energy Dispersive Spectrometer (EDS) revealed that some of these small bright precipitates corresponded also to the σ-phase with a complex tetragonal crystal structure. According to the Co-Cr binary-alloy phase diagram [15], the sigma-phase with a CrFe crystal structure type can be formed within Cr concentration between 54 and 67 at%. In addition, the Cr content of the other precipitates observed was higher than 80 at. % .This interval of chemical composition corresponds to the existence of the solid solution Cr-bcc or to the δ-Cr metastable phase with disordered crystal structure derivable from the Cr3Si structure [16, 17].
Striation was observed in the surface of Co20Cr alloy, as shown in figure 1 b). According to previous research [18], the striation indicates the presence of twin boundaries.
The microstructure of the 316L SS is showed in Figures 1 c), d), where an equiaxed morphology of austenitic grains, is observed. In these micrographs, some twins can be observed inside various grains.
3.2 Potentiodynamic polarization curves
The samples were immersed in the electrolyte (artificial saliva) and the potential was measured. Potentiodynamic polarization tests were started after the initial corrosion potential reached a stable value (after approximately 30 minutes). Potentiodynamic polarization curves of Co20Cr samples and 316L stainless steel were obtained by varying the applied potential from -1150 mV to 900. The aim of polarization measurement in this range is mainly to exceed the potential of +300 mV, which is equivalent to the corrosion potential inside the mouth [19].
Polarization curves of binary Co20Cr alloy together with 316 SS are displayed in Figure 2, where it can be seen that both alloys exhibited an active-passive behavior. It can be observed that the 316 L stainless steel showed a more defined passivation zone, while the Co20Cr alloy exhibited a pseudo-passivation zone followed by a pitting potential of the unstable or soluble passive film formed on surface of Co-Cr alloy. The formation of the pseudo-passive film on Co20Cr alloy´s surface began at a potential of about -341 mV. A range of pseudo-passivity of 690 mV in the Co alloy was observed. The pseudo-passive film is enriched with chromium due to the formation of Cr2O3 oxide; this asseveration is based on a previous study [20], where investigations were performed in one Co30Cr6Mo (wt. %) alloy exposed to the physiological Hank's solution. In this research, the film’s composition as a function of the applied potential during cycling voltammetry tests was examined using X-ray photoelectron spectroscopy. The authors observed that at potentials E ≤ 300 mV, the passive film was enriched by Cr, but at the same time, the Co was depleted within the layer.
studied the corrosion behavior of the Co75Cr20Mo5 and Co72.5Cr22.5Ni5 alloys in artificial saliva; in this investigation the authors reported that the measured Ecorr values for these alloys are: -430 and -400 mV respectively. So in this case, the addition of Mo and Ni did not seem to change de corrosion potential significatively.
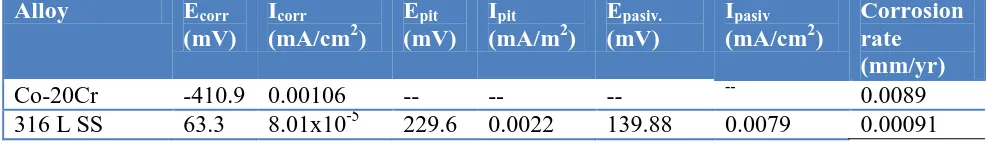
Also shown in Figure 2 and Table 2, the lowest corrosion current density was for the 316 L Stainless Steel with Icorr = 8.01 x 10⁻⁵ mA/cm2. The highest value was for the Co20Cr (pm) alloy, with Icorr = 0.00106 mA/cm2, potentially presenting the highest rate of corrosion. Giacomelli et al. [22] performed potentiodynamic polarization tests in one Co-Cr-Mo (ASTM F75) alloy exposed to artificial saliva AFNOR S90-701 in a temperature range of 7 to 47 °C. The authors reported corrosion current densities within the range of 0.002 mA/cm2 to 0.009 mA/cm2.
It can be mentioned that the pitting potential of the alloy tested is higher for the alloy than for the 316L stainless steel. Also the potential range of the passive region is greater for the Co20Cr alloy, a good condition for a material to be used.
Similarly, Table 2 shows that the highest corrosion rate expressed in terms of mm/yr corresponded to the Co20Cr alloy, while the lowest corrosion rate corresponded to 316 L stainless steel. Table 2 shows that the minor corrosion rate corresponded to the 316L stainless steel with a CR=0.00091 mm/yr, while the highest corrosion rate was observed in the Co20Cr alloy with CR = 0.0089 mm/yr.
Figure 2. Polarization curves for the binary Co20Cr alloy and 316 Stainless Steel in the artificial saliva solution.
Table 2. Electrochemical parameters obtained from the polarization curves of binary Co-20Cr alloy and 316L Stainless Steel polarized in the artificial saliva solution.
Alloy Ecorr
(mV) Icorr
(mA/cm2)
Epit
(mV) Ipit
(mA/m2)
Epasiv.
(mV)
Ipasiv
(mA/cm2)
Corrosion rate (mm/yr)
Co-20Cr -410.9 0.00106 -- -- -- -- 0.0089
[image:7.596.182.413.399.586.2] [image:7.596.51.544.672.744.2]
3.3 Open circuit potential, (OCP) measurements.
Figure 3 shows the corrosion potential as a function of immersion time for Co-Cr alloy and 316L SS. Both samples present a small transient behavior in the anodic direction during the first and second days of immersion. The Co20Cr alloy exhibits a more or less steady state condition after the third immersion day, suggesting a stable condition of the film formed. Figure 3 also display that the more noble corrosion potential corresponded to 316 L stainless steel during all exposure time. The open circuit potential of Co20Cr and 316 L ss increased during the first days of exposure. This behavior could be related to the formation of a protective oxide film Cr2O3 oxide with a minor content of Fe Oxide on the surface of 316L SS. In a previous study [23], the composition of passive surface film developed on the surface of 316L SS exposed to artificial saliva was studied after open circuit potential (OCP) measurements and the results showed that the main constituent formed was Cr oxide, while the second major constituent of the passive layer was Fe oxide. And also to the development of a passive oxide film composed by Cr2O3 with a very low content of cobalt oxide on surface of Co20Cr alloy. Several previous investigations have reported the composition of Co-Cr based alloys surface oxide layers to be ionic compounds, predominantly Cr2O3 and Cr(OH)3 [24-26]. While Co is the principal component in the alloy, its concentration in the oxide layers was only around 5% [27]. It is worth noticing that the corrosion potential at the end of immersion time fluctuated between -157 and 3.3 mV, which mean that these values are much lower than the pitting potentials of the two specimens, as shown in table 2. This comparison serves us as a valid argument to establish that during the nine days of immersion in artificial saliva, the alloys did not reach the pitting potential that makes them susceptible to pitting corrosion process. In addition, since the corrosion potential remained more or less stable after the third day of exposure, it can be predicted that the open circuit potential will not increase significantly after 9 days of immersion. These considerations are relevant because when the metallic dental implant is initially placed in the appropriate part of the oral cavity, this will remain in direct contact with human saliva for a period of more or less three months. In a similar research, Mareci et al [28] studied the corrosion behavior of a vitallium (63.8Co-28.5Cr-6Mo) alloy when was exposed to artificial saliva. The authors measured the open circuit potential (OCP) values during 24 hours of exposure. They observed that the (OCP) values of the tested alloy increased with immersion time, these observations led to the conclusion that the alloy was passivated.
3.4. Linear polarization resistance (LPR) measurements.
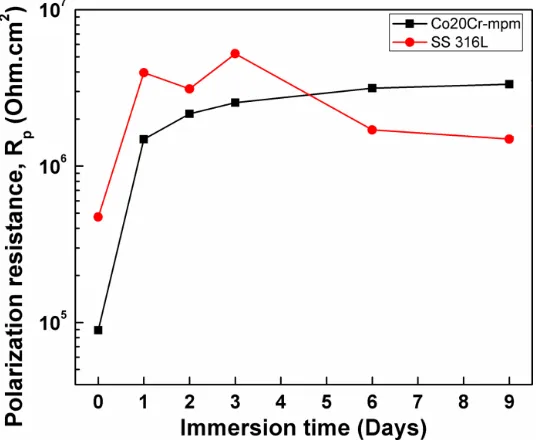
Figure 4 exhibits the linear polarization resistance as a function of time results for the different samples, obtained over a nine days immersion period.
The Rp values measured in this work are close to that reported by Mareci et al [28] whom performed linear polarization measurements in a Vitallium (63.8Co-28.5Cr-6Mo) alloy during 7 days of exposure in artificial saliva. In this research the authors reported that the Rp values remained more or less constant and decreased slightly from 2.27 x 10⁵ Ohm.cm2 at the zero day of exposure to 2.15 x 10⁵ Ohm.cm2 at the 7th day of immersion.
Figure 3. Variation of the potential of corrosion, Ecorr with time for Co20Cr binary alloy and 316L stainless steel in the artificial saliva solution.
[image:9.596.152.446.183.422.2] [image:9.596.165.435.492.712.2]
The initial increase of Rp of the two samples could be related to the formation of a protective passive film composed of oxides or oxychlorides for the case of 316L stainless steel and also to the creation of a passive film composed by a mixture of chromium and cobalt oxides on the surface of Co20Cr specimen see figure 7.
Ramya et al. [29] studied and characterized the surface films formed on type 316LN stainless steels (SS) with different nitrogen contents, during potentiodynamic polarization in acidified 1 M NaCl solution. In this study by means of Laser Raman Spectroscopy (LRS), confirmed the presence of oxides and oxychlorides of iron and chromium, hydrated chlorides and nitrates in the film.
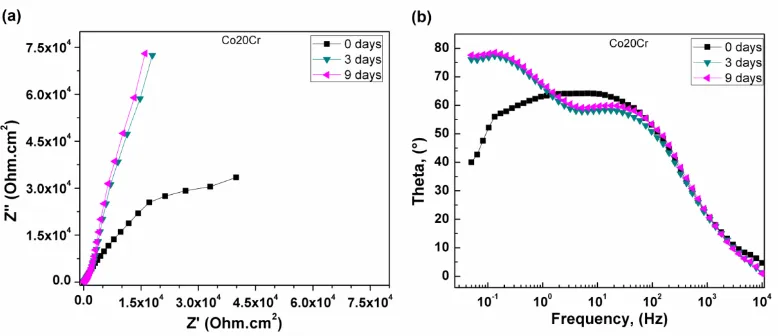
3.5 Electrochemical impedance spectroscopy (EIS) measurements.
EIS data in both Nyquist and Bode formats for Co20Cr alloy at 0, 3 and 9 days of exposure are displayed on Figure 5. In the same way, Nyquist diagram exhibits that the data for the time of immersion describe a depressed, capacitive-like semicircle and a second linear region, one at high frequencies and another at intermediate and lower frequency values, as seen in Figure 5 a). The semicircle observed at high frequencies is related to the double electrochemical layer, whereas the lower frequency semicircle is associated to the formation of a passive layer, probably composed by a mixture of Co and Cr oxides, just as evidenced by the pseudo-passivation zone observed in polarization curve of Co20Cr alloy as shown on Fig. 2). This indicates that the corrosion process was under mixed film formation-charge transfer control. The high frequency semicircle diameter has been associated with the charge transfer resistance, Rct, equivalent to the polarization resistance Rp in the Stern-Geary equation. For three and nine days of immersion, a highly capacitive behavior manifested as a linear display is clearly seen, suggesting a mass transfer control due to the presence of the oxide film formed.
On the other hand, Bode-phase diagram shown on Fig. 5 b exhibits two time constants from medium to low frequencies by phase angles approaching 90° for all the days of exposure, especially so after 3 and 9 days of exposure. This behavior indicates a highly capacitive behavior, which is typical of passive materials, suggesting that a very stable film is formed on Co20Cr surface exposed to the artificial saliva. These findings are consistent with the very low corrosion rates obtained from polarization tests.
Figure 5. (a) Nyquist and (b) Bode phase curves at various exposure times for Co20Cr alloy in the artificial saliva solution at room temperature.
Previous investigations that were focused in the study and analysis of corrosion product film formed on surface of steel containing Cr and Ni when exposed to chloride solution, suggests that oxides, hydroxides, oxy-hydroxides, chlorides and oxy-chlorides of Fe, Cr and Ni could be present in the passive film [30-36].
Figure 6. (a) Nyquist and (b) Bode phase curves at various exposure times for 316 L stainless steel in the artificial saliva solution at room temperature.
[image:11.596.100.489.75.243.2] [image:11.596.103.485.394.556.2]
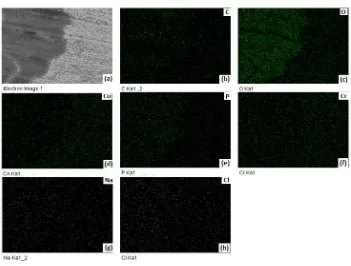
3.6 Microstructural characterization of corroded alloys.
After the potentiodynamic polarization tests, some areas of corroded alloys were analyzed by means of scanning electron microscopy technique (SEM). Corrosion morphology of Co20Cr binary alloy together with the corresponding X-ray mappings of C, O, Co, P, Cr, Na and Cl is shown in Figure 7.
Figures 7 c), d) and f), denote the existence of Co, Cr and O on the corroded alloy surface, figure 7 c) displays that the intensity signal points of O is higher in the left side of the micrograph which corresponds with the zone where is observed the dark film belonging to corrosion products on figure 7 (a). This is related with the existence of chromium and cobalt oxides on corrosion products. This finding is in accordance with a previous investigation [37] where the passive oxide films formed by electrochemical oxidation on CoCrMo alloy (ASTM F75) in simulated physiological solution were studied using XPS. The authors reported that in the lower potential range, E ≤ 0.3 V, the passive film consists predominantly of Cr2O3 and Cr(OH)3 and is up to 3.1 nm thick. At higher potentials both Co and Mo oxides enter the passive layer and Co is present mainly as CoO and Mo as MoO3.
The presence of Cl and Na in figures 7 g) and h) certainly indicates the formation of chloride salts distributed over the whole corroded surface of binary Co20Cr alloy. Also the existence of Cl, Co and Cr in figures 7 h), d) and f) denote the formation of chromium and/or cobalt chlorides or oxychlorides. The distribution of signal points of phosphorous is more intense in the left side of figure 7 e) which lies on the dark film corresponding to corrosion products observed in figure 7 a); this probably is due to the formation of a phosphate compound.
[image:12.596.123.474.443.709.2]
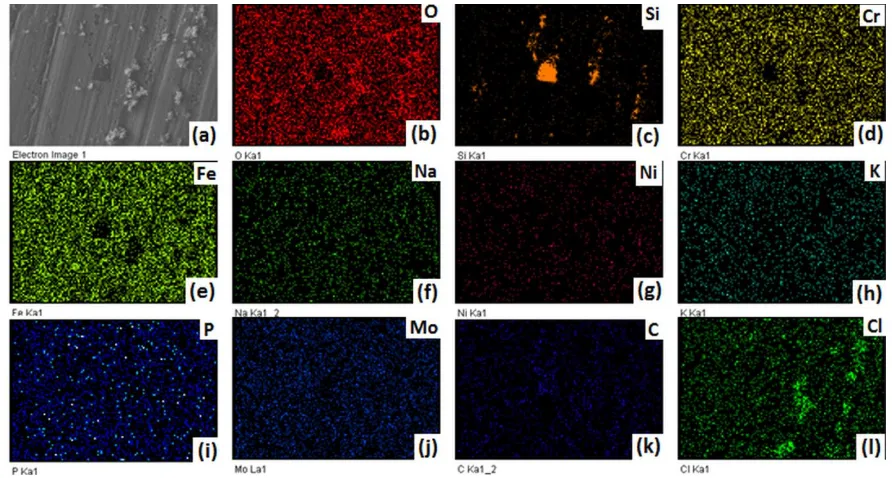
Corrosion morphology of 316L stainless steel together with the corresponding X-ray mappings of O, Si, Cr, Fe, Na, Ni, K, P, Mo, C and Cl is displayed in Figure 8.
[image:13.596.75.521.283.522.2]The scanning electron micrograph presented in figure 8 (a) displays corrosion pits on surface of 316L steel and also under the white granular corrosion products located on its surface. Figures 8 b), d), e) and g) display the presence of O, Cr, Fe and Ni, although the X-ray intensity signal points of nickel is the lowest. These observations are related with the existence of Fe and Cr oxides on the surface of steel probably modified with nickel oxide. These results are in agreement partially with those reported in a previous research [23], where the evolution of the passive films on 316L stainless steel in artificial saliva with and without the addition of F ions was studied using electrochemical techniques and X-ray photoelectron spectroscopy (XPS). The authors revealed that the passive layer predominantly consist of Cr oxide; while all the other constituents were depleted in comparison to the bulk composition.
Figure 8. Photomicrographs of (a) 316L stainless steel corroded in the artificial saliva solution at room temperature together with X-ray mappings of (b) O (c) Si, (d) Cr, (e) Fe, (f) Na, (g) Ni, (h) K, (i) P, (j) Mo, (k) C and (l) Cl.
The inside of corrosion pits that are displayed in the electron micrograph of figure 8 (a) containing silicon but also in these zones the Fe, Cr and Ni are depleted (according to the chemical mappings displayed in figures 8 (c), (d), (e) and (g)). This behavior could be explained in terms of the standard reduction potentials of Ni, Fe, Cr and Si which are presented in equations 3 to 6 as follows:
(3)
(4)
(5)
According to equations 3 to 6, the standard reduction potential of Si is the most negative; so in this case, galvanic couples were formed among Si with the other Ni, Cr and Fe elements which have more noble reduction potentials. So in this case, the reverse reaction of equation 4 was the most favorable to occur in order to give place to the formation of silicon dioxide, the existence of SiO2 is confirmed by looking at the chemical mappings exhibited in figures 8 b) and c). And also the oxidation of Cr, Fe and Ni took place according to the reverse of reactions 1 to 3 in order to produce a dealloying of these elements in the corrosion pits.
The presence of phosphorus and carbon in figures 8 i) and k) is related with the formation of a phosphate and carbonate compounds. The existence of P and C was also reported in a previous research [38], where the corrosion products produced after electrochemical corrosion of the 304 steel exposed to artificial saliva were analyzed by means of XPS technique.
4. CONCLUSIONS
The corrosion behavior of a Co20Cr binary alloy as candidate material to be used as dental implant in the human oral cavity environment has been evaluated. Potentiodynamic polarization curves showed that the Co20Cr alloy exhibited the greatest corrosion rate as compared with the 316L stainless steel.
The measurement of corrosion potential as a function of immersion time for Co-Cr alloy and 316L SS denoted that at the end of exposure time, the corrosion potential are much lower than the pitting potentials of both specimens. This finding serves us as a valid argument to predict that the corrosion potential will not reach the pitting potential during the time that the dental implant initially will remain in the oral cavity, avoiding in this way the pitting corrosion process.
The results derived from linear polarization curves as a function of exposure time, denoted the higher stability of the corrosion product film formed on surface of Co20Cr alloy as compared with that of 316 L stainless steel, which is related to a minor corrosion rate as a function of time of the CoCr alloy during the sixth and ninth days of immersion.
In summary, Co20Cr alloy shows great promise for use in biological applications with their superior corrosion resistance, which may provide a longer and more stable product life cycle for implantable dental materials.
ACKNOWLEDGEMENT
The authors express their gratitude to CONACyT for the financial support granted for the development of this research.
References
1. D. Upadhyaya, M. A. Panchal, R.S. Dubey, V.K. Srivastava, Materials Science and Engineering, A 432 (2006) 1.
2. J.A.V. Fraunhofer, Corrosion Vol. 1, 3rd Ed., L.L. Shreir, R.A. Jarmon, and G.T. Burstein, Eds., Butterworth Heinmann, 1994.
4. K.J. Anusavice, Phillip’s Science of Dental Materials, WB Saunders, Philadelphia (1996). 5. W.J. O’ Brien, Dental Materials and Their Selection, Quintessence, Chicago (1997).
6. J. L. Ferracane, Materials in Dentistry - Principles and Applications, Lippincott Williams & Wilkins, Pennsylvania (2001).
7. E.N. Codaro, P. Melnikov, I. Ramires and A.C. Guastaldi, Russian J. Electrochem., 36 (2000) 1117.
8. R.A. Silva, M.A. Barbosa, R. Vilar, O. Conde, M.D. Belo and I. Sutherland, J. Mater. Sci.: Mater. in Med., 5 (1994) 353.
9. F. Ozcelik, J. Gulen, A. Akdogan and S. Piskin, Prakt. Metallogr., 36 (1999) 385.
10. L.C. Lucas, R.A. Buchanan, J.E. Lemons and C.D. Griffin, J. Biomed. Mater. Res., 16 (1982) 799. 11. M.A. Ameer, E. Khamis and M. Al-Motlaq, Corr. Sci., 46 11 (2004) 2825.
12. D. Mareci, D. Sutiman, A. Cailean and G. Bolat, Bull. Mater. Sci., 33 4 (2010) 491. 13. J. Qiu, W. Yu and F. Zhang, J Mater. Sci., 46 (2011) 1359.
14. A.W.E. Hodgson, S. Kurz, S. Virtanen, V. Fervel, C.O.A. Olsson and S. Mischler, Electrochim. Acta, 49 (2004) 2167.
15. M. Venkatraman and J. P. Neumann, Bull. Alloy Phase Diagrams, 7 (1986) 457. 16. K. Ishida, T. Nishizawa, Journal of Phase Equilibria, 11 4 (1990) 357.
17. N. Yukawa, M. Hida, T. Imura, M. Kawamura and Y. Mizuno, Metal. Trans., 3 (1972) 887. 18. K. Yamanaka, M. Mori, A. Chiba, Materials Science and Engineering: A 592 13 (2014) 173. 19. F. Mansfeld and E. Greener, J. Oral Rehab., 12 (1985) 469.
20. M. Metikoš-Huković, R. Babić, D. Omanović and I. Milošev, ECS Transactions, 2 (9) (2007) 43. 21. T. Matkovic, P. Matkovic and J. Malina, J. of Alloys and Comps., 366 (2004) 293.
22. F.C. Giacomelli, C. Giacomelli, A. Spinelli., J. Braz. Chem. Soc., 15 4 (2004) 541. 23. A. Kocijan, D. Merl and M. Jenko, Corrosion Science, 53 (2011) 776.
24. T. Hanawa, S. Hiromoto and K. Asami, Applied Surface Sci., 183 1-2 (2001) 68.
25. A. Hodgson, S. Kurz, S. Virtanen, V. Fervel, C. O. Olson and S. Mischler, Electrochim Acta, 49 13 (2004) 2167.
26. A. Kocijan, I Milosev and B. Philar, J. Mater Sci.: Mater. Med., 15 6 (2004) 643. 27. J. Qiu, W. Yu and F. Zhang, J. Mater Sci., 46 5 (2011) 1359.
28. D. Mareci, Gh. Nemtoi, N. Alenei and C. Bocanu, European Cells and Materials, 10 (2005) 1. 29. S. Ramya, T. Anita, H. Shaikh, and R. K. Dayal, Corrosion Science, 52 6 (2010) 2114.
30. D. S. Dunn, M. B. Bogart, C. S. Brossia and G. A. Cragnolino, 56 5 (2000) 470.
31. D. L. A. De Faria, S. V. Silva and M. T. De Oliveira, Journal of Raman spectroscopy, 28(11) (1997) 873.
32. K. N. Jallad and D. Ben-Amotz, Materials Science and Technology, 17 11 (2001) 1479.
33. F. Dubois, C. Mendibide, T. Pagnier, F. Perrard and C. Duret, Corrosion Science, 50 12 (2008) 3401.
34. T. Kamimura and M. Stratmann, Corrosion Science, 43(3) (2001) 429. 35. D. C. Cook, Corrosion Science, 47 10 (2005) 2550.
36. M. Yamashita, H. Miyuki, Y. Matsuda, H. Nagano and T. Misawa, Corrosion Science, 36 2 (1994) 283.
37. I. Milošev and H. Strehblow, Electrochimica Acta, 48 I19 (2003) 2767.
38. F. L. Nie, S. G. Wang, Y. B. Wang, S. C. Wei and Y. F. Zheng, Dental Materials, 27 I7 (2011) 677.