1
Market sentiment, volatility, timing and the information content of
directors’ trades
Dimitris Andriosopoulos1,* and Hafiz Hoque2 Abstract
We examine the impact of aggregate director dealings in the UK. We find that, in aggregate, directors are contrarians, but their trades are not informative, contrary to previous US evidence. We suggest that this discrepancy is related to the regulatory setting in the UK where directors have to report their trades within six days. Aggregate directors’ trading is affected by the market sentiment as they are net purchasers in the bear market and net sellers in the bull market. Since directors’ reporting is faster in the UK, we then analyze the short-run market reaction to director trades. We find that the information content of director dealings is limited to the period surrounding the announcement dates. We show that market-to-book, company size, stock volatility and market volatility have a significant impact on disclosure period returns. In addition, we find that the market reaction is significantly weaker after controlling for market-to-book and size. Finally, we show that directors time their trades in volatile stocks and following high market volatility.
Keywords: Directors’ trading, bull-bear market, market-to-book, size, volatility, contrarian strategy, managerial timing.
JEL classification: G14, G39.
1, * Corresponding author: Department of Accounting and Finance, University of Strathclyde,
100 Cathedral Street, G4 0LN, Glasgow, United Kingdom, e-mail:
[email protected], tel.: +44 (0) 141 548 3892.
2University of York, Freboys Lane, YO10 5GD, York, United Kingdom, e-mail:
We thank Giovanni Cespa, Meziane Lasfer, Mario Levis, Jay Ritter, Ian Tonks and the participants of the 2015 FEBS conference, and the 2008 Advanced Corporate Finance Workshop for their valuable comments. Any remaining errors are our own responsibility.
2
1
Introduction
Insiders are contrarian traders as they buy shares following a price decline and sell after a price run up, though the extent to which such trades convey information is mixed. For example, Lakonishok and Lee (2001) find that insider trades are not informative in the short run. In contrast, Fidrmuc et al. (2006) show that insider trades convey information to the market as share prices increase (decrease), subsequently to their buy (sell) trades. Seyhun (1992) documents that the aggregate net number of open market purchase and sell trades by corporate insiders in their own firms predict up to 60% of the variation in the one-year ahead aggregate stock returns. Knewtson et al. (2010) show that demand by aggregate insiders predicts time series variation in the value premiums. Lakonishok and Lee (2001) show that insiders in aggregate are contrarian traders but they have better predictive ability than simple contrarian strategies. Marin and Oliver (2008) investigate insider trading activity prior to crashes and find that insider purchases remain low all year long, but increase only one month prior to the share price jump. On the other hand, Fahlenbrach and Stultz (2011) find that bank CEOs do not reduce their shareholdings in anticipation of the crisis or during the crisis, leading to wealth losses in the wake of the crisis.
3 In the UK, insiders are prevented from trading before the release of any price-sensitive information. For example, insiders are prevented from trading two months before preliminary, interim, or final earnings announcements (Hillier and Marshall, 2002). Outside the ban period, insiders need permission from the chairman of the board before trading. Fidrmuc et al. (2006) argue that US regulations favor more frequent news disclosure to avoid misuse of any significant information, whereas UK law directly prohibits insiders from trading before any price-sensitive news announcement. Moreover, in the UK, directors must disclose to their firm any transaction carried out personally no later than the fifth business day following their trade. Then, the firm must inform the London Stock Exchange and the information is publicly disclosed via the Regulatory News Service (RNS). In the US, prior to the Sarbanes-Oxley (2002) Act, directors had to report their trades on the 10th of each month following the transaction, resulting in a maximum delay of 10 to 42 calendar days, depending on the trading date. Therefore, these differences in insider trading regulations and in reporting periods between the UK and the US1 can provide additional insights.
When information is symmetric, directors’ trades should have no price impact in the market, whereas, under high information asymmetries, insiders’ trades will have higher information content and will cause a larger price impact (Kyle, 1985; Milgrom and Stokey, 1982). Since higher market volatility leads to higher information asymmetry, volatility should have a significant impact on the market reaction to directors’ trades. For instance, Marin and Oliver (2008) find that directors’ trading is affected by market crash and jumps in terms of standard deviations. Therefore, we extend the existing literature by assessing whether directors are better at timing their trades in the short run following periods of higher volatility in the market and in more volatile stocks.
1 For a detailed discussion on the differences in regulations and reporting periods, please see Fidrmuc et al. (2006)
4 It is documented that insiders sell shares following significant stock price increases and buy shares following price declines (Seyhun, 1988, 1992; Lakonishok and Lee, 2001). Similarly, Jiang and Zaman (2010) assert that a contrarian strategy implies insider trading as a reaction to market returns. We use varying market conditions (bull and bear markets) to test the contrarian behavior of directors. If managers use the market platform to act like contrarians, their purchases are expected to dominate in bear periods, and their sell trades during bull periods. We define as bull markets the periods January 1999 through March 2000 and January 2004 through December 2007 and as bear markets the period April 2000 through December 2003. Furthermore, we test whether there is an asymmetric price response of buy and sell trades in bull and bear periods.
The existing evidence shows that insiders try to take advantage of perceived mispricing, suggesting market timing (Jenter, 2005; Lakonishok and Lee, 2001; and Rozeff and Zaman, 1998). However, insider trading is not random in value and glamour stocks (Rozeff and Zaman, 1998; Lakonishok and Lee, 2001; Gregory et al., 2013)2. However, this evidence is based on long run returns only. Therefore, we test whether the directors’ view differs systematically from market valuations and whether they can take advantage of a potential misvaluation in the
short run where their trades in the UK are reported more timely as opposed to US disclosure regulations.
The contribution of this study is threefold. First, we examine the information content of aggregate director trading in the UK. Second, we assess whether managers use market sentiment as a platform to act like contrarians. Third, we employ daily data on insiders’ trades made available due to the UK’s disclosure regulations to investigate insiders’ timing ability
2 Though Gregory et al. (2013) analyze value/glamour strategies, their focus is on long run returns. In this paper
5 and informativeness, in the short run, while controlling for size, glamour or value status and volatility.
We find that net purchase ratio (NPR) is positive (negative) in a bear (bull) market, even after controlling for insiders’ contrarian behavior. Our findings suggest that insiders purchase (sell) in the bear (bull) market. Overall, the aggregate director dealings show that managers use bull/bear markets as a platform to act like contrarians. The event study results on individual directors’ trades show that the price response to these trades is not asymmetric in bull and bear markets and the short-term abnormal returns are economically and statistically significant. In addition, the perceived mispricing, as measured by market-to-book (M/B) ratio, significantly affects the market reaction to directors’ trades in the short run. Finally, our findings are consistent with the view that directors’ trading behavior is driven by the perceived mispricing of smaller and volatile stocks.
This paper proceeds as follows. Section 2 discusses the existing literature and sets the hypotheses. Section 3 describes the data. In section 4, the relationship between market return and aggregate director dealings is analyzed. Section 5 presents and discusses the empirical results. Section 6 concludes.
2
Related Literature and Hypotheses
6
H1: On an aggregate basis, directors buy (sell) shares after a significant decrease (increase)
in price, with a price reversal following their trade.
If the contrarian strategy is employed by insiders at the firm-specific level then there should be no relation between market returns and insider trading. On the other hand, if informed trading is a market wide phenomenon then a relation between aggregate insider trading and market return should exist (Jiang and Zaman, 2010). In this case, market returns would predict insider trading behavior. Chowdhury et al. (1993) and Lakonishok and Lee (2001) provide evidence that aggregate insider trading is driven by contrarian strategies. We test whether the director dealings pattern is different across the bull and bear markets, i.e. whether insider buying is higher in a bear market and insider selling is higher in a bull market. If insiders use a market platform to act like contrarians, we expect them to buy in bear periods, and sell in bull periods, to reflect their expectations of price reversals. Therefore, we split our sample period into bull (01/1999 through 03/2000 and 01/2004 through 12/2007) and bear (04/2000 through 12/2003) periods to assess the trading patterns of directors3.
H2: Market sentiment (bull and bear periods) has no impact on insiders’ buying or selling of
shares.
A related question arises whether the market reaction to director dealings differs during bull and bear markets. Chiyachantana et al. (2004) consider this question in the context of institutional trading. They find that varying market reactions to buy and sell trades depend on bull (bear) market conditions. They argue that following a sell order in bullish markets the suppliers of liquidity will not push down prices as it is easy to find a buyer. In contrast, in bearish markets institutions have to offer discounts to find buyers for their sell orders, which results in buys (sells) having a bigger and permanent price impact in bullish (bearish) markets.
3 Though these bull and bear markets are very well known in financial markets, to avoid any subjectivity, we
7 On the other hand, Friederich et al. (2002) assert that an additional reason for contrarian trades to be informative, is that in bearish markets there is a high demand for good stocks which depresses the price of smaller stocks. Corporate insiders may see this as the time to buy stocks at bargain prices if they have ‘inside’ information about the stocks. To our knowledge, no study considers this impact in the case of director dealings. Therefore, we set up the following hypothesis:
H3: Market sentiment (bull and bear periods) have no impact on the market reaction to
insiders’ buying or selling shares.
Rozeff and Zaman (1998) show that insider transactions are not random across growth and value stocks. Insider buying increases as stocks change from growth to value categories. Insiders buy heavily in value stocks and sell glamour stocks (Jenter, 2005; Lakonishok and Lee, 2001). Gregory et al. (2013) report that when directors buy (sell) value (glamour) stocks earn positive (negative) returns which persist for up to two years after the directors’ trades. They also report that abnormal returns are particularly concentrated in smaller value stocks. All of the aforementioned studies examine the value-glamour strategy in the long run. Recognizing the fact that value-glamour strategies are more relevant in the long run, it would be useful to examine the market reaction to director dealings in the short run in the UK where trades are reported to be relatively quicker.
H4a: When insiders purchase shares, the short-term market reaction is higher (lower) for value
(glamour) stocks.
H4b: When insiders sell shares, the short-term market reaction is higher (less negative) for
value stocks.
8 information when making private and corporate decisions. The author argues that the results are consistent with Lakonishok and Lee (2001) who document that director dealings do not predict subsequent returns, once size and B/M effects are controlled for. There is some predictability of excess returns in the case of equity purchases in small firms, but no predictability of excess returns is found for the sell trades. On the other hand, recent research using UK data shows that insider buy and sell trades trigger an immediate market reaction of 1.16% and -0.26% respectively (Fidrmuc et al., 2006). We test whether insider trades in the UK convey information after controlling for M/B and size effects.
H5: After controlling for size and M/B the short-term excess returns of director trades are not
different from zero.
Insiders possess superior information about the firm and information asymmetry is the focal point to insider trading (Aboody and Lev, 2000). In a market with a higher level of information asymmetry, insider trades will have a higher price impact (see, for instance, Kyle, 1985; Milgrom and Stokey, 1982). Hence, asymmetric information should be positively related to the variance of returns. Marin and Oliver (2008) define market crash and jumps in terms of standard deviations, and find a relationship with director dealings. We hypothesize that volatility is positively related to the market reaction to insider trades.
H6a. Directors’ purchases (sells) trigger a higher (lower) market reaction for high volatility
stocks.
H6b. Directors’ purchases (sells) trigger a higher (lower) market reaction following high
market volatility.
3
Data
9 disclosed by all UK firms to the Regulatory News Service (RNS). We exclude a number of observations that are not likely to be driven by private information, such as exercise of options or derivatives, script dividends, bonus shares, rights issues, and awards made to directors under incentive plans or reinvestment plans. Also all directors’ transactions in investment companies are excluded. After this screening, we obtain 36,943 directors’ trades from the UK market. We check the data for errors and exclude 2,952 (8%) trades as the difference in announcement and transaction date is more than five trading days. The final sample includes 33,991 directors’ trades in 2,664 listed companies, split into 26,268 (77%) purchases and 7,723 (23%) sell trades. This insider-trading database includes transaction price, amount, and value, post-transaction holding, change in holding, name and position of the director, and announcement and transaction dates, as UK insiders can delay up to five days the announcement of their trade, but most report their trades on the RNS on the transaction date (Korczak et al., 2010).
The sample period covers two sub-periods: the bull periods (January 1999 - March 2000 and January 2004 - December 2007) and the bear period (April 2000 - December 2003), which allows us to test whether insiders time their trades differently under different market conditions. Adjusted daily share prices, data on the FTSE All Share Price Index, and firm-specific data are retrieved from Thomson Reuters.
4
Market Return and Aggregate Insider Trading
4.1
Impact of pre-event returns on aggregate director dealings
10 Since, in the bull market prices are up, higher insider sells are expected. In contrast, in bear market prices are down, hence higher insider purchases are expected.
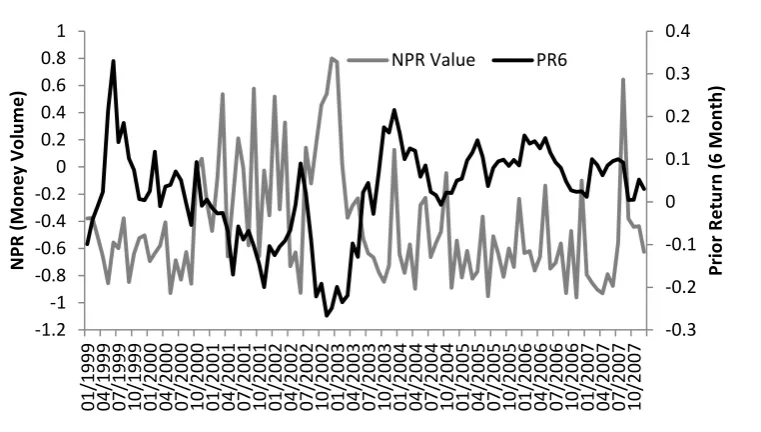
Following Lakonishok and Lee (2001), this paper uses NPR which is the ratio of net purchases to total insider transactions, for measuring the aggregate director dealings activities. Each month starting from January 1999 to December 2007, the total numbers of insider purchases and sells and respective Pound Sterling volumes are calculated. We then calculate the NPR by dividing the net aggregate number (volume) of insider purchases by the total aggregate number (volume) of insider transactions. Return on FTSE All Share Price Index is used as a proxy for market return. Figure 1 shows that there is a negative relationship between NPR and market returns, which supports the contrarian behavior.
[Insert Figure 1 here]
The following regression model is estimated to examine the relationship between aggregate director dealings and the market return:
NPRt= 𝛼 + 𝛽𝑃𝑅(k)t + 𝛾𝐵𝐵 + 𝜀𝑡(1)
Where, NPR is the aggregate director dealings activity in month t. BB is a binary variable equal to one for two periods: January 1999 - March 2000 and January 2004 - December 2007. The bear market is from April 2000 - December 2003. 𝑃𝑅(k)tis the prior k-holding period return on market at time t. A negative relationship is expected between NPR and prior return (PR) as contrarian strategy implies a buy (sell) after a price decline (rise). Since NPR is positive (negative) if insiders are net buyer (seller), then we expect PR should be negatively related to NPR. We use 6-, 12-, 24- month returns prior to the event to examine whether the insiders buy (sell) as a reaction to market returns.
11 is more negative when the market is in bullish state compared to bearish state. The medians are very closer to means. NPR (amount) shows that in a bull market it is negative while in a bear market it is positive, suggesting that insiders are net sellers in bull markets and net buyers in bear markets. Figure 2 shows that in a bear market most of the NPRs are positive, suggesting that insiders are net buyers. In a bull market (shaded area) most of the NPRs are negative, meaning insiders are net sellers.
[Insert Table 1 and Figure 2 here]
Panels B and C of Table 1, report the regression results with and without accounting for market sentiment, based on NPR number of transactions and NPR money volume, respectively. Without accounting for sentiment, the results consistently show that PR over the k-period is statistically and economically significant. The negative sign of PR implies that insiders are contrarians and suggests that insiders sell after a price rise, and buy after a price decline, which supports our hypothesis (H1); our findings are consistent with Lakonishok and Lee (2001) and Jiang and Zaman (2010) who show that insiders are contrarians.
Although all the coefficients of PR are negative, the coefficient of PR becomes smaller as the holding period become longer. For example, the coefficient is -2.02 when a 6-month PR is used, compared to -0.55 when 24-month PR is used. This provides evidence that insiders rely more on recent price performance. The adjusted R2 also declines from 23.7% to 8%. Similar results are obtained using the NPR measure based on money volume. The predictive power of money volume-based NPR is higher than the number of transaction-based NPR. This may imply that when market moves are larger, insiders make large trades.
12 in the bull market. Both the NPR measures are negatively related to the BB dummy, suggesting that insiders buy in the bear market with an expectation to sell in the bull market. Hence, insiders use the bull (bear) markets as a platform to act like contrarians. For instance, the BB dummy is -0.17 and statistically significant (t=-1.89).The evidence holds even after controlling for the contrarian behavior of the insiders by incorporating PRs; PR is -1.57 and statistically significant (t=-3.12). After controlling for contrarian strategies, we show that insiders further use the bull (bear) market to time the market, which supports hypothesis 2.
4.2
Predictability of post-trade returns
The previous section reports that insiders are contrarians. Here, we test whether the aggregate director dealings predict future market returns. If insider trades are informative, a positive relationship between aggregate director dealings measure (NPR) and future market return is expected. The following regression is estimated to examine the relationship between aggregate director dealings and return on market:
∏𝑡=𝑘𝑡+𝑇(1 + 𝑅𝑀,𝐾) − ∏𝑡+𝑇𝑡=𝑘(1 + 𝑅f,k) = 𝛼 + 𝛽 𝑁𝑃𝑅t+ 𝛾𝑃𝑅24t+ 𝜀𝑡 (2)
Where, 𝑅M,K is the market return in month k, 𝑅𝑓,𝑘 is the monthly treasury bill rate in month k, NPRt is the NPR of aggregate director dealings activity in month t, 𝑃𝑅24t is the prior
two-year holding period market return at time t4. We include the prior two-year holding period
return in the regressions to control for the fact that insiders are contrarians, following Lakonishok and Lee (2001). We also control for the momentum factor documented in previous studies, as stocks that perform the best (worst) over a 3- to 12-month period tend to continue to perform well (poorly) over the subsequent 3 to 12 months (Jegadeesh and Titman, 2001). We control for the fact that the current market return is affected by the previous market returns, hence isolating insiders’ information from the simple contrarian strategy/momentum effect.
13 [Insert Table 2 here]
Table 2 reports the regression results for 3, 6, 9 and 12-month holding periods. The coefficient NPR is negative and significant in most of the regressions. For example, Panel A, Table 2 shows that the coefficient of NPR is -0.05 (t=3.28) for the 3-month holding period, which shows that director dealings predict stock prices contrary to expectations. For the alternative holding periods, the results are qualitatively similar. For money volume, similar results are obtained for holding periods 3 and 9, while for holding periods 6 and 12 the coefficient is not significant. Overall, the results show that director dealings predict market return in the opposite direction to expectations. The negative coefficient of NPR is contrary to the findings of earlier studies undertaken on the US market (e.g., Lakonishok and Lee, 2001) suggesting that the aggregate director dealings do not convey enough information to forecast future prices. Since the insider trades in the UK market are reported within 6 days, the information is short-lived.5 It might be possible that director dealings in the UK do not convey enough information to predict the aggregate market returns. Since insiders are net sellers (as NPR is negative for most of the time period) and individual sell trades do not convey information (as the returns are statistically and economically insignificant), the results of aggregate director dealings are partially consistent with that.
5
Event Period Returns
5.1 Descriptive Statistics and Information Content of Insider trades
Table 3, Panel A presents the descriptive statistics and t-tests for differences in means for company fundamentals. We measure size as the market value of equity five days before directors’ trades, M/B as the market value to book value of equity five days before directors’ trades, Stock volatility as standard deviation of stock measured from -240 to -41 days window
14 relative to the trade, and market volatility as the standard deviation of market index over the same window. The results show strong differences between buy and sell trades. The average company sizes for buy and sell trades are statistically different. This is an early indication that the stocks insiders buy and sell are different, which is consistent with previous literature (e.g. Lakonishok and Lee, 2001). The average M/B is also different for buy and sell trades. Furthermore, the mean difference t-test shows that they are statistically different.
Table 3, Panel B, reports the results on the market reaction to insiders’ trades.6 For the
whole sample the cumulative abnormal returns (CARs) for buy trades over the pre-event periods [-40, -2] are negative and highly significant. In contrast, before the sell trades, the abnormal returns are positive and significant. The results clearly indicate the contrarian strategies adopted by insiders and the impact of the trades on the announcement dates, as well as the post-trade performance.
The event day and post-event day returns for buy trades are positive and significant. In contrast, for the sell trades, the event day returns are negative, but not significant. Interestingly, the post-event day abnormal returns are neither negative nor significant for sell trades. After the buy trades, share prices recover to a certain extent. However, after the sell trades, share prices do not decline, rather the trend stops and share prices level off. These results support the earlier findings that the buy trades convey information, but the sell trades are not informative (Lakonishok and Lee, 2001). The t-test of differences in mean shows that the buy and sell trades are different.
[Insert Table 3 here]
6 This study uses the standard event study methodology based on the market model (Brown and Warner, 1985),
15 Lakonishok and Lee (2001) note that the abnormal returns around the reporting dates are not economically meaningful, though statistically significant. For example, they report abnormal returns of 0.13% and -0.23% for purchases and sells, respectively around reporting day. However, their findings are contrary to our results where we find abnormal returns of 1.02% and -0.13% for buy and sell trades respectively. Pope et al. (1990) and Gregory et al. (1994) find puzzling results as market model CARs are negative for buys, and the returns are substantial. The results change dramatically when they adjust for size as the CARs become positive for buys and negative for sells in the post-event window. We find that the abnormal returns for the buy trades are statistically and economically significant when measured around the announcement date, which is consistent with Fidrmuc et al. (2006), and Pope et al.’s (1990) and Gregory et al.’s (1994) size adjusted returns.
5.2
Market Sentiment and Price Impact of Insider Trades: Univariate Analysis
This paper examines the price impact asymmetry and hence tests for market timing by splitting the sample period into bull (01/1999 - 03/2000 and 01/2004 - 12/2007) and bear (04/2000 - 12/2003) periods. We find that the behavior of share prices following buy and sell trades does not depend on market conditions (Table 3, Panel B). The mean difference t-tests show that the behavior of CARs over different event windows is not significantly different. The only exception to this is that buy trades over the estimation window [-40, -2] in bull and bear markets show significant differences. Our results are in line with Korczak and Lasfer (2009), who find that the behavior of share prices following buy and sell trades does not depend on market conditions. These findings are in contrast to Chiyachantana et al. (2004) who assert that in a bull market, suppliers of liquidity are suspicious of buy orders, and run up the prices in the face of a strong buying interest.
16 they face selling interests. In bearish markets the situation is exactly the opposite. In a bullish market, buys have a bigger price impact, but in bearish markets sells have a bigger price impact. However, we find evidence which is almost contrary to this argument. The absolute magnitude of CARs for buy trades in bear periods is higher than the bull period trades [-5.53 vs. -3.14, 1.12 vs. 0.92, 2.23 vs. 2.03 over the event window (-40, -2), (-1, +1), (+2, +40) respectively]. The only evidence which is consistent with Chiyachantana et al. (2004) is the absolute magnitude of the sell trades’ CAR in the bear period, which is higher than sell trades [-0.26 vs. -0.001 over the event window (-1, +1)]. However, for both buy and sell trades, we do not find any significant difference in price response in bull and bear periods. Thus we accept hypothesis 3.
5.3
Market-to-book Quintiles: Univariate Analysis
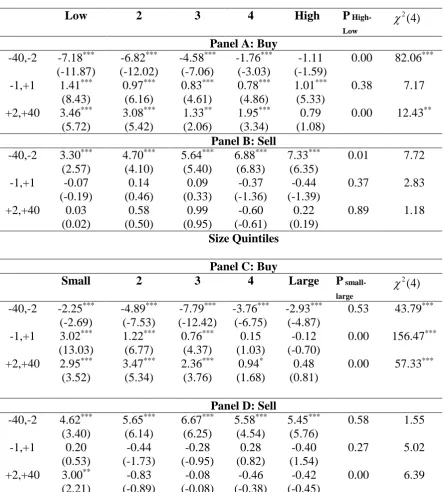
17 The analysis of M/B quintiles shows evidence of signaling over- (under-) valuation (Table 4, Panels A and B). Low M/B companies (value stocks) are companies that are perceived to be undervalued. We expect insiders in these companies to signal undervaluation when they purchase shares, resulting in positive post-event abnormal returns. As expected, for buy trades, as we move from low M/B to high M/B stocks, the post-event abnormal returns are becoming smaller. For example, the CAR for quintile 1 is 3.46 (t=5.72) and for quintile 5 is 0.79 (t=1.08) in the post-event window. The mean difference t-test indicates that quintile 1 is statistically different from quintile 5. Also, the chi-square test for differences among the means rejects equality of means. The results of the pre-event returns are also according to our expectations. As we move from low M/B to high M/B stocks, the pre-event abnormal returns are larger. The means of ‘value’ (low M/B) and ‘glamour’ (high M/B) stocks are different. Moreover, the chi-square test shows differences among the means. When insiders buy in low M/B companies, the immediate price reaction of trades and price recovery is much higher, compared to high M/B companies (hypothesis 4). This is consistent with value strategies.
18 Overall, insiders sell after a significant rise in prices and the trend stops following their sell trades. Hence, there is weak evidence of timing. Our results suggest that insiders are able to time their trades, but they are not fully capable of changing the market’s perception regarding their firm’s true value. In sum, the results provide partial support for the proposition that insiders follow growth strategies when they sell their shares.
[Insert Table 4 here]
5.4
Size Quintiles: Univariate Analysis
Table 4, Panels C and D show the univariate results on size quintiles. The results show that there is evidence of market timing by the insiders for small stocks. If managers have timing abilities in small companies, we expect pre-event CARs to be higher as we move from small to large companies. Also, event and post-event abnormal returns will be lower as we move from small to large companies. In the case of buy trades, even though the signs are as predicted, the pre-event returns do not increase as expected when moving through the quintiles. For instance, for smallest size quintile CAR is -2.25 (t=-2.69) compared to -2.93 (t=-4.87) for large size quintile stocks. The mean difference t-test between small and large companies is statistically insignificant, but the chi-square test for the differences in means for different quintiles is highly significant.
19 for both event day and post-event returns. Overall, the results support the proposition that insiders buy shares after a significant price decline; that after purchases the share price recovers; and that this behavior is more pronounced for small firms.
The results for the sell trades do not provide strong evidence of market timing in the case of small companies (Table 4, Panel D). The pre-event window CARs show mixed evidence of managers’ systematic trading based on their perceptions about the company. For example, the CARs increase as we move from quintile 1 to quintile 3 and then decline again. Additionally, there are no significant differences in means between small and large stocks, and the differences across the quintiles are not statistically significant. The event day and post-event day returns are not fully consistent with our predictions. None of the CARs across the size quintiles are statistically significant, except the post-event return for quintile 1. The mean difference t-test is not significant for event day returns and the chi-square test shows that there are no significant differences among the means. Overall, insiders sell after a significant rise in prices and the trend stops after they sell. This shows weak evidence of timing. Therefore, the results indicate that insiders are able to time their buy trades but not their sell trades in the case of small companies. This is consistent with Lakonishok and Lee (2001) in the US and Gregory et al. (1994) in the UK, who find that insiders’ timing ability is more pronounced in small firms.
5.5
M/B and Size Sorting of Abnormal Returns
20 for the large company quintile. In addition, the post-event returns are significant in the small company quintile and all the post-event returns are insignificant in the large company quintile. This implies, after controlling for M/B and size, that insider purchases do not convey any information (hypothesis 5).
[Insert Table 5 here]
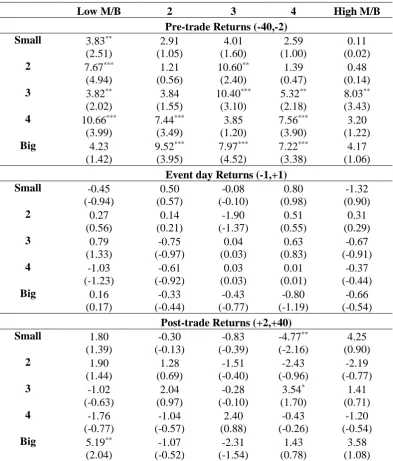
For example, the event day return for the largest company quintile and largest M/B quintile is actually negative (-0.58, t=- 0.98). The post-event return for the largest company and high M/B quintile is also negative (-0.31, t=-0.23). These results are consistent with earlier findings in the US that most of the insider returns are not indistinguishable from zero, once the size and M/B effects are controlled for. However, Lakonishok and Lee (2001) find that the abnormal returns around the reporting dates do not depend on size or M/B. We find that the reporting period abnormal returns are directly related to M/B and size. Our results are consistent with the view that smaller companies are associated with more information asymmetry and hence the market reaction is higher. Smaller companies are also more risky, which may yield higher returns when insiders trade.
[Insert Table 6 here]
21 any information to the market. Our results are consistent with earlier findings of directors’ sell trades being motivated by other considerations, such as portfolio rebalancing and diversification, rather than being information driven (Lakonishok and Lee, 2001).
5.6
Stock and Market Volatility sorting
In this section, we sort the CARs from low to high stock volatility.7 The results (Table 7, Panel A) show that for buy trades, low volatility stocks display lower price drops in the pre-event window and the market reaction is smaller immediately and in the post-event period compared to the high volatility stocks. The mean difference between low and high volatility is highly significant. In addition, we find that the means are different across all the quintiles for the pre-event and pre-event windows. However, for sell trades, the CAR is lower for low volatility stocks during the pre-event window compared to high volatility stocks. (Table 7, Panel B). Furthermore, the means between high and low volatility stocks are significantly different and the chi-square test shows that the means across quintiles are not homogeneous. The results imply that insiders have more knowledge on high volatile stocks (hypothesis 6).
When we sort the stocks based on market volatility, the results are similar (Table 7, Panel C and D). For buy trades, the higher the market volatility prior to the trades, the higher the market reaction. This holds for both the event and the post-event windows. The post-event market reaction for low volatility (0.97%) is significantly lower compared with high volatility (3.46%). Regarding the sell trades, they are preceded by high market volatility and the market reaction in the post-event period is positive and significant (1.89% with t=2.93). The mean difference between low and high is highly significant, and chi-square rejects the null of
7 We document that returns are larger when market and stock volatility are larger, though this could be driven by
22 homogeneity. In sum, we find that high (low) stocks, and market volatility prior to the insiders’ trades are related to high (low) market reaction.
[Insert Table 7 here]
5.7
Cross Sectional Variation in Abnormal Returns
This section runs cross-sectional regressions to control for a number of factors simultaneously. The overall results of univariate analysis show that insiders buy (sell) undervalued (over-valued) stocks as measured by M/B and find evidence of market timing in the purchase of small company stocks. In particular, as we move from low to high quintiles for M/B, size, stock volatility and market volatility for the pre-event, event and post-event, abnormal returns vary. Clearly, these provide evidence that the abnormal returns vary with M/B, size, stock volatility and market volatility.
Therefore, we estimate the following model separately for the buy and sell trades:
1 ( ) 2 / 3 4
j j j j j
CAR Ln Size M B Stock Vol MktVol BBDum
Year Industry
where, Ln (size) isthe log of firm size measured as the market value of equity five days before the trade, M/B is the market-to-book ratio, where the market value of equity is taken five days before the trade and the book value is the book value of equity at the balance sheet date, Stock Vol is the standard deviation of stock returns over -240 to -41 days relative to the directors’ trades, Mkt Vol is the standard deviation of market returns over -240 to -41 days relative to the directors’ trades, and BB Dum is a dummy equal to 1 for the Bull Market and 0 otherwise.
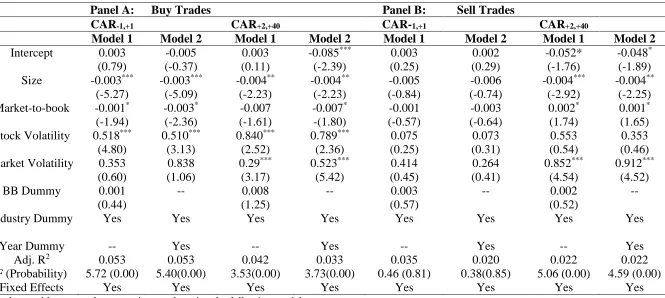
23 influenced by the relative market valuations. We also examine the impact of size on insiders’ market timing ability. The coefficient is negative and significant for the buy trades, which is consistent with the evidence that insiders try to time the market in the case of small companies. For buy trades, both the stock and market volatility are positive and significant in most cases, suggesting that risky stocks earn higher returns, and high market volatility is related to higher returns. This is consistent with Huddart and Ke (2006), who assert that for companies where information asymmetry is higher, the abnormal returns are higher. In sum, the results suggest that insiders time their buy trades.
[Insert Table 8 here]
For sell trades, M/B has a positive but not significant relationship (Table 8). The sign is consistent with our predictions, suggesting that insiders sell over-valued stocks. Furthermore, size has a negative relationship and market volatility has a positive relationship but only for the post-event market reaction CAR (+2, +40). Overall, the results suggest that M/B, size and market volatility significantly affect the market’s reaction to director dealings.
24 are the industry dummies or year dummies significant, suggesting that our results are not driven by industry or time effects.
6
Conclusion
This study employs a unique data set to test whether insiders time their trades or not. This is one of the first studies to examine aggregate in director dealings in the context of UK. We find that on an aggregate basis, insiders are contrarians but aggregate director dealings do not predict monthly returns. This is consistent with the view that the information content of director dealings is limited to the period surrounding the announcement dates. We then examine whether director dealings are related to the market sentiment, as measured by a bull (bear) market. The aggregate director dealings activity shows a relationship between insiders’ market timing and market sentiment, as measured by bull (bear) periods. This provides evidence that insiders use market sentiment to act like contrarians. However, we do not find a significant difference in the price response during bull and bear periods.
26 References
Aboody, D., Lev, B., 2000, Information asymmetry, R&D, and insider gains. Journal of Finance 55, 2747-2766.
Brown, S.J., Warner, J.B., 1985, Using daily stock returns: the case of event studies. Journal of Financial Economics 14, 3-31.
Chiyachantana, C.N., Jain, P.K., Jiang, C.X. and Wood, R.A., 2004, International evidence on institutional trading behavior and price impact, Journal of Finance 59, 869-898. Chowdhury, M., Howe, J.S. and Lin, J-C., 1993, The relation between aggregate Insider
Transactions and Stock Market Returns, The Journal of Financial and Quantitative Analysis 28, 431-437.
Fahlenbrach, R., Stulz, R.M. 2011, Bank CEO incentives and the credit crisis, Journal of Financial Economics 99, 11-26.
Fama, E., French, K.R., 1993, Common Risk Factors in the returns on stocks and bonds,
Journal of Financial Economics 33, 3-56.
Fidrmuc, J., Goergen, M., Renneboog, L., 2006, Directors’ share trading, news release and ownership concentration, Journal of Finance 61, 2931-2973.
Friederich, S., Gregory, A., Matatko, J. Tonks, I., 2002, Short-run returns around the trades of corporate directors on the London Stock Exchange, European Financial Management
8, 7-30.
Gregory, A., Matatko, J., Tonks, I., Purkis, T., 1994, U.K. directors trading - the impact of dealings in smaller firms, Economic Journal 104, 37-53.
27 Hillier, D., Marshall, A., 2002, Are trading bans effective? Exchange regulation and corporate insider transactions around earnings announcements, Journal of Corporate Finance 8, 393-410.
Huddart, S., Ke, B., 2006, Information asymmetry and cross sectional variation in insider trading, working paper, Pennsylvania State University.
Jegadeesh, N., Titman, S., 2001, Profitability of Momentum Strategies: An Evaluation of Alternative Explanations, Journal of Finance 56, 699-720.
Jenter, D., 2005, Market timing and managerial portfolio decisions, Journal of Finance 60, 1903-1949.
Jiang, X., Zaman, M.A., 2010, Aggregate Insider trading: Contrarian Beliefs or Superior Information, Journal of Banking and Finance 34, 1225-1236.
Knewtson, H.S., Sias, R.W., Whidbee, D.A., 2010, Style Timing with Insiders, Financial Analysts Journal 66(4), 1-21.
Korczak, A., Lasfer, M., 2009, Foreign Shareholder Activism and Insider Trading Before Material News Announcements, Cass Business School Working Paper.
Korczak, A., Korczak, P., Lasfer, M., 2010, To trade or not to trade, the strategic trading of insiders around news announcements, Journal of Business Finance and Accounting, 37(3) & (4), 369-407.
Kothari, S.P., Warner, J.B., 1997, Measuring long-horizon security performance, Journal of Financial Economics 43, 301-339..
Kyle, A., 1985, Continuous auctions and insider trading, Econometrica 53, 1315-1335. Lakonishok, J., Lee, I., 2001, Are insider trades informative? The Review of Financial Studies
14, 79-111.
28 Milgrom, P., Stokey, N., 1982, Information, trade and common knowledge, Journal of
Economic Theory 26, 17-27.
Pope, P., Morris, R., Peel, D., 1990, Directors’ share trading: Some evidence on market efficiency and directors' share dealings in Great Britain, Journal of Business Finance & Accounting 17, 359-380.
Rozeff, M.S., Zaman, M.A., 1998, Overreaction and Insider Trading: Evidence from Growth and Value Portfolios, Journal of Finance 53(2), 701-716.
Seyhun, H.N., 1992, Why Does Aggregate Insider Trading Predict Future Stock Returns, The
Quarterly Journal of Economics 107, 1303-1331.
Seyhun, H.N., 1988, The Information Content of Aggregate Insider Trading, Journal of Business 61, 1-24.
29 Table 1. Aggregate Insider Trading and Market Return
Panel A: Mean Differences in NPR between Bull and Bear markets
Mean Median
Bull Bear Bull Bear P (bull-bear)
NPR (amount) -0.25 0.12 -0.28 0.11 0.00
NPR (value) -0.59 -0.23 -0.62 -0.28 0.00
Regression Results Prior Returns (Months)
Constant PR BB 𝐑̅𝟐
Panel B: Number of Transactions
0.12 (1.18) -- -0.37 (-3.27) *** 16.1 6 -0.04 (-1.03) -2.02(-4.44)
*** 23.7
0.04 (0.63) -1.57(-3.12) *** -0.17 (-1.89) * 25.3
12 -0.04 (-0.73) -1.32(-3.36)
*** 18.2
0.03 (0.43) -0.89(-1.80) * -0.16 (-1.17) 18.7 24 -0.04 (-0.92) -0.55(-3.06)
*** 8.0
0.12 (1.18) 0.00 (0.00) -0.37 (-2.45) *** 15.3 Panel C: Money Volume
-0.22 (-2.09) ** -- -0.37(-3.24) *** 18.1 6 -0.39*** (-10.14)
-2.08(-4.71) *** 29.6
-0.32 (-4.54) *** -1.70 (-3.20) *** -0.15 (-1.65) * 31.0 12 -0.39(-7.26)
*** -1.26(-3.48) *** 19.5
-0.30 (-3.84)*** -0.79 (-1.99) * -0.18 (-1.51) 20.6
24 -0.37(-5.72)
*** -0.76(-3.03) *** 18.8
-0.28 (-3.85) -0.46 (-2.04) ** -0.20(-1.90) * 20.9
Panel A of this table represents mean (median) of NPR for each month from January 1999 through December 2007.
Panel B reports the results from the following regression:
𝑁𝑃𝑅𝑡 = 𝛼 + 𝛽𝑃𝑅(𝑘)𝑡+ 𝛾𝐵𝐵
NPRit is the NPR of aggregate director dealings activity in month t. 𝑃𝑅(𝑘)
𝑡 is the prior two-year holding
30 Table 2. Predictive Ability of Post-trade Returns
Holding Period(months) Constant NPR PR24 𝑅̅2 Panel A Number of transactions
3 -0.01(-1.11) -0.05 (-3.28) *** 0.03(0.79) 12.3
6 -0.02(-1.22) -0.07(-2.90) *** 0.04(0.59) 13.9
9 -0.03(-1.31) -0.11(-3.48)*** 0.02(0.22) 15.8
12 -0.05(-1.40) -0.14(-3.33) *** -0.01(-0.12) 14.4
Panel B Money Volume
3 -0.02(-2.49) -0.04(-1.86)* 0.03(0.64) 8.0
6 -0.04(-2.06) ** -0.05(-1.57) 0.05(0.56) 7.6
9 -0.06(-1.87) * -0.07(-1.69) * 0.04(0.30) 5.9
12 -0.07(-1.56) -0.07(-1.25) 0.02(0.14) 2.0 This table reports the regression results from the following model.
∏(1 + 𝑅𝑀,𝐾) − ∏(1 + 𝑅𝑓,𝑘 𝑡+𝑇
𝑡=𝑘 𝑡+𝑇
𝑡=𝑘
) = 𝛼 + 𝛽𝑁𝑃𝑅t+γ𝑃𝑅24t
Where, R𝑀,𝐾 is the return on market in month k, 𝑅𝑓,𝑘 is the monthly Treasury bill rate in month k, 𝑁𝑃𝑅𝑡 is the NPR of aggregate director dealings activity in month t, 𝑃𝑅24𝑡 is the prior two-year holding period return at time t. Each month starting from January 1999 through December 2007, we calculate the total numbers of (and the total Pound Sterling volume) of insider purchases and sells. We then calculate the NPR by dividing the net aggregate number of insider purchases by the total aggregate number of insider transactions. We predict market returns for 3, 6, 9 and 12-month horizons. The Newey-West autocorrelation and heteroskedasticity adjusted t-statistics are in parenthesis. ***,**,*
31 Table 3. Descriptive Statistics and Market Reaction of Insider Trades
Panel A: Fundamentals
Buy trades Sell trades (p Buy-sell)
Mean Median Mean Median
Size (Market Cap) 5,073.86 403.1 6,817.81 403.34 0.02
M/B 2.28 1.46 3.94 2.34 0.00
Stock Volatility 0.023 0.021 0.022 0.019
Market Volatility 0.012 0.011 0.012 0.011
Number of Observations
26,268 7,723
Panel B: Cumulative Abnormal Returns in Different Market Conditions
Full sample Bear Period
Bull Period
P Bear-Bull
Buy trades
N 26,268 10,274 15,994
CAR(-40,-2) -4.32***
(-15.37) -5.53*** (-13.87) -3.14*** (-7.39) 0.00
CAR(-1,+1) 1.02***
(13.11) 1.12*** (10.14) 0.92*** (7.83) 0.41
CAR(+2,+40) 2.13***
(7.59) 2.23*** (5.60) 2.03*** (4.77) 0.71 Sell trades
N 7,723 2,312 5,411
CAR(-40,-2) 5.60***
(10.05) 5.06*** (7.12) 6.11*** (8.17) 0.27
CAR(-1,+1) -0.13
(-0.83) -0.26 (-1.30) -0.001 (-0.01) 0.39
CAR(+2,+40) 0.24
(0.44) 0.76 (1.08) -0.26 (-0.35) 0.20
This table provides the descriptive statistics of the companies in our sample and event study results. Panel A represents company fundamentals. Size is the market value of equity five days before directors’ trades, M/B is the market value to book value of equity five days before directors’ trades, Stock volatility is the standard deviation of stock measured from -240 to -41 days’ window, and market volatility is the standard deviation from the market from the same window. Panel B presents cumulative average abnormal returns around directors’ share trading events computed using event study methodology. The market model coefficients and are estimated over days -240 to -41 relative to the event, with the FTSE All Share Price Index as the proxy for market portfolio. All results are reported relative to directors’ share trading announcement day, i.e., the date of the public announcement of directors’ share trading. The bull period covers from January 1999 through March 2000 and January 2004 through December 2007 and the bear period covers April 2000 through December 2003. T-statistics are reported in parenthesis. ***, **, * denote significance at the 0.01, 0.05 and 0.1% levels,
32 Table 4. Distribution of Cumulative Abnormal Returns by Market-to-Book and Size
Market-to-Book Quintiles
Low 2 3 4 High P
High-Low
2 (4)
Panel A: Buy -40,-2 -7.18***
(-11.87) -6.82*** (-12.02) -4.58*** (-7.06) -1.76*** (-3.03) -1.11 (-1.59)
0.00 82.06*** -1,+1 1.41***
(8.43) 0.97*** (6.16) 0.83*** (4.61) 0.78*** (4.86) 1.01*** (5.33)
0.38 7.17 +2,+40 3.46***
(5.72) 3.08*** (5.42) 1.33** (2.06) 1.95*** (3.34) 0.79 (1.08)
0.00 12.43** Panel B: Sell
-40,-2 3.30*** (2.57) 4.70*** (4.10) 5.64*** (5.40) 6.88*** (6.83) 7.33*** (6.35)
0.01 7.72
-1,+1 -0.07 (-0.19) 0.14 (0.46) 0.09 (0.33) -0.37 (-1.36) -0.44 (-1.39)
0.37 2.83
+2,+40 0.03 (0.02) 0.58 (0.50) 0.99 (0.95) -0.60 (-0.61) 0.22 (0.19)
0.89 1.18
Size Quintiles Panel C: Buy
Small 2 3 4 Large P
small-large
2 (4)
-40,-2 -2.25*** (-2.69) -4.89*** (-7.53) -7.79*** (-12.42) -3.76*** (-6.75) -2.93*** (-4.87)
0.53 43.79*** -1,+1 3.02***
(13.03) 1.22*** (6.77) 0.76*** (4.37) 0.15 (1.03) -0.12 (-0.70)
0.00 156.47*** +2,+40 2.95***
(3.52) 3.47*** (5.34) 2.36*** (3.76) 0.94* (1.68) 0.48 (0.81)
0.00 57.33***
Panel D: Sell -40,-2 4.62***
(3.40) 5.65*** (6.14) 6.67*** (6.25) 5.58*** (4.54) 5.45*** (5.76)
0.58 1.55
-1,+1 0.20 (0.53) -0.44 (-1.73) -0.28 (-0.95) 0.28 (0.82) -0.40 (1.54)
0.27 5.02
+2,+40 3.00** (2.21) -0.83 (-0.89) -0.08 (-0.08) -0.46 (-0.38) -0.42 (-0.45)
0.00 6.39
The table represents cumulative average abnormal returns around directors’ share trading by using the event study methodology. The market model coefficients and are estimated over days -240 to -41 relative to the event date, with FTSE All Share Price Index as the proxy for the market portfolio. The full sample includes 33,991 directors’ trades in 2,664 listed companies, split into 26,268 purchases and 7,723 sells. All results are reported relative to directors’ share trading announcement day, i.e., the date of the public announcement of directors’ share trading. The market-to-book quintiles were formed five days before the announcement dates. If we define t as the event date, then we use t-5 days’ M/B ratio to form quintiles based on the M/B ratio. In forming the quintiles we first sort the CARs by year according to the market-to-book ratio. Each year we then sort the CARs in quintiles by the market-to-book ratio. Finally, we sort them based on quintiles. In doing so, the year effect has been removed from the M/B quintiles. The same steps are followed to form the size quintiles. P high-low
reports the p value of mean difference test between CARs from highest M/B vs. lowest market-to-book quintiles. P small-large
reports the p value of mean difference test between CARs for small vs. large companies. The last column reports the chi-square test for differences in means across market-to-book and size quintiles. t-statistics are reported in parenthesis. ***, **, * denote
33 Table 5. Distribution of Abnormal Returns of Buy Trades by Size & M/B
Low M/B 2 3 4 High M/B
Pre-trade Returns (-40,-2)
Small -4.65***
(-3.62) -4.83*** (-3.52) -3.62** (-2.34) -3.40** (-2.04) -0.32 (-0.15)
2 -12.82***
(-5.56) -13.32*** (-6.30) -6.44*** (-3.63) -5.02** (-2.13) 0.29 (0.14)
3 -7.62***
(-4.08) -4.82*** (-2.73) -6.87*** (-3.19) -7.18*** (-3.68) -0.73 (-0.36)
4 -9.09***
(-4.57) -5.75*** (-2.55) -1.95 (-0.86) -2.26 (-0.96) -2.17 (-1.32) Big -1.68 (-0.25) -14.91*** (-3.54) -3.64 (-1.53) -1.05 (-0.62) -2.06 (-1.09)
Event day Returns (-1,+1)
Small 1.92***
(4.80) 2.35*** (5.48) 2.35*** (4.87) 1.90*** (4.87) 4.13*** (6.04)
2 1.38**
(1.91) 0.88 (1.33) 0.65 (1.18) 1.20* (1.64) 2.54*** (3.80)
3 1.10*
(1.87) 0.52 (0.94) -0.49 (-0.73) 0.20 (0.32) 0.45 (0.72) 4 0.43 (0.69) -1.68** (-2.38) 0.33 (0.47) 0.44 (0.59) 0.22 (0.43) Big 3.16 (1.53) 0.09 (0.07) -0.31 (-0.41) 0.06 (0.12) -0.58 (-0.98)
Post-trade Returns (+2,+40)
Small 4.66***
(5.11) 2.49** (2.55) 1.98* (1.80) 2.07* (1.74) 3.12** (2.01)
2 5.23***
(3.19) 7.07*** (4.70) 0.67 (0.53) 1.80 (1.07) 1.64 (1.08)
3 3.58***
(2.69) 1.49 (1.18) 2.05 (1.34) 3.45 (2.49) -1.73 (-1.22) 4 -0.66 (-0.47) 1.57 (0.98) 1.07 (0.66) 1.60 (0.96) 1.56 (1.33) Big 1.34 (0.29) 7.13** (2.38) 0.43 (0.25) 0.96 (0.79) -0.31 (-0.23)
The above table represents cumulative average abnormal returns around directors’ share trading by using event study methodology. The market model coefficients and are estimated over days -220 to -41 relative to the event, with FTSE All Share Price Index as the proxy for the market portfolio. The sample includes 26,268 purchases. All results are reported relative to directors’ share trading announcement day, i.e., the date of the public announcement of directors’ share trading. The M/B and size quintiles were formed five days before the announcement dates. If we define t as the event date, then we use t-5 days’ M/B and size to form quintiles based on M/B and size. In forming the quintiles, the CARs were first sorted by year according to M/B and size. For each year the CARs were then sorted into quintiles first by M/B and then by size. In doing so, the year effect has been removed from the quintiles. T-statistics are reported in parenthesis. ***, **, * denote significance at the 0.01, 0.05
34 Table 6. Distribution of Abnormal Returns of Sell Trades by M/B and Size
Low M/B 2 3 4 High M/B
Pre-trade Returns (-40,-2)
Small 3.83**
(2.51) 2.91 (1.05) 4.01 (1.60) 2.59 (1.00) 0.11 (0.02)
2 7.67***
(4.94) 1.21 (0.56) 10.60** (2.40) 1.39 (0.47) 0.48 (0.14)
3 3.82**
(2.02) 3.84 (1.55) 10.40*** (3.10) 5.32** (2.18) 8.03** (3.43)
4 10.66***
(3.99) 7.44*** (3.49) 3.85 (1.20) 7.56*** (3.90) 3.20 (1.22) Big 4.23 (1.42) 9.52*** (3.95) 7.97*** (4.52) 7.22*** (3.38) 4.17 (1.06)
Event day Returns (-1,+1)
Small -0.45 (-0.94) 0.50 (0.57) -0.08 (-0.10) 0.80 (0.98) -1.32 (0.90) 2 0.27 (0.56) 0.14 (0.21) -1.90 (-1.37) 0.51 (0.55) 0.31 (0.29) 3 0.79 (1.33) -0.75 (-0.97) 0.04 (0.03) 0.63 (0.83) -0.67 (-0.91) 4 -1.03 (-1.23) -0.61 (-0.92) 0.03 (0.03) 0.01 (0.01) -0.37 (-0.44) Big 0.16 (0.17) -0.33 (-0.44) -0.43 (-0.77) -0.80 (-1.19) -0.66 (-0.54)
Post-trade Returns (+2,+40)
Small 1.80 (1.39) -0.30 (-0.13) -0.83 (-0.39) -4.77** (-2.16) 4.25 (0.90) 2 1.90 (1.44) 1.28 (0.69) -1.51 (-0.40) -2.43 (-0.96) -2.19 (-0.77) 3 -1.02 (-0.63) 2.04 (0.97) -0.28 (-0.10) 3.54* (1.70) 1.41 (0.71) 4 -1.76 (-0.77) -1.04 (-0.57) 2.40 (0.88) -0.43 (-0.26) -1.20 (-0.54)
Big 5.19**
(2.04) -1.07 (-0.52) -2.31 (-1.54) 1.43 (0.78) 3.58 (1.08)
The above table represents cumulative average abnormal returns around directors’ share purchases by using event study methodology. The market model coefficients and are estimated over days -220 to -41 relative to the event, with FTSE All Share Price Index as the proxy for the market portfolio. The sample includes 7,723 sells. All results are reported relative to directors’ share trading announcement day, i.e., the date of the public announcement of directors’ share trading. The M/B and size quintiles were formed five days before the announcement dates. If we define t as the event date, then we use t-5 days’ M/B and size to form quintiles based on M/B and size. In forming the quintiles, the CARs were sorted first by year according to M/B and size. For each year the CARs were then sorted into quintiles first by M/B and then by size. In doing so, the year effect has been removed from the quintiles. T-statistics are reported in parenthesis. ***, **, * denote significance at the 0.01, 0.05
35 Table 7. Distribution of CARs by Stock and Market Volatility
Stock volatility Quintiles
Low 2 3 4 High P High-Low 2(4)
Panel A: Buy
-40,-2 -1.32*** -3.53*** -5.06*** -3.50*** -8.20*** 0.000 30.15***
(-5.11) (-13.10) (-16.41) (-11.07) (-12.80)
-1,+1 0.75*** 0.66*** 0.85*** 0.45*** 2.35*** 0.000 15.65**
(10.87) (7.09) (8.73) (3.83) (12.36)
+2,+40 2.16*** 1.63*** 1.01*** 2.23*** 3.19*** 0.000 5.3
(10.55) (6.88) (3.78) (8.56) (8.15)
Panel B: Sell
-40,-2 5.66*** 4.66*** 3.77*** 4.26*** 9.59*** 0.024 12.95*
(6.12) (5.30) (4.38) (4.22) (6.52)
-1,+1 0.14 -0.45* -0.22 -0.49 0.36 0.692 3.44
(0.81) (-1.78) (-0.76) (-1.55) (0.69)
+2,+40 0.14 -0.20 1.09 -0.95 1.15 0.450 3.36 (0.18) (-0.29) (1.29) (-0.89) (1.04)
Market volatility Quintiles Panel C: Buy
-40,-2 -7.49*** -4.93*** -2.69*** -1.16*** -5.36*** 0.092 42.90***
(-20.71) (-11.08) (-7.27) (-3.95) (-12.18)
-1,+1 0.76*** 0.79*** 1.06*** 1.02*** 1.43*** 0.081 3.63
(7.16) (6.54) (8.89) (8.52) (10.38)
+2,+40 0.97*** 1.44*** 0.45* 3.86*** 3.46*** 0.000 29.80***
(3.23) (4.17) (1.78) (17.16) (13.79)
Panel D: Sell
-40,-2 7.46*** 6.29*** 5.86*** 5.07*** 3.30*** 0.018 8.78*
(4.94) (6.88) (5.75) (6.05) (3.77)
-1,+1 -0.59 0.24 -0.17 0.15 -0.27 0.496 3.44 (-1.61) (0.66) (-0.63) (0.42) (-0.91)
+2,+40 -1.62 -1.66 0.41 2.21*** 1.89*** 0.007 16.42**
(-1.45) (-1.51) (0.52) (3.02) (2.93)
The above table represents cumulative average abnormal returns around directors’ share trading by using event study methodology. The market model coefficients and are estimated over days -220 to -41 relative to the event, with FTSE All Share Price Index as the proxy for the market portfolio. The full sample includes 33,991 directors’ trades in 2,664 listed companies, split into 26,268 purchases and 7,723 sells. All results are reported relative to directors’ share trading announcement day, i.e., the date of the public announcement of directors’ share trading. Stock Volatility is the standard deviation of stock returns over -240 to -41 days and Market Volatility is the standard deviation of market returns over -240 to -41 days. In forming stock volatility quintiles, CARs are sorted by stock volatility. In forming market volatility quintiles, CARs are sorted by market volatility. P low-high reports the p value of
36 Table 8. OLS Results on CARs
Panel A: Buy Trades Panel B: Sell Trades
CAR-1,+1 CAR+2,+40 CAR-1,+1 CAR+2,+40
Model 1 Model 2 Model 1 Model 2 Model 1 Model 2 Model 1 Model 2
Intercept 0.003 (0.79) -0.005 (-0.37) 0.003 (0.11) -0.085*** (-2.39) 0.003 (0.25) 0.002 (0.29) -0.052* (-1.76) -0.048* (-1.89) Size -0.003***
(-5.27) -0.003*** (-5.09) -0.004** (-2.23) -0.004** (-2.23) -0.005 (-0.84) -0.006 (-0.74) -0.004*** (-2.92) -0.004** (-2.25) Market-to-book -0.001*
(-1.94) -0.003* (-2.36) -0.007 (-1.61) -0.007* -(1.80) -0.001 (-0.57) -0.003 (-0.64) 0.002* (1.74) 0.001* (1.65) Stock Volatility 0.518***
(4.80) 0.510*** (3.13) 0.840*** (2.52) 0.789*** (2.36) 0.075 (0.25) 0.073 (0.31) 0.553 (0.54) 0.353 (0.46) Market Volatility 0.353
(0.60) 0.838 (1.06) 0.29*** (3.17) 0.523*** (5.42) 0.414 (0.45) 0.264 (0.41) 0.852*** (4.54) 0.912*** (4.52)
BB Dummy 0.001
(0.44)
-- 0.008
(1.25)
-- 0.003
(0.57)
-- 0.002
(0.52)
--
Industry Dummy Yes Yes Yes Yes Yes Yes Yes Yes
Year Dummy -- Yes -- Yes -- Yes -- Yes
Adj. R2 0.053 0.053 0.042 0.033 0.035 0.020 0.022 0.022
F (Probability) 5.72 (0.00) 5.40(0.00) 3.53(0.00) 3.73(0.00) 0.46 (0.81) 0.38(0.85) 5.06 (0.00) 4.59 (0.00)
Fixed Effects Yes Yes Yes Yes Yes Yes Yes Yes
The above table reports the regression results using the following model.
1 ( ) 2 / 3 4
j j j j j
CAR Ln Size M B Stock Vol MktVol BBDumYear Industry
where, CARj t, is the CAR of insider trades for the (-1,+1) and (+2,+40) event windows. Model 1 is the model with a bull (bear) dummy and industry dummy and model 2 is the model with a year dummy and industry dummy. Size is the natural logarithm of the market value of equity, Market-to-book is the ratio of market-to-book value of equity. Stock Volatility is the volatility of a stock measured by the standard deviation over 180 days prior to the event. Mkt Volatility
37 Figure 1. Monthly NPR and Market Returns
This figure represents a time series of net purchase ratio (NPR Value) and 6-month prior return (PR6) for each month from January 1999 through December 2007. For each month, we calculate the total Pound Sterling volume (and the total numbers of) insider purchases and sells. We then calculate the
NPR by dividing the net aggregate value of insider purchases by the total aggregate value of insider transactions. Prior Returns (PR6) represents the FTSE All Share Price Index returns over the 6 months before the trade.
Figure 2. Aggregate Insider Trading and Bull (Bear) Market
This figure represents a time series of NPR for each month from January 1999 through December 2007. The shaded region is the bull market and contains two periods (January 1999 through March 2000 and January 2004 through December 2007). For each month, we calculate the total numbers of (and the total Pound Sterling volume) insider purchases and sells. We then calculate the NPR by dividing the net aggregate number of insider purchases by the total aggregate number of insider transactions.
0 0.2 0.4 0.6 0.8 1 1.2 -1 -0.8 -0.6 -0.4 -0.2 0 0.2 0.4 0.6 0.8 1 1/1 999 5/1 999 9/ 1 99 9 1/2 000 5/2 000 9/2 000 1/2 001 5/2 001 9/2 001 1/2 002 5/2 002 9/2 002 1/2 003 5/2 003 9/2 003 1/2 004 5/2 004 9/2 004 1/2 005 5/2 005 9/2 005 1/ 2 00 6 5/2 006 9/2 006 1/2 007 5/2 007 9/2 007 -0.3 -0.2 -0.1 0 0.1 0.2 0.3 0.4 -1.2 -1 -0.8 -0.6 -0.4 -0.2 0 0.2 0.4 0.6 0.8 1 01 /199 9 04 /199 9 07 /1 99 9 10 /199 9 01 /200 0 04 /200 0 07 /2 00 0 10 /200 0 01 /200 1 04 /200 1 07 /2 00 1 10 /200 1 01 /200 2 04 /200 2 07 /2 00 2 10 /200 2 01 /200 3 04 /200 3 07 /2 00 3 10 /200 3 01 /200 4 04 /200 4 07 /2 00 4 10 /200 4 01 /200 5 04 /200 5 07 /2 00 5 10 /200 5 01 /200 6 04 /200 6 07 /2 00 6 10 /200 6 01 /200 7 04 /200 7 07 /200 7 10 /200 7 Pr io r R e tu rn (6 M o n th ) N PR ( M o n e y Vo lu m e )