Rochester Institute of Technology
RIT Scholar Works
Theses Thesis/Dissertation Collections
8-1-2012
Changes in reading behavior among ereader
adopters
Lingya Zhang
Follow this and additional works at:http://scholarworks.rit.edu/theses
This Thesis is brought to you for free and open access by the Thesis/Dissertation Collections at RIT Scholar Works. It has been accepted for inclusion in Theses by an authorized administrator of RIT Scholar Works. For more information, please contactritscholarworks@rit.edu.
Recommended Citation
Changes in Reading Behavior Among eReader Adopters
By Lingya Zhang
A thesis submitted in partial fulfillment of the requirements for the degree of Master of Science
in the School of Print Media in College of Imaging Arts and Sciences of the Rochester Institute of Technology
August 2012
School of Print Media Rochester Institute of Technology
Rochester, New York
Certificate of Approval
Changes in Reading Behavior Among eReader Adopters
This is to certify that the Master’s Thesis of
Lingya Zhang
has been approved by the Thesis Committee as satisfactory for the thesis requirement for the Master of Science degree
at the convocation of
August 2012
Thesis Committee:
_______________Patricia Sorce ______________ Primary Thesis Advisor
_______________David Pankow______________ Secondary Thesis Advisor
_______________Patricia Sorce ______________ Graduate Thesis Coordinator
Acknowledgments
Working on this thesis has been a great valuable learning experience for me at
Rochester Institute of Technology. This thesis would not have been possible without Dr.
Patricia Sorce. I owe my deepest gratitude to her dedicated guidance, support, and
encouragement throughout the process.
I am grateful to Professor David Pankow for his guidance and valuable
suggestions during the research. I would like to thank Molly Q. Cort for providing me
thoughtful reviews and comments. Great thanks to Ashley Walker for her extensive
assistance with the online survey. I would like to thank Dealva Jade Dowd-Hinkle for the
wonderful editing job.
It is a pleasure to thank those who made this thesis possible. They are Professor
Charles Bigelow, Professor Howard Vogl, Dr. Scott Williams and other faculty members
at School of Print Media. Thanks for participating in the pilot tests and providing with
constructive advices.
Table of Contents
Acknowledgments... iii
List of Figures ... vii
Abstract ... viii
Chapter 1: Introduction ...1
Topic Statement ...1
Reasons for Interest in the Study ...2
Chapter 2: Review of Related Literature ...4
Media Consumption...4
New Media Platform...4
Screen Reading V.S Paper Reading...5
eReader Reading Habits...6
Platform Preference ...7
General Reading Habits ...8
Heavy Reader...8
Tech-Savvier Youth ...9
Gender and Reading Habit...10
eReader Technology ...10
eReader Growth ...10
eReader Brand Preference...11
Benefits of eReaders for Reading ...12
Chapter 3: Thesis Research Questions...14
Chapter 4: Methodology ...15
Sample...15
Survey Design...15
Procedure ...16
Data Analysis ...17
Chapter 5: Result...18
Background Frequency Analysis ...18
Research Question 1 ...20
Changes of Print Media Usage Among eReader Users ...23
Printed Books...23
Printed Magazines...24
Printed Newspapers ...24
Expected Changes in Reading among Non-eReader Users ...24
Printed Books...25
Printed Magazines...25
Printed Newspapers ...25
Research Question 2 ...26
Research Question 3 ...29
Time Consumption...29
Research Question 4 ...32
Platform Preference and Gender...33
Other Findings ...36
Age and Media Consumption ...36
eReader Preference ...36
Chapter 6: Summary and Conclusion ...39
Summary of Results...39
Discussion of Results...41
Implications for Media Content Providers...44
Limitations of the Research ...45
Bibliography ...47
Appendix A: Response Frequencies ...51
Appendix B: Survey Questions...59
Appendix C: Cross Tabulation...75
List of Figures
Figure 2.1 eReader Brand Preference ...12
Figure 5.1 Gender Difference in Using iPad and Kindle...20
Figure 5.2 Changes in Amount of Reading among eReader Users ...23
Figure 5.3 Expected Change in Amount of Reading among Non-eReader Users...25
Figure 5.4 Comparison of Media Consumption between eReader Users and Non-eReader Users ...27
Figure 5.5 Response Rate of Six Statements Concerning Personal Reading Experience on eReaders...28
Figure 5.6 Comparison of Time Spent Reading on a Computer Screen between eReader Users and Non-eReader Users on a Typical Day ...30
Figure 5.7 Comparison of Text Consumption on Computer Screen between eReader Users and Non-eReader Users ...31
Figure 5.8 Changes in Computer Screen Reading between eReader Users and Non-eReader Users ...32
Figure 5.9 Platform Preference in Reading Books, Magazines and Newspapers...33
Figure 5.10 Platform Preference in Reading Books between Male and Female ...34
Figure 5.11 Platform Preference in Reading Magazines between Male and Female ...35
Figure 5.12 Platform Preference in Reading Newspaper between Male and Female...35
Abstract
As part of the digital publishing revolution, the advent of eReader devices has had
a strong impact on the reading habits of ordinary people and the traditional publishing
industry. This study investigated how people have changed their reading behavior with
the rise of the eReader by analyzing the amount of reading of different material and their
media preferences among different platforms.
An online survey was designed to study the changes in reading habits of faculty
and staff from the Rochester Institute of Technology (RIT). On January 13th, 2011, an
e-mail with a survey link was sent through the RIT e-e-mail system. The survey was closed
after two weeks. Of the 3,600 potential respondents, 600 started the survey, while 563
completed the survey yielding a response rate of 15.6%.
The study found that there were no statistically significant differences between
eReader users and non-users in the average amount of printed books and printed
magazines consumed. However, although half of the eReader users believed their printed
book reading had stayed the same after purchasing an eReader, of the 145 eReader users,
38% reported reading fewer.A similar patterns was found for magazines. The majority of
respondents (86%) reported their printed magazine reading had remained the same
although 10% of the eReader users indicated that they had read fewer after purchasing an
eReader.
The study also showed that eReader users and non-users shared similar interests
in consuming media content. E-mail and news were the most consumed texts both on
amount of time spent on computer reading for eReader users and non-users. In addition,
only 5.1% of eReader users and 1.9% of non-users in this study said they had read
eBooks on computers, making the computer the least popular platform for book reading.
The study revealed that eReaders were the most popular devices among eBook readers.
The Amazon’s Kindle and Apple’s iPad ranked were the most popular brands among
eReader users and potential buyers.
In sum, this study showed that using an eReader device has not impacted reading
behavior in the sample of respondents who were older and more educated than the
general public. Other results from this study were consistent with previous studies: the
younger generation was more likely to adopt an eReader than the older generation; males
were more likely to purchase an eReader device than females; and eReader users were
Chapter 1
Introduction
Topic Statement
Media and publishing industries have been experiencing a transitional change
with the exponential growth and popularity of digital content. As part of the digital
publishing revolution, the advent of eReader devices has had a strong impact on
traditional information consumption. The purpose of this study is to measure changes in
reading habits with the rise of the eReader device.
The National Endowment for the Arts in its 2004 “Reading at Risk” report
presented a 10 percent decline in literary reading from 1982 to 2002: less than half of adult
Americans now read literature. The report also said that electronic media, especially
Internet and portable digital devices, was a key alternative that drew people away from
reading paper publications. The newspaper industry has been facing the same problem:
circulation has declined for 20 years, and there has been a loss of readership to online
media (Shin, 2005). Jupiter research (2006) showed that even the most intensive users of
newspaper and magazines spent less time reading publications in paper format. Instead,
Since eReader devices were brought into the market in 2007, consumers have
swiftly adopted them. The Consumer Electronic Association (CEA) (2009) predicted that
eReader sales would double again in 2012 after its first doubling in 2009. The reason is
that eReaders with e-ink technology provide a superior reading experience for users under
a wide range of lighting conditions; it also enables easy access to large quantities of
information whenever and wherever readers go. With the rise of this new reading
technology, will people consume a larger amount of information than before? Could this
new reading alternative replace traditional paper reading and computer screen reading in
the future?
The purpose of this research was to investigate how people have changed their
reading behavior after adopting an eReader by analyzing the amount of reading and their
media preferences between different platforms.
Reason for Interest in the Study
Since the debut of the Amazon Kindle in 2007 the eReader market has grown at a
fast rate. Within three years time, manufacturers of digital e-reading devices have
Before coming to the U.S, the researcher was working at a book publishing house
in Shanghai, China. The researcher experienced first hand the downward trend of book
reading and the shrinking of printed media consumption in her country. After coming to
the U.S, the researcher worked as a graduate assistant at RIT Cary Graphic Arts Press for
one and half years. During this time, she experienced the significant growth of eReaders
and new challenges that appeared for traditional publishers.
Where will the media and publishing industry be directed in the age of the
eReader? Could eReader devices replace print media and computer screen reading? Since
“books” has become very different from what they used to be, how should traditional
printing and publishing companies deal with the transition? If traditional publishers, as
content providers, could study and understand the reader’s changing media consumption
habits, and their preferences for different reading platforms, they would have more
Chapter 2
Review of Related Literature
In this fast moving world, innovation and technology have brought about
tremendous changes in people’s lives. When the computer and Internet became
widespread, instead of beginning a day with coffee and a delivered newspaper, many
people started reading daily news from websites. In 2008, Microsoft chief executive Steve
Ballmer made a controversial statement: “there will be no newspapers, no magazines that
are delivered in paper form. Everything that gets delivered will be in an electronic form.”
(Whoriskey, 2008) Although this predication looks wide of the mark today, it is undeniable
that with the growth of digital media, a potential revolution is taking place in the practice of
reading.
Media Consumption
New Media Platforms
The advent of digital media and the growing amount of digital information has
there was a 10 percent decline in literary reading from 1982 to 2002 in USA: less than half
of adult Americans now read literature. The report also said that electronic media,
including the Internet, video games, and portable digital devices were the main areas that
drew people away from reading paper publications. Another study conducted in 2005 by
the National Assessment of Adult Literacy (NAAL) reported that the average American
college graduate’s literacy in English has declined by 9 percent from 1992 to 2003. Only
31 percent of the graduates in 2003 demonstrated high-level reading skills (including
being able to read lengthy, complex English texts and draw complicated inferences), as
compared to 40 percent in 1992. Officials said that the drop was because of the rising
number of young people switching from reading literature to watching TV and surfing
online. In the newspaper industry, circulation decline continued a 20-year trend that had
seen a loss of readership to online media (Shin, 2005). Jupiter research (2006) showed that
even the most intensive users of newspaper and magazines spent less time reading paper
publications. Instead, they spent more time reading online.
Screen Reading V.S Paper Reading
With an increasing amount of time spent reading on computer screen, screen-based
reading behaviors have gradually begun to form. Instead of doing in-depth and
concentrated reading, readers spend more time browsing and skipping on the computer
non-linear reading, and more selective reading (Liu, 2005). In a study of reading practices
at the National University of Mexico in 2003, students were asked to do a survey on
computer screen reading versus printed media reading. Ramirez (2003) found that nearly
80 percent of students preferred to print out the needed digital documents in order to
understand the text fully. Nearly 68 percent of respondents reported that they could gain
more information when they read the text on paper format. Olsen (1994) found that lower
resolution on computer screens was one of the major reasons that led readers to choose
print-outs. He also mentioned that readers could more easily gain “visual memory” (get a
sense of the whole text) by flipping a paper document, rather than scrolling on a
computer screen. In a readability study in 2010, Jakob Nielsen conducted a survey on two
of the highest profile tablets: Apple’s iPad and Amazon’s Kindle 2. The study showed that
both devices gave readers a more relaxed feeling as opposed to a computer. However, the
printed book offered the fastest reading speed over the computer and eReader.
eReader Reading Habits
The recent advent of the eReader has captured the interests of many researchers
in the field of media, technology and communication. Since Amazon released its Kindle
eReader in 2007, a number of pilot programs have been employed in the academic
Massis indicated that the eReader had gained more attention among cost-conscious
college students because this group was more likely to adopt digital content. Roger
Fidler, who was leading the Digital Publishing Alliance (DPA), indicated that if an
eReader could replace heavy textbooks, it would help draw in younger consumers
(Shields, 2009). A number of other surveys were designed to find out whether this new
reading technology has brought changes to ordinary people’s reading habits. In a
survey of 1,200 eReader users (Marketing and Research Resources Inc.,2010), 40
percent of respondents said they read more on eReaders than they did with print books.
58 percent of respondents reported they read about the same amount, while only 2
percent said they read less than before. Pew Research (2012) reported that eReader
users read an average of 24 books in 2011, as compared to the 16 books read by
non-eReader users. According to the Harris Poll Reading Habit Survey (2010),
eReader users not only read more books, they were also more likely to buy books.
Platform Preference
Publishers are considering the eReader as another media distribution channel, in
addition to print media, Web and cell phone. Soon after the release of the iPad in April
2010, the New York Times developed an application and started publishing daily news
on this new device. Gordon McLeod, president of The Wall Street Journal Digital
(Shields, 2009). A survey of 2,986 Americans conducted by the Pew Research Center at
the end of 2011 revealed that 20 percent of respondents read an eBook in 2011. 42
percent said they read an eBook on a computer, making computers the most popular
device for reading general eBooks. The survey also found that eReader was the most
popular portable devices among eBook readers (41%), followed by cell phones (29%)
and tablets (23%). Although more and more readers started reading eBooks, they still
continued to read printed books: 88 percent said they read both printed books and eBooks
in 2011. Respondents who preferred eBooks for their quick access and portability, but
chose printed books for reading with children or sharing with others.
General Reading Habits
Heavy Reader
Reading is a complex and variable behavior. It involves different purposes and
requires different skills in handling documents. Based on the Report of the Commission on
Reading (Anderson et al., 1985), “reading is the process of constructing meaning from
written text”. According to a 1995 Simmons Study of Media and Markets (American
Demographics, 1997), the typical “heavy reader” of books (defined as someone who buys
likely to be female than male; to be younger rather than older; and to have achieved a
higher educational level than the population at large” (Book Industry Study Group, 1984).
Recent research found out that eReader and tablet ownership were strongly associated
with education and income, and were also most popular with adults under age 50 (Pew
Research, 2011).
Tech-Savvier Youth
Among all of these transformative shifts, the younger generation has experienced
the biggest change in reading practices. A survey conducted by the National Literacy Trust
in the UK found that children were more likely to own a cell phone than a book. According
to the study, 85.5 percent of 7-to-16 years old British children had their own cell phones,
compared with 72.6 percent who had their own books (Paton, 2010). Another study
released by the Kaiser Family Foundation in early 2009 indicated that although there was a
dramatic decline in print media usage, driven by increased popularity of mobile and online
media, overall media consumption (mainly on cell phone and MP3 players) by the 8-to-18
years old demographic had exploded over the past five years. The average daily media use
by young people in that age group was 7 hours and 38 minutes in 2009, up from 6 hours
and 21 minutes in 2004. Research by the Nielsen Group concluded that the younger
generation was more tech savvy and heavy users of smart phones and laptops for watching
Gender and Reading Habit
A reading habit study in International Islamic University Malaysia in 2007
indicated that gender was significantly associated with reading certain types of reading
materials. The study revealed that male students read significantly more for resources
other than the academic books (Karim & Hasan, 2007). Males were more likely to read
for facts and information, and tended to focus on certain information related to issues or
matters they were facing (Lin & Yeow, 2011). Studies carried out in North America and
Britain found that female read more fiction than male. Women accounted for about 80
percent of the fiction market.
eReader Technology
eReader Growth
Since the launch of Amazon’s Kindle in 2007, which sold out in five and a half
hours (Patel, 2007), a flood of different eReader brands started hitting the market.
Manufacturers of eReaders boomed in 2009, and the new brands began to challenge the
dominance of the Amazon Kindle (Kho, 2010). By the beginning of 2010, American
Another eReader brand Sony, bolstered its eReader with low-priced models and a newly
introduced wireless eBook in 2009 (Electronic Book Survey, 2009). Equipped with
touch-screen capabilities and color e-ink technology, Sony eReaders were going to be the
replacement for textbooks (Penn State University Libraries, 2009). In June 2010, Apple
released the iPad tablet which was considered a multi-task eReader, a platform not only
designed for book reading, but also for magazines, online news, movies, music, and
games.
eReader Brand Preference
In-Stat conducted an online survey to almost 18,000 North America consumers
regarding their attitudes toward eBooks in 2009. The survey received over 1500 responses
and found that the Amazon’s Kindle was the most desirable eReader brand (Electronic
Book Survey, 2009). A survey conducted by Publishing Trends in 2010 (Owen) revealed
that, among the more than 200 respondents – a mixture of agents and editors – 40 percent
of them considered Amazon Kindle to be their favorite eReader brand, with iPad coming
in second (34 percent) (See Figure 2.1). A study from GfK MRI, a Germany market
research company, (2011) found that gender differences could lead to different
preferences in electronic devices: women were more likely than men to own an eReader.
Kobo, 2% Samsung Galaxy, 2%
Nook, 10%
Sony, 12%
iPad, 34%
Kindle, 40%
Kindle
iPad Sony
Nook
Kobo
Samsung Galaxy
Figure 2.1 eRe ader Brand Prefere nce
(Source : Publishing Tre nds, Holiday Books: Giving and Ge tting Survey)
Benefits of eReaders for Reading
Comparing different eReader brands, the desirability, and popularity of one device
over another appears to reflect the number and the flexibility of features offered by each
particular device. According to The Horizon Report-2010, eBooks have become a
cost-saving and portable alternative to heavy textbooks and other educational materials
(Johnson et al., 2010, p. 18). Value-added features such as annotations, hyper-links,
cross-links, saved views, interactive quizzes for individual study, analyses, and shared
commentary from other members of the class were highly appreciated by college users
(Educause, 2010). Fans of eReaders admitted that using these products offered them a
strong sense of control and customization that they had been looking for. First of all,
[image:22.612.196.447.117.265.2]relieve them from the burden of carrying big heavy books during travel. Second, readers
felt more flexible reading on an eReader because text with adjustable font size displayed
on the device is viewable under different lighting conditions: from direct sunlight, partial
shade, to total darkness. Moreover, the physical cost of eReaders is decreasing, and
Amazon cut major eBook title prices to $9.99 or less from $14.99, which is a huge saving
for readers (Streitfeld, 2012).
Summary
With the arrival of digital media and the growing amount of electronic content,
there are a number of significant impacts on people’s reading practices. Many studies have
shown the changes in people’s media consumption and reading behaviors. With the advent
and rise of portable eReader device, it is easier than ever to access volumes of information
whenever and wherever one goes. It will be very interesting to know whether people with
eReaders consume a larger amount of information than before. It is also important to note
people’s expectations and preferences toward their choice of different platforms. The
purpose of this study is to measure how people have changed their reading habits after
adopting an eReader by analyzing the amount of reading and their media preferences
Chapter 3
Thesis Research Questions
This research investigated the change in reading habits with the rise of portable
reading technology. The study answered the following general question: Do reading habits
(defined by amount read and the preferred platform) change with the rise of the eReader?
Specifically, the research objectives are:
● In terms of printed book, magazine and newspaper reading, do people who own an
eReader tend to read more than those who do not have an eReader?
● What is the nature and quantities of material that they consume on eReaders?
● Is there any change in computer screen reading after adopting an eReader?
Chapter 4
Methodology
Sample
Faculty and staff of Rochester Institute of Technology (RIT) were sent an e-mail
message inviting them to complete an online survey about their reading habits. Of the
approximately 3,633 faculty and staff, 600 visited the online site, providing 563 usable
responses – a response rate of 15.6%. The gender and age profiles of the sample were:
65.3% female and 34.7% male; 19.5% 34 years of age or younger, 21.1% age 35-44,
59.4% age 45 or older.
Survey design
The survey questions were designed based on the research objectives and the
literature review. Question logic was used to allow respondents to be classified into two
segments: eReader users and non-eReader users. The researcher examined the
relationship between the independent variables of eReader user versus non-eReader user,
and the dependent variables of changing media consumption, nature and quantities of
Before the survey was sent out, the researcher conducted a pilot test study with
the School of Print Media faculty at the Rochester Institute of Technology (RIT) to
ensure that the question wording was clear and precise. The survey was then edited to
meet the requirements of the RIT Human Subjects Research Office (HSRO), and was
reviewed and approved by the HSRO before it was released. In addition, an introduction
part of the research was presented at the welcome page of the survey, followed by an
informed consent question. Only those who answered “Yes” would be able to start the
survey. A copy of the online survey is presented in Appendix B.
Procedure
The survey was conducted using an online survey service. On January 13th, 2011,
an e-mail with a link was sent to RIT faculty and staff inviting them to complete the
online survey. The respondents were also asked to leave their name and on-campus
mailing address. After two weeks, the survey was closed. As a thank you gift, each of the
first 200 respondents was mailed a java’s coffee token (100 Java’s coffee tokens were
Data Analysis
The total number of respondents was 563 (response rate of 15.6%). Statistical
Package for Social Science (SPSS) was used for data analyses purposes. Overall response
frequencies were analyzed by using descriptive statistics. A statistic t-test was conducted
to measure the relationship between independent variables. Three open-ended questions
were coded appropriately (See Appendix D), and the results of which were discussed in
Chapter 5
Results
The survey was designed to study the changes in reading habits among faculty and
staff from the Rochester Institute of Technology (RIT). Of the 3,600 potential respondents,
563 completed the survey, yielding a response rate of 15.6%. The results of the research are
presented in this chapter. Additional findings are included at the end of the chapter.
Background Frequency Analysis
As a part of the survey, the respondents were asked to answer with their gender, age,
and education. From 591 respondents, a majority of them were female (65.3% female,
34.7% male). The age distribution revealed that more than half of the respondents were
over 45 years old, with 27.7% between the age of 45 and 54, 27.2% between the age of 55
and 64, 21.1% between the age of 35 and 44, and 17% between the age of 25 and 34. Only
2.5% of the respondents were younger than 24. Of the 589 respondents who responded to
the question regarding their education, nearly half of the respondents (42.8%) held a
associate degree, 4.2% held a high school diploma, and 0.8% received other professional
degrees or certificates.
The respondents were classified into two segments, eReader users and non-eReader
users. The majority of the respondents (75.5% of 591 respondents) said they did not own
an eReader. Of the 145 respondents (24.5%) who owned an eReader, 88 were female
(22.8% of the female population) and 57 were male (27.6% of the male population).
One-third of eReader users (32.6% of 145) had an iPad, 28% had a Kindle, 18.8% had an
iPod, 16% had a smartphone, 13.5% had a Nook, and 9% had an iPhone. Only 1.6% had a
Sony eReader. The distribution between younger and older eReader ownership is relative
even (Appendix C, Table 2), with the majority of eReader users between age 25 and 54.
The bar chart (Figure 5.1) shows that 40.9% of female population (88) and 31.6%
of male population (57), who participated in this survey and owned an eReader, used the
Kindle. On the other hand, 29.5% of female population (88) and 36.8% of male
31.60%
40.90% 36.80%
29.50%
0% 10% 20% 30% 40% 50%
iPad Kindle
[image:30.612.197.432.127.284.2]Male Female
Figure 5.1 Gender Difference in Using iPad and Kindle
Almost one-quarter (23.6%) of respondents reported they got an eReader six
months ago, 18.8% got it three months ago, 15.3% got it one year ago, 12.5% got it two
years ago, 7.6% got it 18 months ago, and 6.3% got it three years ago.
The result of the survey and data analysis will be presented in the order of four
research questions addressed in chapter 3.
Research Question 1: In terms of printed book, magazine and newspaper reading, do
people who own an eReader tend to read more than those who do not have an
eReader?
users and non-eReader users: A hypothesis analysis was conducted to identify whether
there was a significant difference between the two groups in the amount of printed books,
magazines and newspapers read.
Within six months’ time period, the average amount of printed book reading for
eReader users in the past six months was 8.68, and the average amount of printed book
reading for non-eReader users in the past six months was 10.05. Using a t-test statistic,
1
μ
= the mean quantity of printed book reading among non-eReader users2
μ
= the mean quantity of printed book reading among eReader usersNull hypothesis and Alternative hypothesis:
0
H
:μ
1=μ
2 There was no significant difference in the sample mean betweenthe two groups
a
H
:μ
1 ≠μ
2 There was a significant difference in the sample mean betweenthe two groups
A significant level of
α
= .05 was used. By using the t-test statistic equation, wehad
(
)
2 2 1 1 0 2 1 2 2 t n s n s d x x + − − =Data extracted from SPSS were inserted into the above equation, and the
t = 1.136
Based on T-Distribution Table, t-value of α = 0.05 was 1.645.
Thus, p-value was larger than p= .05 in this case.
Decision rule (p-value approach):
Reject H0 if p-value ≤ α
Therefore, the null hypothesis was not rejected. Thus, it could be concluded that
there was no statistical significant difference in the sample means of printed book reading
between two groups. Therefore, the amount of printed book reading was not affected by
whether people owned an eReader or not.
Within six months’ time period, the average amount of printed magazine reading
for eReader users was 15.25. The average amount of printed magazine reading for
non-eReader users was 16.55. The t-value = 0.74, p > .05, therefore, the results revealed
that there was also no significant difference in sample mean of printed magazine reading
between eReader users and non-eReader users.
However, a statistically significant difference was found between the two groups
for the amount of newspaper reading within six months (with p-value less than .05, mean
of 1.83 for eReader users vs. 4.32 for non-eReader users, t = 2.96). This may have been
respondents interpreted it as “how many printed newspaper have you read in the last six
months, ” and reported a very large number (e.g.,120), while the answer was expected to
be a number less than 10.
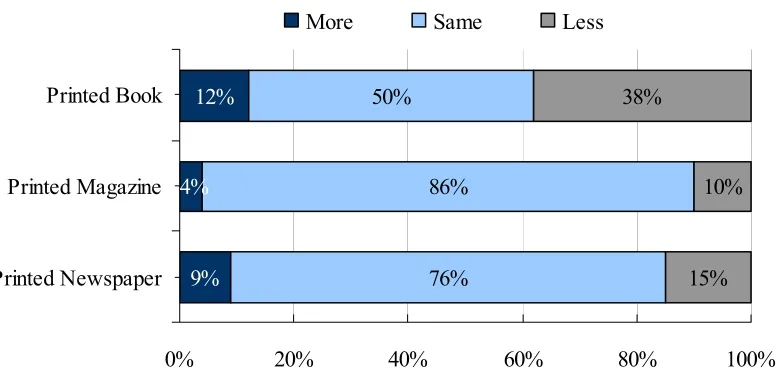
Changes of Print Media Usage among eReader Users
In addition to giving specific numbers on the amount of books, magazines and
newspapers reading, eReader users were asked if their amount of printed books,
magazines and newspapers reading had changed after adopting an eReader. The result
can be shown in Figure 5.2.
9% 12%
76% 86%
15% 10% 38%
4%
50%
0% 20% 40% 60% 80% 100%
Printed Newspaper Printed Magazine Printed Book
More Same Less
Figure 5.2 Changes in Amount of Reading among eReader Users
Printed Books. Although half of the eReader users believed their printed book
[image:33.612.128.518.367.554.2]reported reading fewer. 12% of the eReader users indicated that they had read more
printed books with the adoption of eReader.
Printed Magazines. The majority of respondents (86%) reported their printed
magazine reading had remained the same. 10% of the eReader users indicated that they
had read fewer after purchasing an eReader, with only 4% of the respondents reported
they had read more printed magazines.
Printed Newspapers. eReader users showed a similar response pattern over
changes on printed newspaper reading. The majority of respondents (76%) indicated their
printed newspaper reading had stayed the same. 15% of the eReader users reported they
had read fewer printed newspaper with the adoption of eReader, with 9% of the
respondents reported they had read more printed newspapers than before.
Expected Changes in Reading among Non-eReader Users
Non-eReader users were asked if they expected their reading behavior to change
in the age of digital reading. Figure 5.3 shows the expected change in printed book,
15.9% 12.5% 13.2% 66.4% 74.1% 76.7% 9.8% 6.4% 1.1% 7% 7.9% 9%
0% 20% 40% 60% 80% 100%
Printed Newspaper Printed Magazine Printed Book
More Same Less Unsure
Figure 5.3 Expected Change in Amount of Reading among Non-eReader Users
Printed Books. More than three-fourth (76.7%) of the non-eReader users expected
their printed book reading would stay the same number. 13.2% of the respondents
expected their book reading to increase, as opposed to only 1.1% of the respondents
expecting their book reading to decline.
Printed Magazines. The majority of respondents (74.1%) indicated their magazine
reading would stay the same in the age of digital reading. 12.5% of the non-eReader users
expected to read more magazines, and 6.4% of them expected their magazine reading to
decrease.
Printed Newspapers. Although the majority of respondents (66.4%) expected
there would be no change in newspaper reading, 15.9% of the non-eReader users
indicated their newspaper reading was expected to increase, with 9.8% of the respondents
Research Question 2: What is the nature and quantities of material that they
consume on eReaders?
eReader users were asked what other content they consumed, and non-eReader
users were asked to predict their media consumption on eReaders if they were to buy
them. The data from Figure 5.4 indicated that eReader users and non-eReader users
shared similar interests in consuming media content. 17% of the eReader users reported
that they were currently using eReader to read e-mails. More than one fifth (21.4%) of
the non-eReader users reported they would read e-mails on an eReader if they had one.
Both groups reported a similar response pattern with website browsing, blogging,
movie/music entertaining, and social media usage. 13.6% of the eReader users reported
they were playing games on their eReaders, and 8.9% of the non-eReader users believed
they would play game on eReaders if they got one. Additionally, for eReader respondents
who chose the “Other” option, more than half indicated that their eReader were not
powerful enough to consume other content except books and journals. Among those
non-eReader users who indicated “Other”, almost half of them expected to use it only as
17% 7.70% 12% 7.70% 12.10% 18% 11.80% 13.60% 18.10% 13% 21.40% 8.40% 13.20% 11.90% 8.90% 5.10% 0% 5% 10% 15% 20% 25%
E-mail Blog Movie/Video Music Website Social Media Game Others eReader User Non-eReader User* (* indicated questions asked for expected users)
Figure 5.4 Comparison of Me dia Consumption be twe en eRe ade r Use rs and Non-Use rs
In addition, the researcher asked eReader users to use a five-point likert-type scale
(Ranging from “1 = Strongly disagree” through “3 = Undecided,” to “5 = Strongly agree”)
to indicate the extent to which they agreed with six statements concerning nature of
material and personal reading experience on eReader. The text on the left side of Figure
5.5 is a shorted version of the actual statements in the survey. The answers of “strongly
disagree” and “disagree” are combined under “Disagree” category; the answers of
[image:37.612.130.507.112.270.2]14.40% 26.6% 36.9% 35.5% 32.4% 20.3% 25.20% 16.5% 45.7% 26.1% 18.8% 60.50% 56.8% 17.4% 38.4% 56.8% 60.9% 10.8%
0% 10% 20% 30% 40% 50% 60% 70% 80% 90% 100 %
Books I read tend to be shorter in pages I buy more e-books than I have time to read. I enjoy discovering something new by links I find myself reading more widely and deeply I tend to read for a shorter period of time than I did with
printed texts.
My eyes tire easily
Agree Undecided Disagree
Figure 5.5 Re sponse Rate of Six State me nts Conce rning Pe rsonal Re ading Expe rie nce on eRe ade rs
More than three-fifth of respondents (60.4%) disagree that “books I read tend to
be shorter in length”. Only 14.4% of the respondents agreed with this statement, while
one in four respondents (25.2%) were undecided with this statement.
The next two statements displayed in Figure 5.5 (“ I tend to read for a shorter
period of time than I did with printed texts,” and “ I buy more eBooks than I have time to
read ”) shows similar response rates. Over half of the respondents (56.8%) disagreed with
both statements, while 26.6% agreed that they have bought more eBooks than they had
time to read, and 32.4% agreed that they tended to read for a shorter period of time than
Although a slightly larger proportion (45.7%) was undecided with the statement
“I enjoy discovering something new by links,” the overall balance of responses indicated
that most respondents (37%) enjoyed discovering something new by the links provided.
Only 17.4% of the respondents did not agree with this statement.
Respondents were evenly divided in their responses to the statement, “I find
myself reading more widely and deeply.” More than one-third of the respondents
expressed both agreement (35.5%) and disagreement (38.4%), with 26.1% undecided.
About a third as many respondents disagreed (60.9%) than agreed (20.3%) with
the statement, “My eyes tire easily,” with 18.8% report “undecided.”
Question 3: Is there any change in computer screen reading after adopting an
eReader?
Time Consumption
eReader users and non-eReader users were very similar in time spent reading on a
computer screen on a typical day (Figure 5.6). More than one-third spent 3-5 hours
reading on computer screen. Slightly more eReader users (14.2%) reported spending 8
36.20% 19.90% 14.20% 23.40% 6.40%6.80% 25.20% 35.90% 20% 11.10% 0% 10% 20% 30% 40% Less than 1 Hour 1-2 Hours 3-5 Hours 6-8 Hours More than 8 Hours
[image:40.612.183.440.115.292.2]eReader Users non-eReader Users*
Figure 5.6 Comparison of Time Spent Reading on a Computer Screen between eReader Users and Non-eReader Users on a Typical Day
Text Consumption
This study showed that both groups read email more frequently on computer
screen than any other text: 25.9% of the eReader users and 29.2% of the non-eReader
users reported they checked e-mails on a computer screen. News reading ranked the
second, with 22.8% from the eReader group and 24.2% from the non-eReader group. The
same percentage (17%) of the eReader users and non-eReader users browsed social
media websites on the computer screen, which made it the third largest text consumption
on the computer screen. Neither eReader users nor non-eReader users showed much book
reading on computer screen as compared to other text, with only 5.1% of the eReader
5.10% 22.80% 12.90% 29.20% 4.40% 25.90% 17.70% 11.20% 5.60% 17.70% 10.60% 24.20% 10.80% 1.90% 0% 10% 20% 30% 40%
Book Magazine News Blogs Social
Media
E-mail Others
eReader Users Non-eReader Users﹡
Figure 5.7 Comparison of Text Consumption on Computer Screen between eReader Users and Non-eReader Users
Changes of Computer Screen Reading
Of the 145 eReader user respondents who responded to the question regarding
their changes in computer screen reading after adopting the new device, the majority of
the respondents (78.6%) indicated there was no change in computer screen reading
(Figure 5.8). 15% of the eReader users indicated they had read less on a computer screen,
with only 6.4% reported they had read more on a computer screen.
Non-eReader users were asked if they expected their computer screen reading
behavior to change with the adoption of an eReader. Less than half of the respondents
(41.5%) indicated that there would be no change in computer screen reading. One-third
(33%) of the non-eReader users expected their computer screen reading to increase, with
78.60% 0% 33% 12.30% 13.20% 15% 6.40% 41.50% 0% 10% 20% 30% 40% 50% 60% 70% 80% 90%
More Same Less Unsure
eReader Users Non-eReader Users*
Figure 5.8 Changes in Computer Screen Reading between eReader Users and Non-eReader Users
Question 4: When it comes to reading different material, what is the platform
preference?
eReader respondents were asked to indicate their platform preference in reading
specific material by making a choice between “eReader”, “printed version”, and “It all
depends on the situation”. For book reading, nearly half (49.7%) of the eReader users
indicated “It all depends on the situation.” For newspaper reading, almost half (48.2%) of
the eReader users indicated that “It all depends on the situation.” For magazine reading,
55% of eReader users preferred to read magazines or journals in printed format. Figure
5.9 showed the frequency responses of platform preference of eReader users’ choice to
[image:42.612.133.487.124.298.2]32.60% 11.40% 24.50% 19.10% 55% 25.90% 48.20% 33.60% 49.70%
0% 10% 20% 30% 40% 50% 60% 70% 80% 90% 100%
Newspaper Reading Magazine Reading Book Reading
eReader Printed Version It All Depends on the Situation
Figure 5.9 Platform Pre ference in Reading Books, Magazines and Newspape rs
Platform Preference and Gender
Platform preference varied between the two genders. Figure 5.10 showed that
more male respondents (39.3%) preferred to read printed books versus eReader books
than female respondents (17.2%). With p value less than .05 (Appendix C, Table 3), it
could be concluded that between eReader and printed books, males were more likely to
read printed books than females. Also, there were more male respondents (23.6%) who
preferred reading printed newspaper than that of female respondents (16.3%). However,
there was no statistically significant difference between males and females for
newspapers. In addition, 60% of the female respondents preferred to read a printed
magazine, as opposed to 47.3% of the male respondents. Responses of “It all depends on
the situation” were not provided in the Figure 5.10, Figure 5.11 and Figure 5.12, but
[image:43.612.122.509.102.287.2]regarding their platform preference towards book reading, 37.5% of male and 57.5% of
female considered it all depends on the situation. About one third of male and female
population chose “It all depends on the situation” regarding platform preference towards
magazine reading. About half from both group selected “It all depends on the situation”
regarding platform preference towards news reading.
23.20%
39.30%
25.30%
17.20%
0% 10% 20% 30% 40% 50%
eReader Printed Book
Male Female
Figure 5.10 Platform Preference in Reading Books between Male and Female
16.40% 47.30% 8.20% 60% 0% 10% 20% 30% 40% 50% 60% 70%
eReader Printed Magazine
Male Female
Figure 5.11 Platform Preference in Reading Magazines between
Male and Female
29.10% 23.60% 34.90% 16.30% 0% 10% 20% 30% 40%
eReader Printed Newspaper
Male Female
Figure 5.12 Platform Preference in Reading Newspaper between Male and Female
Other Findings
Age and Media Consumption
Concerning media consumption on computers and eReaders, the study found that
respondents from the youngest age group (25-34) tended to consume more blogs, social
media and games than respondents from the older age group: 34.6% of the respondents
from the age group 25-34 read blogs on the computer screen, as compared to 21% from
the age group 45-54, and 17.6% from the age group 55-64. More than half (53.8%) of the
respondents from the age group 25-34 browsed social media websites, as compared to
21.1% from age group 45-54, and 20.6% from the age group 55-64. The study also
revealed that respondents from the younger age group were more likely to purchase an
eReader within the next three months: 10.3% of respondents from the eReader user age
group 35-44 intended to get another eReader, as opposed to 5.6% from the age group
45-54, and 2.9% from the age group 55-64. Lastly, 16.7% of the non-eReader users who
are younger than 24 planned to get an eReader, as opposed to only 5.9% from the age
group 45-54.
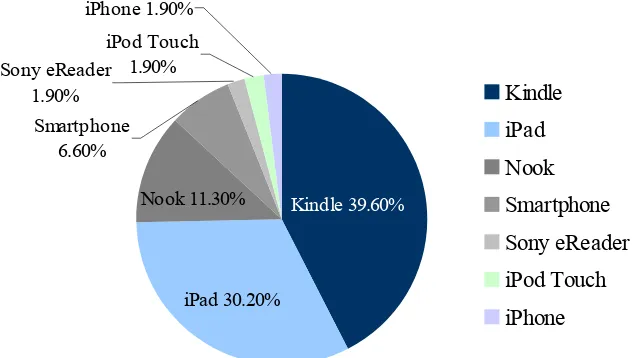
eReader Preference
Within 104 Respondents who did not have an eReader but indicated they would
multi-function (12.6%). Figure 5.13 shows different eReader brand preferences among
non-eReader users. They included the Kindle (39.6%), iPad (30.2%), and Nook (11.3%).
The remainder (12.3%) was either interested in smartphones, the Sony eReader or other
Apple related products. This included the following categories: smartphones (6.6%),
Sony eReader (1.9%), iPod Touch (1.9%), and iPhone (1.9%).
[image:47.612.143.465.269.448.2]iPhone 1.90% iPod Touch 1.90% Kindle 39.60% iPad 30.20% Nook 11.30% Smartphone 6.60% Sony eReader 1.90% Kindle iPad Nook Smartphone Sony eReader iPod Touch iPhone
Figure 5.13 eReader Brand Preference among Non-eReader Users
eReader users were asked to give their personal opinion about using an eReader.
Since the question was open-ended, these responses were coded based on the keywords
respondents provided, and were presented in Appendix D, with the number of responses
on each construct listed and ranked. The coded result matched with non-eReader user’s
opinion towards eReader: Portability, ease of use, accessibility, convenience and price
that portability was the major reason for reading books on an eReader. Half of the
eReader users indicated that they liked reading online news, either on computer screens
or on eReaders. Although the result also showed that certain eReader users (7.6%)
believed there would be no more printed newspapers in the future, majority of eReader
users showed their strong interesting in print media. One-third (30.4%) of the eReader
users reported they still loved reading printed books and magazines. Many reported that
they would never give up using print media even though they got an eReader.
Approximately 15% of eReader users pointed out that the current layout of magazines on
eReader was very frustrating, which prevented them from reading magazines on
Chapter 6
Summary and Conclusion
Summary of Results
The purpose of this study was to measure if people had changed their reading habits
after adopting an eReader by analyzing the amount of reading of different material and
their media preferences among different platforms. The results from Chapter 5 can be
summarized as follows:
1. The majority of survey respondents (75.5%) did not have eReaders. Although
there were more female participants in the survey than male participants, out of the
general population, slightly more male (27.6%) owned an eReader than that of the female
population (22.8%). Also, there were more eReaders being adopted by younger adults
within the age group of 25-34 (26.8 %) than that of other age groups. The majority of the
ownership was under age 50. The iPad tablet and Amazon Kindle were the most popular
eReader devices. They were also one of the eReader devices wanted most by potential
2. No statistically significant differences were found between eReader users and
non-eReader users in the average amount of printed books and printed magazine
consumed. However, although half of the eReader users believed their printed book
reading had stayed the same after purchasing an eReader, of the 145 eReader users, 38%
reported reading fewer. A similar patterns was found for magazines. The majority of
respondents (86%) reported their printed magazine reading had remained the same
although 10% of the eReader users indicated that they had read fewer after purchasing an
eReader.
3. In terms of time spent reading on computer screens and text consumption on
computer screens, eReader users and non-users reported similar response patterns. E-mail,
news, and social media were among the top three digital texts that were consumed on
computer screens. Both groups did not read much eBooks on computer screen, which
made books the least consumed text on computer screen.
4. eReader users were still printed media lovers. More than one third of them
indicated that they loved reading printed books and magazines because they were more
visually entertaining. Many reported that they would never give up using printed media
even though they adopted an eReader. Male respondents were more likely to read in
5. Portability, ease of use, accessibility, price and multi-function were the top five
reasons people purchased an eReader. The study proved that eReaders was the most
popular devices among eBook readers, with Amazon Kindle and iPad ranked top among
eReader users and potential buyers.
Discussion of Results
Previous research has shown that the eReader does affect traditional print media
consumption. This research revealed that there were no differences in printed book and
magazine reading between eReader users and non-users. However, the results may be
impacted by the sample who were older and more educated than other research samples.
It can be concluded from this study that the eReader is an additional fourth media
distribution channel, and that the amount of reading may stay the same with other media
that have been used by the respondents. An example of this is email. E-mail was one of
the top texts consumed on computer screens by RIT faculty and staff and there were no
differences in the amount of time spent on computer reading for eReader users and
non-users.
Previous studies showed that newspapers drew bigger audiences online than they
did in print. This was consistent with the findings of this study: over one-third of eReader
This may be because no one wants to wait for the next day delivered newspaper if they
could easily get online news. Accordingly, subscription to the digital version (website
and eReader version) of New York Times, Wall Street Journal and other newspapers has
gradually replaced home delivery, and has helped reach far more new consumers than
ever.
Results on book consumption were very different from news consumption when
reading on computer screens. Only 5.1% eReader users and 1.9% non-eReader users in
this study said they had read eBooks on computers, making the computer the least
popular platform for book reading. This result was in opposition to previous studies,
which had ranked the computer as the most popular device for reading eBooks. This is
possibly due to the sample population for this study. Respondents in this research did not
favor computer screen reading because sample group in this study, the majority of which
were faculty members, normally spent more time than the general public in doing
in-depth reading. It might be due to the glow from the computer screen which causes eye
strain, or it is easier to get a sense of the whole text by reading on print-out, which proved
Olsen’s “visual memory” theory.
This research proved one popular viewpoint that the Kindle was particularly
users (37%) preferred to read on eReaders. Only 17% of iPad users preferred to read
books on the iPad, while one-third of iPad users chose to turn back to a printed version.
This is possibily because the iPad could cause similar eye strain as a computer screen.
Also, people may be more easily distracted by other applications running on the iPad.
The majority of respondents preferred to read printed magazines because they believed
that the layout and navigation of a printed magazine was better than any e-magazines.
Additionally, readers assumed that the print-quality photos were more visually
entertaining than the digital version.
Demographic difference, such as age, was one of the many factors that might
have affected the results of this research. The research, which was conducted among RIT
faculty and staff, would inevitably deliver an older age group. However, this study still
proved the following two facts: the younger generations were more likely to adopt an
eReader than the older generations and males were more likely to purchase an eReader
device than females. Moreover, this research indicated that many respondents from the
age groups 45-54 and 55-64 were also avant-garde in adopting new technologies. These
results also confirmed one of the results from the Pew Research: eReader and tablet
ownership is strongly associated with income and education, and were also most popular
Implications for Media Content Providers
The results have implications for people who are currently working in the media
industry, and those who are seeking business opportunities during the industry transition
from traditional media to digital content. Based on the findings of the research, book,
magazine and newspaper publishers should develop different strategies to cope with the
new challenges.
First of all, media content providers need to know what the readers want to read,
and through which medium they get that information. It was found from the research that
the portability of an eReader was the top reason for people, especially those who were
frequent travelers, to adopt an eReader. When staying at home, many readers still
preferred to read a printed book. For book publishers, it would be best if they could
provide both print versions and digital versions for different use. Almost one third
(32.8%) of the eReader users in the open question section indicated they liked reading
printed magazines. 18 out of 125 pointed out that the current layout of magazines on
eReaders was very frustrating, and this was the major reason they stopped reading digital
magazines. How, then, can magazine publishers seek to improve the layout on eReaders
and create the content accordingly?
printed versions, even though there were digital versions coming up. Statements like “I
love the glossiness of magazines” were not unusual in the survey. Although print
newspaper circulation continues to decline, the research indicated that people were still
interested in the Sunday Edition newspaper for its thickness and large quantity of
information. As one respondent said: “the ritual of reading the Sunday morning paper is
still my favorite.”
Limitations of the Research
The researcher conducted an online survey among faculty and staff within the
Rochester Institute of Technology. The demographic profile of this particular group was
highly educated and most was above the age of 34. This may not be representative of the
US population at large. As one of the new technologies, eReaders were supposed to be
more widely adopted by the young tech-savvy population. Thus, the sample grouping
which tended to be older might affected the results of this research.
The data collected in this survey was self-reported, especially for several
open-ended questions, and the researcher coded the questions herself. Due to the scope of
personal knowledge and understanding, there might be some inaccuracies in reporting. In
addition, survey respondents had the option to leave some of the questions unanswered
For several questions concerning quantitative data input, respondents who
misunderstood the question raised by the research had caused inaccuracy in the results.
For example, when asking “how many different types of printed newspapers have you
read in the last six months,” many respondents interpreted it as “how many printed
newspapers have you read in the last six months,” and inputted a very large number (e.g.,
Bibliography
Aseguin (2010). eBooks v.s books: how the eReader measures up to traditional print media. Retrieved January 4, 2011, from
http://blog.sherweb.com/e-books-vs-books-how-the-e-reader-measures-up-to-traditional-print-media/.
Ananthakrishnan G. (2007). The challenge of growth for the news media. The Hindu,1.
Birkerts, S. (2010). Reading in a digital age. The American Scholar, 79(2), 32-44.
Epstein, J. (2006). Are newspaper doomed? Commentary Magazine. Retrieved April 12, 2011, from
http://www.commentarymagazine.com/viewarticle.cfm/are-newspapers-doomed—10012.
Fowler A.G. & Baca C.M. (2010). The ABCs of eReading. Retrieved May 2, 2011, from
http://online.wsj.com/article/SB10001424052748703846604575448093175758872.html.
Claudine B. (2009). Cooler eBook reader: is this the iPod for books? The Daily Telegraph, 24.
Dunay, P. (2008). Market to change customer behavior, not attitudes. Retrieved May 2, 2011, from
http://pauldunay.com/market-to-change-customer-behavior-not/comment-page-1/.
Harris Poll (2010). One in ten Americans use an eReader. Retrieved May 5, 2011, from
http://www.harrisinteractive.com/NewsRoom/HarrisPolls/tabid/447/ctl/ReadCustom%20 Default/mid/1508/ArticleId/568/Default.aspx.
Health P.R. (1997). In so many words: how technology reshapes the reading habit. American Demographics. Retrieved August 14, 2012, from
Mount H. (2010). We’re still reading, but it’s the wrong stuff. The Daily Telegraph, 22.
Johnson, L., Levine, A., Smith, R. and Stone, S. (2010). The horizon report. The New Media Consortium, Austin, TX, 17-18.
Johnson, S. (2009). How the eBook will change the way we read and write. The Wall Street journal, R1.
Karlin L. (2010). Why I just can’t wait to hold off on buying one of those iPads. Irish Times, 6.
Levy, D.M. (1997). I read the news today, oh boy: reading and attention in digital libraries (Proceedings of the 2nd ACM International conference on digital libraries, Philadelphia, PA, 202-211).
Lin, R & Yeow, G. (2011). The great gender divide on reading habits. Retrieved August 25, 2012, from
http://thestar.com.my/lifestyle/story.asp?file=/2011/6/26/lifebookshelf/8862809&sec=life bookshelf.
Liu, Z. (2005). Reading behavior in the digital environment: changes in reading behavior over the past ten years. Journal of Documentation, 61(6), 700-712.
Massis E.B. (2010). eBook readers and college students. New Library World,111(7/8), 347-350.
Nilay P. (2007). Kindle sells out in 5.5 hours. Retrieved April 14, 2011, from Engadget.com. http://www.engadget.com/2007/11/21/kindle-sells-out-in-two-days/.
Nor Shahriza Abdul K. and Amelia H. (2007). Reading habits and attitude in the digital age: analysis of gender and academic program differences in Malaysia. The Electronic Library, 25(3), 285-298.
Owen, H. L. (2010). Holiday books survey results are in. Retrieved April 12, 2011, from
Owen, L.H. (2011). Tablets are for men, e-Readers are for women? So the research (and
Ads) say. Retrieved August 24, 2012, from
http://paidcontent.org/2011/07/06/419-tablets-are-for-men-e-readers-are-for-women-so-th e-research-and-ads-say.
Penn State University Libraries (2009). 7 things you need to know about Sony Readers in a higher education environment”, White paper. Retrieved May 3, 2011, from
http://libraries.psu.edu/etc/medialib/psulpublicmedialibrary/lls/documents.Par.53256.File. dat/7things_SonyReader.pdf.
Pew Internet and American Life Project (2012). The Rise of E-Reading. Retrieved August 13, 2012, from
http://pewresearch.org/pubs/2236/ebook-reading-print-books-tablets-ereaders.
Ramirez, E. (2003). The impact of the Internet on the reading practices of a University community: the case of UNAM (Proceedings of the 69th IFLA General Conference). Retrieved April 10, 2011, from www.ifla.org/IV/ifla69/papers/019e-Ramirez.pdf.
National Endowment for the Arts (2004). Reading at risk: a survey of literary reading in America. Research Division Report #46. Retrieved January 3, 2011, from
http://www.nea.gov/pub/ReadingAtRisk.pdf.
Sartain, J. (2010). Why e-Readers are a worthy business investment. Retrieved May 3, 2011, from
http://www.washingtonpost.com/wp-dyn/content/article/2010/07/07/AR2010070704459. html.
Shields, M. (2009). eReaders: will they save the publishing industry? Retrieved May 3, 2011, from
http://www.adweek.com/aw/content_display/news/digital/e3i5d92320f49c835bc883d054 d162bde57.
Streitfeld, D. (2012). Cut in eBook pricing by Amazon is set to shake rivals. Retrieved August 13, 2012, from
http://www.nytimes.com/2012/04/12/business/media/amazon-to-cut-e-book-prices-shakin g-rivals.html?_r=2&pagewanted=all.
Webber, K. (2010). The many advantages of eReaders. Retrieved January 4, 2012, from
Appendix A
Response Frequencies
Questions Total
Background Questions
Q1: Gender:
Net Answering n=591
Male 34.70%
Female 65.30%
Q2: Age:
Net Answering n=570
0-24 2.50%
25-34 17.00%
35-44 21.10%
45-54 27.70%
55-64 27.20%
65-74 4.60%
Q3: Highest Education Achieved:
Net Answering n=589
High School Diploma 4.20% Associate Degree 7.50%
Bachelor's Degree 22.80%
Master's Degree 42.80%
Ph.D 18.20%
Professional Degree 0.80%
Q4: Do you own an eReader?
Net Answering n=591
Yes 24.50%
No 75.50%
eReader owner Non-eReader owner
Q5: Which eReader do you own? Questions Total
Net Answering n=144
Nook 13.50%
Sony 1.60%
iPod 18.80%
iPhone 9.00%
iPad 32.60%
Smartphone 16.00%
Q6: When did you get your first eReader?
Net Answering n=144
3 months ago 18.80%
6 months ago 23.60%
1 year ago 15.30%
18 months ago 7.60%
2 years ago 12.50%
3 years ago 6.30%
eReader User Book Reading Non-eReader User Book Reading
Q7: Number of printed books Number of printed books read
Net Answering n=143 Net Answering n=445
0-10 75.50% 0-10 71.50%
11-20 13.30% 11-20 17.80%
21-30 7.00% 21-30 7.00%
31-40 2.10% 31-40 0.90%
41-50 1.40% 41-50 1.60%
>51 0.07% >51 1.30%
Mean 8.68 Mean 10.05
Standard Deviation 11.2 Standard Deviation 14.5
Q8: Number of e-book
Net Answering n=143
0-10 88.10%
11-20 7.70%
21-30 2.10%
31-40 1.40%
>40 0.70%
More 12% Increase 13.20%
Less 38% Decrease 1.10%
The same number 50% Stay the same 76.70%
Unsure 9.00%
Q10: How do you prefer to read books?
Net Answering n=143
Using an eReader 24.50%
Reading printed books 25.90%
It all depends on the situation 49.70%
eReader User Magzine/Journal Reading Non-eReader User Magazine or Journal Reading
Q11: Number of printed magazines Number of printed magazines
Net Answering n=142 Net Answering n=438
0-10 54.20% 0-10 46.80%
11-20 21.10% 11-20 26.50%
21-30 9.90% 21-30 13%
31-40 9.20% 31-40 4.30%
41-50 2.10% 41-50 3.20%
>51 3.50% >51 6.20%
Mean 15.25 Mean 16.55
Standard Deviation 17.78 Standard Deviation 19.18
Q12: Number of e-Magazines
Net Answering n=141
0-10 80.90%
11-20 6.40%
21-30 5.70%
31-40 1.40%
41-50 0.70%
>51 5.00%
Q13: Changes on reading printed magazines or journals: Expectation of magazine or journal reading
Net Answering n=140 Net Answering n=440
More 4.30% Increase 12.50%