City, University of London Institutional Repository
Citation
:
Kaparias, I., Eden, N., Tsakarestos, A., Gal-Tzur, A., Gerstenberger, M.,
Hoadley, S., Lefebvre, P., Ledoux, J. and Bell, M. G. H. (2012). Development and application
of an evaluation framework for urban traffic management and Intelligent Transport Systems.
Paper presented at the Transport Research Arena – Europe 2012, 23-04-2012 - 26-04-2012,
Athens, Greece.
This is the published version of the paper.
This version of the publication may differ from the final published
version.
Permanent repository link:
http://openaccess.city.ac.uk/6255/
Link to published version
:
http://dx.doi.org/10.1016/j.sbspro.2012.06.1276
Copyright and reuse:
City Research Online aims to make research
outputs of City, University of London available to a wider audience.
Copyright and Moral Rights remain with the author(s) and/or copyright
holders. URLs from City Research Online may be freely distributed and
linked to.
City Research Online:
http://openaccess.city.ac.uk/
[email protected]
Procedia
Social and
Behavioral
Sciences
Procedia - Social and Behavioral Sciences 00 (2011) 000–000
www.elsevier.com/locate/procedia
Transport Research Arena– Europe 2012
Development and application of an evaluation framework for
urban traffic management and Intelligent Transport Systems
Ioannis Kaparias
a*, Niv Eden
b, Antonios Tsakarestos
c,
Ayelet Gal-Tzur
b, Marcus Gerstenberger
c, Suzanne Hoadley
d,
Patrick Lefebvre
e, Justin Ledoux
e, Michael Bell
aaCentre for Transport Studies, Imperial College London, Skempton Building, South Kensington Campus, London SW7 2BU, UK bTransportation Research Institute, Technion – Israel Institute of Technology, Technion City, Haifa, Israel
cChair of Traffic Engineering and Control, Technische Universität München, Arcistrasse 21, 80333 Munich, Germany dPolis – European Cities and Regions Networking for Innovative Transport Solutions, 98 rue du Trône, B-1050 Brussels, Belgium
eDepartment of Roads and Transportation, City of Paris, 40 rue du Louvre, 75001 Paris, France
Abstract
The aim of this paper is to present and apply a new evaluation framework for traffic management and Intelligent Transport Systems, to assist urban transport authorities in assessing relevant policies and technologies as to their performance. The principles behind performance measures and indices are outlined, along with a description of the framework development methodology. Two Key Performance Indicators (KPIs) for the topics of mobility and traffic accidents respectively are formulated and operative definitions are presented. Then, the new KPIs are applied to a case study in the city of Paris, involving the introduction of a scheme granting priority to buses at signalised junctions. The results from the before- and after-analysis are reported and interpreted, not only in terms of the case study itself, but most importantly from the standpoint of the applicability of the evaluation framework.
© 2011 Published by Elsevier Ltd. Selection and peer-review under responsibility of TRA 2012
Keywords: urban traffic management; Intelligent Transport Systems; performance evaluation
1.Introduction
Cities today share common transport problems and objectives with respect to traffic management, and
* Corresponding author. Tel.: +44-20-7594-5952; fax: +44-20-7594-6102.
put great focus on Intelligent Transport Systems (ITS), but have different characteristics and individualities. However, despite the fact that similar policies and technologies may be implemented in different cities, each city tends to be autonomous and act in response to its own political pressures, which may be different even within the same country.
In the absence of a set of widely accepted performance measures and transferable methodologies, it is very difficult to globally assess the effectiveness of urban transport policies and ITS. Indeed, cities have often developed their own performance indices with the aim of evaluating the effectiveness and success of individual traffic management policies and ITS implementations. However, these have been mostly used on an ad hoc basis, and as a result, refer only to the city in question and are not able to provide objective conclusions about whether a specific policy or technology that had certain effects in one city could have similar or different effects in other ones.
As identified by a focus group consisting of representatives of 16 European cities in May 2010, the development of a set of common Key Performance Indicators/Indices (KPIs) can assist in overcoming the issue of the comparative assessment of traffic management and ITS (Zavitsas et al, 2010) by providing an innovative benchmarking process. As such, within the framework of the European Commission funded CONDUITS coordination action, three research teams from Imperial College London, Technion – Israel Institute of Technology and Technische Universität München have worked on the task of the definition of a common evaluation framework for urban traffic management and ITS. Four strategic themes of urban traffic management have been tackled: traffic efficiency; traffic safety; pollution reduction; and social integration and land use. The aim of this paper is to present two of the developed KPIs for the themes of mobility and traffic accidents within the strategic themes of traffic efficiency and traffic safety respectively, and to demonstrate their operation through their application to a case study in the city of Paris, involving the implementation of bus priority measures.
The paper is structured as follows: Section 2 presents the conceptual framework of performance measurement in the field of urban traffic management and ITS. Section 3 then introduces the new performance evaluation framework and presents the operative definitions of the KPIs for the themes of traffic efficiency and traffic safety. The application of the KPIs to a case study in the city of Paris is documented in Section 4, and the results are discussed. Finally, Section 5 concludes the paper and identifies directions of future research.
2.Conceptual framework of performance measurement
As part of the definition of the conceptual framework, this section first indentifies the needs from performance measurement in urban traffic management and ITS, and then provides a description of the development methodology of a common evaluation framework.
2.1.Requirements of performance measures
Performance measurement and monitoring significantly impact the development, implementation and management of existing transport plans and programmes, and largely contribute to the identification and assessment of alternatives. Moreover, performance measurement and monitoring enable obtaining the data necessary to compare different projects and programmes in future scenarios and to evaluate the same project and system at different time points (e.g. before- and after-analysis). Accordingly, data obtained from performance measures can be elaborated in order to construct composite performance indices for these comparison and evaluation purposes mostly in the macro level.
inclusion. These many dimensions make performance-based planning more challenging in the transport field than in more narrowly focused sectors. Also, performance measures can be classified according to different transport modes (e.g. private or public transport), according to whether they apply to freight or passenger transport, and according to the system level or the planning jurisdiction for which they are most relevant. Lastly, performance measures can be classified according to the perspective of the performance (user or planner).
Performance indices, on the other hand, combine various measures into a single indicator, potentially covering multiple dimensions, or even goal categories. Performance indices are relevant to planners and decision makers that intend to reduce the complexity and volume of performance-related data that must be regularly monitored or factored into a specific decision. For example, several instances of travel time as a performance measure of different links, routes and transport modes of a network can be used to form a composite performance index of mobility, in a similar way as the Consumer Price Index in Microeconomics reflects through a single number the cost of a broad “market basket” of goods and services regularly purchased by the typical consumer (Sheikh et al, 2011).
Performance measurement should not be arbitrary but should be driven from and cater for the needs of the users of the measures and indices, who in the case of urban traffic management and ITS are the planning authorities of cities. To understand what is required from an evaluation framework, a focus group of 16 European city representatives was held, leading to the compilation of a city “wish-list” (Zavitsas et al, 2010).
The most important requirement on this list was that performance measurement should assess benefits and should assist traffic managers in their decision-making procedures. The assessment of the benefits does not necessarily indicate the direct comparison of the effectiveness of a city’s policies and technologies with another, but signifies mainly the evaluation of the benefit of a specific investment against its cost, and also implies the assessment of the usefulness of ITS, not just with respect to specific applications, but as a whole. This assessment also offers invaluable assistance to decision-makers in the form of “lessons learnt” either locally or from other cities.
Other desired functionalities stated by the cities were that performance measurement should:
promote cities’ interests by reflecting both the user’s satisfaction and the system operator’s concerns, make use of existing data, as collected by cities already, and should not necessitate the collection of
any new data,
consider the individuality of cities,
be easy to apply and simple to convey to the public, and be projectable by means of integration with existing models.
2.2.Development of performance measures
The development of performance measures involves the definition of goals and objectives, the specification of the dimensions of performance measures, the identification of the selection criteria for performance measures, and the description of the data requirements and analytical tools for monitoring performance. Examples of previous detailed discussions on performance measures can be found in the literature (Reed et al, 1993; Poister, 1997; Cambridge Systematics Inc., 2000; Cambridge Systematics Inc. et al, 2005). Moreover, the development of performance measures assumes relevance as composite indices are constructed for the purpose of comparing different projects under different future scenarios and evaluating projects at different time points.
stated in measurable terms (e.g. “to halve the number of alcohol-related traffic fatalities”). Some practitioners believe that a performance standard should be established for every objective and measure, but some planning organisations do not use performance standards because of limited experience in handling the measure in question, defining the data requirements and mastering the analytical tools. Experience is fundamental for planning organisations to “set the bar” in terms of desired future performance. The breadth and depth of issues identified by transport planners produce challenges for decision-makers, who face trade-off decisions to avoid excessive complexity as the volume of issues and information required increases. Decisions about the areas in which performance should be measured can bias the types of projects that are eventually implemented. For this reason, it is usually appropriate to employ a variety of measures accounting for several desired outcomes in order to evaluate and select projects with broader effects.
Performance measures are required to satisfy some of the properties that by definition constitute their selection criteria. First and foremost, performance measures should be measurable with the tools and resources available, with adequate accuracy and with easily obtainable data (measurability). Then, they should enable comparison of future strategies through existing forecasting tools (predictability), they should be understandable to policy makers, professionals and also the general public (clarity), and they should provide a direct measure of the issue of concern, to either motivate further study or action or to diagnose deficiencies and their causes (usefulness). Performance measures should furthermore encompass all relevant transport modes (multimodality), should be comparable across time (i.e. express the temporal extent of congestion or other conditions) and fit the timeframe of analysis and action (temporality), and should be applicable and useful to the national, regional or local level, as required (geographical scale). Finally, they should facilitate the control and correction of measured characteristics (control), and also be relevant to the planning and project design processes so as to provide support to decision-makers (relevance).
Performance measures are selected also according to data requirements, as it is often the case in practice that all the needs and costs arising from the collection of the necessary data cannot be addressed. Operations-oriented measures rely to some extent on traditional data collection programmes and techniques, but more broadly defined outcome measures are likely to require additional types or quantities of data. For example, traffic efficiency measures frequently necessitate sample data on travel time or speed, while social inclusion measures require spatially allocated travel and socioeconomic information. In general, the data needs of performance measures can be covered by the following sources: surveys (e.g. household, stated-preference, public transport, etc.); traffic monitoring (e.g. traffic counts, vehicle classification, etc.); highway performance monitoring (e.g. environmental impacts, accidents data, travel activity, etc.); and ITS data (e.g. Dedicated Short Range Communications, Automatic Number Plate Recognition, etc.). The approach most used in practice consists of identifying the ideal measures that relate to a specific purpose, and then working backwards to surrogate measures developed using more readily available data.
results to the general public.
Finally, performance measures should be supported by robust analytical methods and tools in order to be operational. These include: urban/regional/national travel demand forecasting models (to estimate data that would be difficult to measure in the field and to forecast in the short-term); travel survey manuals (to guide and improve data collection); cost-benefit analyses (to quantify and consider user benefits, such as travel time savings, as well as externalities, such as vehicle emissions, energy costs and benefit-cost ratios); and incident-related effects and management strategies (to investigate the impacts of non-recurring congestion and the effectiveness of strategies to mitigate that congestion).
3.Definition of Key Performance Indices
Performance measures reflecting the above-mentioned considerations have the ability to effectively evaluate the outputs of specific projects. However, when attempting to conduct a higher-level evaluation through a multi-dimensional benchmarking scheme comparing different cities with each other, performance measures are generally not suitable. The reason is that such a task necessitates the systematic and synthetic description of the cities’ transport policies and infrastructures and the analysis of their impacts, which can only be expressed by a set of measures reflecting each individual scheme evaluated (Cianfano et al, 2011). This issue creates difficulties in the communication of the results to non-technical audiences, and a common way to deal with it is to combine individual performance measures into composite performance indices (KPIs) (Cambridge Systematics Inc., 2000; Zhou et al, 2006; OECD & JRC, 2008).
The main advantage of KPIs is simplicity, as it is much easier to understand and grasp a single number rather than a large collection of individual measures, whose meaning often requires trained insight and careful analysis. The disadvantage, nevertheless, is that an aggregate number does not provide immediate insight into which aspects of performance are changing or why, making it difficult to distinguish the sensitivity of an index to changes in its component measures. However, this ambiguity may lead to some other advantages. The index increases the opportunity for all modes and markets to be included, conveys the idea that each service is important, and elevates the discussion about how best to measure and report system performance. This cooperation between modes and sectors enhances awareness, broadens perspectives and leads to more comprehensive solutions.
In line with the European Commission’s strategy on the future of transport, as presented in the 2001 and 2011 white papers, a performance evaluation framework was defined, consisting of a set of measures and KPIs for the four strategic themes of traffic efficiency, traffic safety, pollution reduction, and social inclusion and land use (Kaparias et al, 2011). Among the KPIs of the complete framework, this study focuses on the indices for mobility, as part of traffic efficiency, and for accidents, as part of traffic safety.
3.1.Traffic efficiency – Mobility
The vast majority of urban traffic management policies and solutions, including those involving ITS, have the improvement of traffic efficiency as their objective. While the implementation of a specific policy or technology may have several objectives across the spectrum of urban traffic management, traffic efficiency usually figures high among them. This makes the quantification of the performance in terms of traffic efficiency very important.
network-wide level, i.e. between a large number of origin and destination zones across the city, and may refer to the private or public transport networks on their own, or to the entire system.
The primary constituent performance measure of mobility is the average travel time. Hence, the mobility performance KPI defined here essentially encompasses the average travel time to different destinations in the highway and public transport networks expressed in time units, normalised by the distance to the destinations, and weighted by importance according to the goals and objectives of the application under consideration. The mobility KPI, IMOB, expressing the average travel rate (defined as travel time per unit length) in minutes per kilometre, is thus formulated as follows:
PV PT
PV PT
R r R r
PV PT
MOB PV r PT r
r R r r R r
ATT
ATT
I
w
w
w
w
D
D
(1)where:
r a route (specific OD pair) among a set of selected RPV and RPT on the road and public transport network respectively
ATTrPV average travel time in minutes for route r on the road network
ATTrPT average travel time in minutes for route r on the public transport network
Dr length in kilometres of route r
wr represents the weight of route r
wPV represents the weight of the travel time on the road network
wPT denotes the weight of the travel time in public transport
Within the average travel time assessment the route weights wr have to be determined with values from 0 to 1, with the target sum set to 1. The spatial concern of the analysis influences this selection of routes (origins and destinations), as national and regional authorities are likely to have different needs than local authorities. In general, locations of public services relevant to the examined spatial concern, the main road network junctions according to the road hierarchy of the examined area, and the public transport terminals at the desired level of depth, should all be considered. It should be noted that the dimensionless weights
wPV and wPT are to be determined through an expert-based technique, such as the Delphi method (Linstone & Turrof, 1975; Nijkamp et al, 1998).
3.2.Traffic safety – Accidents
Despite considerable improvements in recent years, safety is still a key issue within transport planning, as many people are involved in road accidents every day, often suffering injury or death. A variety of measures aiming at reducing traffic accidents have been introduced throughout the last decades, with ITS increasingly playing a prominent role (e.g. collision control, variable speed warning signs, etc.). As is expected, the improvement of traffic safety is a priority for city authorities, and the quantification of a city’s performance in that aspect is essential.
The safety level of transport infrastructure is defined by the number of accidents on one hand, and by the impact of the accidents on the other. Accident numbers are fairly straightforward to obtain and analyse; however, the quantification of the impact is more complex and is mostly measured as the number of people injured or killed (Elvik et al, 2009). The main factors influencing road injuries are: exposure (the amount of travel), accident rate (the risk of accident per unit of exposure), and accident severity (the outcome of accidents concerning injuries).
each city has its own traffic and accident characteristics by introducing weighting factors to specific accident type and severity categories. The accidents KPI is thus formulated as follows:
, ,
L SE M
l se m
ACD l se m
l L se SE m M l
ACD
I
w
w
w
DTV
(2)where:
wse weight representing the importance of reducing the number of casualties in accidents with a specific severity se from the set of possible severity levels SE (uninjured, slightly injured, seriously injured or killed)
wm weight representing the importance of reducing the number of casualties in accidents involving a specific traffic mode m from the set of possible traffic modes M (car, truck, bus, motorcycle, bicycle, pedestrian)
wl weight representing the importance of link l, among the set of links L of the network, in terms of safety
ACDl,se,m number of casualties of severity se involving users of mode m on link l on an average day
DTVl daily traffic volume on link l in million vehicles
The values of wse, wm and wl can be varied between 0 and 1, but it should be ensured that the values of each importance item sum up to 1. Similarly to the mobility KPI, their values can be determined through an expert-based technique, such as the Delphi method.
It should be noted that the index defined by equation (2) considers that accidents occur on links. Nevertheless, due to the fact that traffic management and ITS applications have different impact areas, it is often more appropriate to differentiate between accidents at links and junctions. In that case, an identical accidents index for junctions can be defined, whereby for each junction j among the set of junctions considered J a weight value wj will apply. The indices of links and junctions can be then added to deduce the total accident index; in has to be ensured, however, that the sum all wl and wj values is 1.
4.Application and results
To demonstrate the operation and applicability of the performance evaluation framework, the KPIs defined above are applied to a case study in the city of Paris, so as to conduct a before- and after-assessment of the performance of three bus lines following the implementation of priority measures.
4.1.Case study: Bus priority in Paris
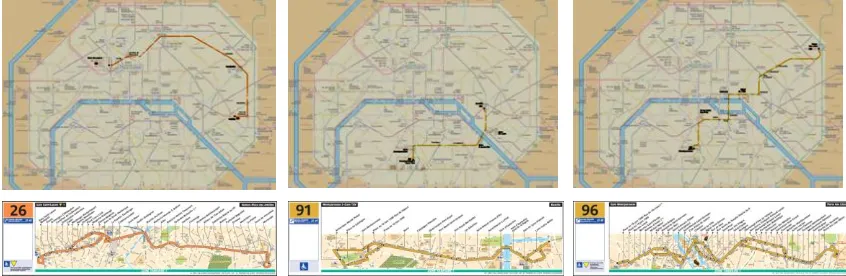
In 2003 the Paris public transport authority (“Syndicat des transports d'Île-de-France (STIF)”) investigated the potential application of a system granting priority to buses at traffic signals, which resulted in the compilation of a set of technical specifications to traffic managers. The investigation was followed up by a pilot experiment, during which bus priority was implemented at four intersections in the city of Paris, the encouraging results of which led to the decision of deploying the system on several bus lines. Installation work on lines 26, 91 and 96, the location of which within the inner city of Paris is shown in Figure 1, began in 2006.
current position and anticipated time of approach. Approximately 150 signalised junctions were affected, involving a total cost of installation in excess of €3 million. It was anticipated that the application of the system on the three lines would result in an average travel time saving of the order of 30 seconds per passenger. Given an average volume of 10 million passengers per year on each of the lines, the anticipated saving would correspond to a saving of one vehicle on each line for the bus operating company.
Fig. 1. Paris bus lines 26, 91 and 96 (Source: RATP)
4.2.Mobility assessment
For the assessment of the mobility of travellers as a result of the introduction of the priority measures each of the three bus lines has been broken up into four route segments of given length per direction, resulting in eight route segments per line and 24 route segments in total. Average peak-time bus travel times for each of the route segments have been measured over periods before and after the implementation of the priority, in order to identify travel time gains. Furthermore, a number of route segments of given length have been identified on the private transport network as being affected by the priority scheme (three for line 26, eight for line 91 and six for line 96, resulting in a total of 17), for which average vehicle traffic travel times were measured for the same periods before and after the implementation. The mobility KPI, as expressed by Equation (1), is used to perform an assessment of the overall impact of the scheme in terms of mobility on each of the lines, for public and private transport separately, taking equal weights for each of the route segments.
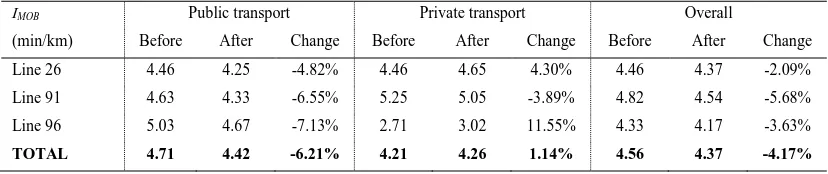
The results of the mobility assessment are shown in Table 1. As can be seen, the priority measures appear to have resulted in a reduction of the public transport travel rate values (and hence in improved public transport mobility) for all three lines. Consequently, an overall decrease from 4.71 min/km to 4.42 min/km for public transport is recorded across the three lines, corresponding to an improvement (reduction) of 6.21% in public transport mobility. On the other hand, the priority measures seem to have negatively affected private transport mobility on lines 26 and 91, resulting in increased average travel rates, but not on line 91, for which slightly improved private transport mobility is recorded. Consequently, the overall private transport mobility has seen a marginal deterioration of 1.14%, expressed as a slight increase in the average travel rate from 4.21 to 4.26 min/km.
Table 1. Mobility assessment results
IMOB
(min/km)
Public transport Private transport Overall
Before After Change Before After Change Before After Change
Line 26 4.46 4.25 -4.82% 4.46 4.65 4.30% 4.46 4.37 -2.09%
Line 91 4.63 4.33 -6.55% 5.25 5.05 -3.89% 4.82 4.54 -5.68%
Line 96 5.03 4.67 -7.13% 2.71 3.02 11.55% 4.33 4.17 -3.63%
TOTAL 4.71 4.42 -6.21% 4.21 4.26 1.14% 4.56 4.37 -4.17%
4.3.Accidents assessment
In the evaluation of the bus priority scheme in terms of accidents, only data from line 91 has been available, split in four segments per direction (i.e. a total of eight route segments). Namely, the numbers of casualties due to road traffic accidents over four-year periods before and after implementation of the priority scheme have been supplied, categorised according to severity (death, serious injury, slight injury) and road user type (pedestrian, cycle, 2-wheeler, 4-wheeler). In addition, average daily vehicle traffic flows have been obtained for the respective segments and periods. The accidents KPI, as expressed by Equation (2), is used to perform a safety assessment of the priority system on line 91, for the different severity categories separately, taking equal weights for each of the route segments. Following a consultation with a group of experts from the Municipality of Paris, the weights for casualties of the different road user groups have been set to wcyc = 0.25, w2w = 0.2, w4w = 0.15, and wped = 0.4 for cycles, 2-wheelers, 4-wheelers and pedestrians respectively.
Table 2. Safety assessment results for bus line 91
IACD
(casualties/million-veh)
Weights Deaths Serious injuries Slight injuries Overall
Before After Before After Before After Before After
Cycles 0.25 0 0 0 2 3 5 0.02 0.05
2-wheelers 0.2 0 0 3 3 71 36 0.40 0.24
4-wheelers 0.15 2 0 0 1 27 20 0.32 0.12
Pedestrians 0.4 1 1 6 11 51 51 0.42 0.50
TOTAL 1 0.07 0.04 0.31 0.63 4.10 3.57 0.30 0.28
[image:10.544.60.488.374.475.2]4.4.Discussion
Given that the introduction of bus priority is a measure primarily aimed at improving public transport mobility, the results obtained from the mobility assessment are in line with what would be expected, i.e. better mobility for public transport without deterioration of private transport mobility, and consequently better overall mobility on all three bus lines. Accidents, on the other hand, appear to have stayed at fairly constant levels as a whole, with the increased index values of serious injuries and pedestrians being largely attributed to the fact that the smaller casualty occurrence numbers of those categories are weighted more heavily than the higher occurrence numbers of slight injuries. It should be noted that the priority measures have also resulted in a drop in vehicle traffic volume along line 91, which may have further contributed to increases in accident index values. Nevertheless, the study highlights a potential “collateral damage” of the bus priority scheme, and it may be worth further investigating the circumstances of the pedestrian casualties in question.
From the point of view of assessing the evaluation framework itself, the results show that the developed KPIs seem to be able to reflect major phenomena while offering an impartial evaluation. It is worthy to note that, in a purely mobility-oriented case study, the new performance evaluation framework not only captures the intended and expected improvement of overall mobility, but also identifies the subtle impact in terms of safety, which potentially requires attention. This demonstrates the applicability and usefulness of the KPIs, thus forming the first step of their validation process.
5.Conclusions
While urban traffic management and ITS are charged with the task of dealing with today’s transport problems in cities, the absence of common evaluation measures prevents objectively assessing the performance of individual policies and technologies, in order to make use of past experience and lessons learnt in the field. Recent European Commission funded research (CONDUITS) has taken a step in this direction and has defined a new performance evaluation framework. This paper has presented two of the developed KPIs for the themes of mobility and traffic accidents, along with their application to a case study the city of Paris, the results of which have demonstrated their relevance and applicability.
Nevertheless, it is recognised that the implementation of the KPIs requires the consideration of several dimensions in order to become an effective tool of decision-making in the field of traffic management and ITS, and therefore work in this direction continues. The next steps will thus concentrate on applying the KPIs to more case studies of different characteristics, so as to continue their validation and parameter fine-tuning. Further work will also focus on the testing and validation of the KPIs for pollution and social inclusion, as well as on the development of new measures and indices.
Acknowledgement
This work has been carried out as part of the CONDUITS (Coordination of Network Descriptors for Urban Intelligent Transport Systems) project (www.conduits.eu), which was funded by the European Commission under the 7th Framework Programme for Research and Development, Theme 7 “Transport
References
Cambridge Systematics Inc. (2000). A guidebook for performance-based transportation planning. NCHRP
report 446. Washington: Transportation Research Board.
Cambridge Systematics Inc., PB Consult Inc. & System Metrics Group (2005). Analytical tools for asset management. NCHRP report 545. Washington: Transportation Research Board.
Cianfano, M., Gentile, G., Nussio, F., Tuffanelli, , G., Rossi, P., Vergini, R. & Terenzi, G. (2011). Transport and mobility indicators based on traffic measures – Good practices guidebook. CITEAIR II Deliverable.
Elvik, R., Høye, A., Vaa, T. & Sørensen, M. (2009). The handbook of road safety measures, Bingley: Emerald Group Publishing Ltd.
European Commission (2001). White paper - 'European transport policy for 2010: time to decide'.
European Commission (2011). White paper - Roadmap to a single European Transport Area - Towards a
competitive and resource efficient transport system.
Kaparias, I., Bell, M. G. H., Eden, N., Gal-Tzur, A., Komar, O., Prato, C. G., Tartakovsky, L., Aronov, B., Zvirin, Y., Gerstenberger, M., Tsakarestos, A., Nocera, S. & Busch, F. (2011). Key Performance Indicators for traffic management and Intelligent Transport Systems. CONDUITS Deliverable 3.5.
Linstone, H. A. & Turrof, M. (1975). The Delphi method - Techniques and applications, Addison-Wesley Publishing Company.
Nijkamp, P., Rienstra, S. & Vleugel, J. (1998). Transportation planning and the future, Chichester: Wiley & Sons.
Organisation for Economic Cooperation and Development (OECD) & Joint Research Centre (JRC) of the European Commission (2008). Handbook on constructing composite indicators – Methodology and user guide.
Poister, T. H. (1997). Performance measurement in state Departments of Transportation. Synthesis of
highway practice 238. Washington: Transportation Research Board.
Reed, M. F., Luettich, R. A., Lamm, L. P. & Humphrey, T. F. (1993). Measuring state transportation program performance. NCHRP report 357. Washington: Federal Highway Administration.
Sheikh, M. , Bokaei, M. N., Alijani, H., Saadatmand, M., Hosseini, S. & Sharahi, I. (2011). Investigating relationship between Consumer Price Index and Producer Price Index and Dividend Per Share. Australian Journal of Business and Management Research, 1, 121-128.
Zavitsas, K., Kaparias, I., & Bell, M. G. H. (2010). Transport problems in cities. CONDUITS Deliverable 1.1.