City, University of London Institutional Repository
Citation:
Velasco, C., Woods, A. T., Marks, L. E., Cheok, A. D. ORCID: 0000-0001-6316-2339 and Spence, C. (2016). The semantic basis of taste-shape associations. PeerJ, 4(e1644), doi: 10.7717/peerj.1644This is the draft version of the paper.
This version of the publication may differ from the final published
version.
Permanent repository link:
http://openaccess.city.ac.uk/19502/Link to published version:
http://dx.doi.org/10.7717/peerj.1644Copyright and reuse: City Research Online aims to make research
outputs of City, University of London available to a wider audience.
Copyright and Moral Rights remain with the author(s) and/or copyright
holders. URLs from City Research Online may be freely distributed and
linked to.
City Research Online: http://openaccess.city.ac.uk/ publications@city.ac.uk
Submitted11 September 2015 Accepted 10 January 2016 Published4 February 2016 Corresponding author Carlos Velasco,
carlos@imagineeringinstitute.org
Academic editor Tifei Yuan
Additional Information and Declarations can be found on page 15
DOI10.7717/peerj.1644
Copyright 2016 Velasco et al.
Distributed under
Creative Commons CC-BY 4.0
The semantic basis of taste-shape
associations
Carlos Velasco1,2
, Andy T. Woods1,3
, Lawrence E. Marks4,5
, Adrian David Cheok2,6 and Charles Spence1
1Crossmodal Research Laboratory, Department of Experimental Psychology, University of Oxford, Oxford, UK
2Imagineering Institute, Iskandar, Malaysia 3Xperiment, UK
4Sensory Information Processing, John B. Pierce Laboratory, New Haven, CT, USA
5School of Public Health and Department of Psychology, Yale University, New Haven, CT, USA 6School of Mathematics, Engineering, and Computer Science, City University, London, UK
ABSTRACT
Previous research shows that people systematically match tastes with shapes. Here, we assess the extent to which matched taste and shape stimuli share a common semantic space and whether semantically congruent versus incongruent taste/shape associations can influence the speed with which people respond to both shapes and taste words. In Experiment 1, semantic differentiation was used to assess the semantic space of both taste words and shapes. The results suggest a common semantic space containing two principal components (seemingly, intensity and hedonics) and two principal clusters, one including round shapes and the taste word ‘‘sweet,’’ and the other including angular shapes and the taste words ‘‘salty,’’ ‘‘sour,’’ and ‘‘bitter.’’ The former cluster appears more positively-valenced whilst less potent than the latter. In Experiment 2, two speeded classification tasks assessed whether congruent versus incongruent mappings of stimuli and responses (e.g., sweet with round versus sweet with angular) would influence the speed of participants’ responding, to both shapes and taste words. The results revealed an overall effect of congruence with congruent trials yielding faster responses than their incongruent counterparts. These results are consistent with previous evidence suggesting a close relation (or crossmodal correspondence) between tastes and shape curvature that may derive from common semantic coding, perhaps along the intensity and hedonic dimensions.
SubjectsPsychiatry and Psychology
Keywords Semantic differentiation, Shapes, Crossmodal correspondences, Tastes, Congruency effects
‘‘She laughed, alaugh sweeterthanhoney, with asound curvingandzigzagging, as if singing’’
(Mo Yan,Ball-Shaped Lightning, cited by Yu, 2003, p. 190)
INTRODUCTION
1Here, we are mainly interested in the way
in which taste/shape correspondences occur in the general population. As a consequence, research on synaesthesia, a rare condition where the stimulation of one sensory modality leads to concurrent sensory experiences in the same or other modalities, falls out of the scope of the present study. It is important to mention, though, that cases of taste-shape synaesthesia have been reported elsewhere (Cytowic, 1993;Cytowic & Wood, 1982).
their curvature (seeCytowic & Wood, 1982;Spence & Deroy, 2014;Spence & Ngo, 2012, for reviews). Over the last few years, researchers, including ourselves, have studied crossmodal (taste-shape) correspondences,1 providing some hints as to their underlying mechanisms (e.g.,Velasco et al., 2015a;Velasco et al., 2016) and their effects on taste (or gustatory) information processing more generally (e.g.,Gal, Wheeler & Shiv, 2007;Liang et al., 2013). Notably, while the way in which people match basic tastes with shapes seems reasonably well understood, the mechanisms that underlie crossmodal correspondences, as revealed in crossmodal (taste-shape) matches and congruency effects in perceptual processing are still to be clarified. In particular, research still needs to clarify when, how, and why the mechanism(s) that underlies taste-shape correspondences may influence the processing of taste (perceptual and linguistic) and shape information.
Velasco and his colleagues have investigated how people match basic tastes and shapes. So, for example, the results of one series of four experiments revealed that people associate sweet (both when presented as a word and as a tastant) with round shapes, and bitter, salty, and sour (as words and tastants) with more angular shapes (Velasco et al., 2015a, see alsoNgo et al., 2013;Velasco et al., 2014;Velasco et al., 2015b;Wan et al., 2014). What is more,Velasco et al. (2015a)also reported that the more the participants liked the taste (but not a taste word), the rounder the shape matched to it (see alsoBar & Neta, 2006, on curved objects preference) and suggested a hedonic mechanism to explain the crossmodal matching (see alsoGhoshal, Boatwright & Malika, 2015). This finding was subsequently replicated byVelasco et al. (2016). The latter researchers found that taste concentration can also affect shape matching, with more versus less intense tastants more likely matched to angular versus round shapes, respectively (see alsoBecker et al., 2011). Given the focus of the present study—on the semantic basis of taste word/shape correspondences, and associated congruence effects—the aforementioned findings are intriguing. Nevertheless, correlations alone do not suffice to show that a hedonic mechanism underpins the correspondences. Moreover, it is important to evaluate a wider range of intensities, given that the authors tested just two concentrations.
The idea that certain crossmodal correspondences may be mediated by the affective properties of the matching or mismatching stimuli is certainly not new (e.g.,Kenneth, 1923; see alsoMarks, 1996, for a review). Indeed, researchers have demonstrated recently that the way in which people match music and colours (Palmer, Langlois & Schloss, 2015;Palmer et al., 2013) and colours and fragrances (Guerdoux, Trouillet & Brouillet, 2014;Schifferstein & Tanudjaja, 2004) can be mediated by emotion. In an earlier study,
Ernst, 2014). Indeed, crossmodal correspondences can provide relevant information to people when they make inferences about the (often) noisy sensory world (Parise, 2015).
Importantly, earlier research also points to the notion that taste/shape correspondences may influence the processing of taste-information. For instance,Liang et al. (2013)
assessed the influence of shapes on people’s sensitivity to sweetness using near-threshold sucrose solutions. In their study, people rated round shapes as more pleasant. Further, presenting a round shape rather than an angular shape before tasting a sweet solution enhanced sweetness sensitivity. Unfortunately, however, this study is the only of its kind, and replication is critical (the effect is certainly specific and small), perhaps using everyday, suprathreshold, solutions. Moreover, there is a possible confound of response bias in the study, asLiang et al. (2013)did not attempt to control for the participants’ response criterion (e.g., apparently they did not include any ‘blank,’ water trials).
Gal, Wheeler & Shiv (2007), reported a study in which their participants were asked to indicate which of three shapes (which could be all round or angular) had the largest surface area before rating a piece of cheddar cheese. The results showed that the curvature of the shapes presented in the first task influenced the perceived sharpness of the cheese, with the angular shapes leading to higher sharpness ratings than the round shapes. What is more, other studies have shown that the shape of a plate and food (when it is round as compared to angular) can influence participants’ sweetness ratings of the food (resulting in people rating the food as tasting sweeter, seeFairhurst et al., 2015;Stewart & Goss, 2013; see alsoPiqueras-Fiszman et al., 2012).
Here it is worth mentioning that, in spite of their perceptual basis, similarities across the senses also surface in language (e.g., see the quote at the beginning of the Intro-duction,Marks, 1978;Marks, 1996). With this in mind, we ask whether the potential hedonic- and intensity-related explanations/mediations of taste/shape correspondences may extend to taste words and, if so, whether they reflect: a perceptual process; a common connotative meaning (Walker, 2012;Walker, Walker & Francis, 2013; see alsoCollier, 1996;
Here, we describe two experiments designed to assess whether shapes and taste words share a common semantic space and whether congruence between them can influence both taste words and shape information processing. Experiment 1 used semantic differentiation (Osgood, Suci & Tannenbaum, 1957) to assess whether taste words and shapes share common dimensions of connotative meaning. Experiment 2 used a speeded classification task to assess whether taste/shape congruence affects the categorization of taste words and shapes. We hypothesized that taste words and shapes share a common semantic space to which previously reported associations will project, and that people will respond faster to the congruent versus incongruent pairings.
EXPERIMENT 1
Methods and materialsParticipants
A total of 102 participants (M age=34.7 years, SD=11.8, age range=19–70, 51 females) took part in the study, online through the Adobe Flash based Xperiment software (http://www.xperiment.mobi). The participants were recruited using Amazon’s Mechanical Turk in exchange for a payment of 1.50 USD (seeWoods et al., 2015, for a methodological overview of internet-based research). All of the participants were based in the USA, and all agreed to take part in the study after reading a standard consent form. The experiment was reviewed and approved by the Central University Research Ethics Committee at the University of Oxford (MS-IDREC-C1-2014-056).
Apparatus and materials
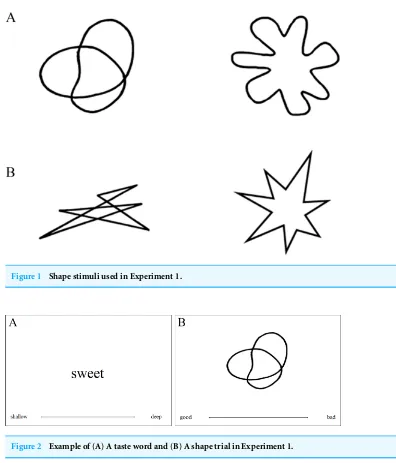
The images of four shapes (previously used byKöhler, 1929;Ramachandran & Hubbard, 2001), two angular and two round (seeFig. 1), as well as four taste words, namely bitter, sour, salty, and sweet, were the stimuli in this study. The taste words were presented in font Times New Roman 80.
Figure 1 Shape stimuli used in Experiment 1.
Figure 2 Example of (A) A taste word and (B) A shape trial in Experiment 1.
Procedure
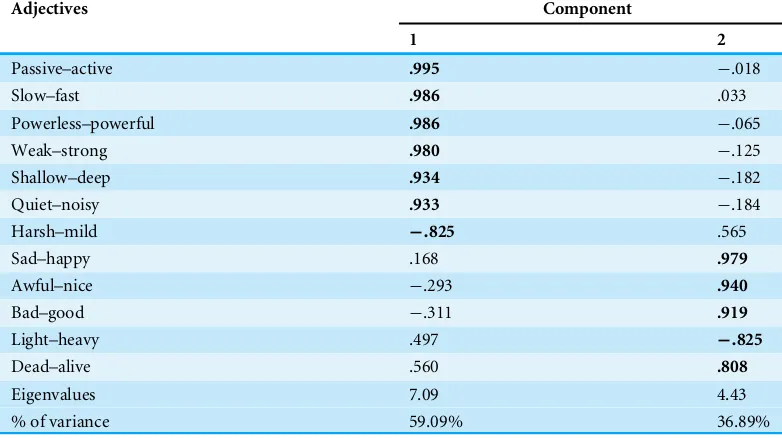
Table 1 Varimax-rotated component matrix in Experiment 1 (see alsoFig. 4).
Adjectives Component
1 2
Passive–active .995 −.018
Slow–fast .986 .033
Powerless–powerful .986 −.065
Weak–strong .980 −.125
Shallow–deep .934 −.182
Quiet–noisy .933 −.184
Harsh–mild −.825 .565
Sad–happy .168 .979
Awful–nice −.293 .940
Bad–good −.311 .919
Light–heavy .497 −.825
Dead–alive .560 .808
Eigenvalues 7.09 4.43
% of variance 59.09% 36.89%
Analysis
A varimax-rotated principal component analysis (PCA) was used to define the principal dimensions arising from the different scale ratings of tastes and shapes. In addition, a hierarchical cluster analysis with Ward’s method and squared Euclidean distance as the similarity measure (seeKaufman & Rousseeuw (2005), for more details) was conducted in order to assess whether the different tastes and shapes would group as a function of common ratings in the scales used in Experiment 1. The aforesaid analyses were performed with IBM SPSS v. 19 and the PCA visualizations were created in the R0(R Core Team, 2015) {FactoMineR} package (seehttp://factominer.free.fr/). The data were aggregated as a function of dimensions and clusters and Wilcoxon signed-rank tests were performed in R, to assess any difference between clusters as a function of dimensions. Effect sizes were calculated by means of Cliff’s Delta as implemented in the {effsize} package in R (seehttps://cran.r-project.org/web/packages/effsize/effsize.pdf), in which 0 indicates the absence of an effect (the distributions overlap), while a value of−1 or 1 indicates a large effect (no overlap whatsoever; seeCliff, 1996).
Results and discussion
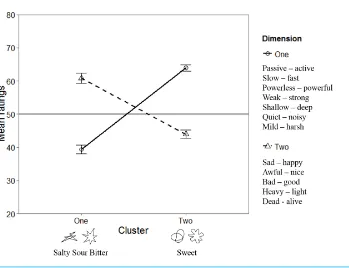
The principal component analysis (PCA, seeFig. 3) revealed that two components had eigenvalues over Kaiser’s criterion of 1 and, in combination, explained 95.98% of the variance.Table 1shows the factor loadings after the varimax (orthogonal) rotation. Note that the first and second components accounted for 59.09% and 36.89% of the variance, respectively.
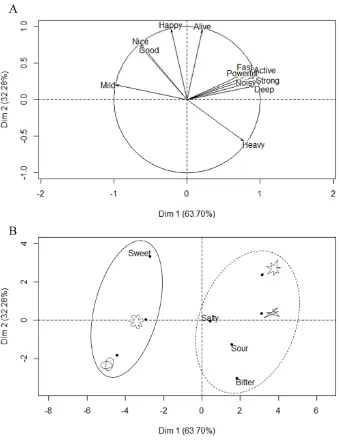
Figure 3 (A) Unrotated factor map of the polar scales in Experiment 1. Note that only the label of the upper end of the scales is presented. (B) Unrotated factor map for the stimuli.The circles grouped the variables as a function of the two clusters identified in the subsequent cluster analysis. Note that given that (A) and (B) show the unrotated visualizations, the percentages for each component vary slightly from those presented inTable 1.
‘‘bitter.’’ These groupings reflect the tendency for stimuli in each cluster to receive similar ratings on the different semantic differential scales.
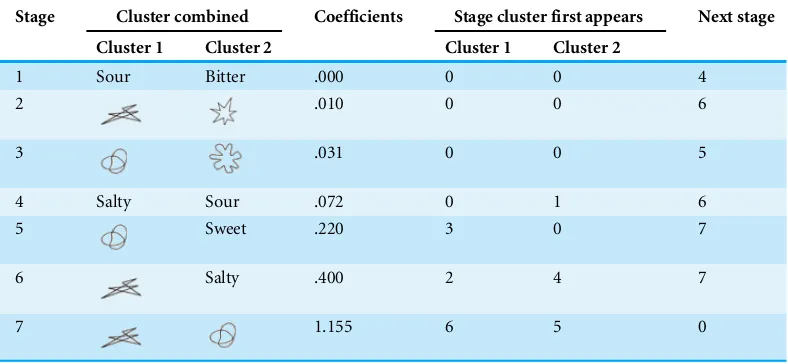
Table 2 Hierarchical cluster analysis in Experiment 1.Note that the distance measure was rescaled to a ∼0–1 range, and that the first large jump occurs between stages four and five.
Stage Cluster combined Coefficients Stage cluster first appears Next stage
Cluster 1 Cluster 2 Cluster 1 Cluster 2
1 Sour Bitter .000 0 0 4
2 .010 0 0 6
3 .031 0 0 5
4 Salty Sour .072 0 1 6
5 Sweet .220 3 0 7
6 Salty .400 2 4 7
7 1.155 6 5 0
first dimension of the stimuli in the second cluster were higher than those in the first cluster (p< .001, Cliff’s Delta=0.96), whereas the ratings on the second dimension of the stimuli in the first cluster were lower than those in the second cluster (p< .001, Cliff’s Delta=0.79). In other words, the round shapes and the taste word ‘‘sweet’’ were rated as more positively-valenced and less intense than the angular shapes and the taste words ‘‘salty,’’ ‘‘sour,’’ and ‘‘bitter.’’
These results provide further support for the presence of an association between the word ‘‘sweet’’ and round shapes and the words ‘‘bitter,’’ ‘‘salty,’’ and ‘‘sour’’ and angular shapes (Velasco et al., 2015a;Velasco et al., 2015b;Velasco et al., 2016). Moreover, the results also suggest that tastes and shapes share a semantic space, or a set of implicit meanings, which is initially characterized by two main components. Indeed, a possibility is that these components reflect the two elements identified byVelasco et al. (2015a)and
Velasco et al. (2016), namely hedonic value and intensity. Consistently, the results of Experiment 1 fall in line with the idea that perceptual dimensions (e.g., sweet vs. sour, and fast vs. slow) differentiate between valence and arousal in specific ways (e.g., positive and negative and high and low arousal, respectively, seeCavanaugh, MacInnis & Weiss, 2015). Two limitations may be mentioned in regard to this study. First, it is possible that blocking by pairs of adjectives may have increased contrast between stimuli in each dimension. Second, the number of shapes included is very limited. This said, the common semantic space between round shapes and angular shapes, as well as their differences, are certainly consistent with previous research using those shapes (Holland & Wertheimer, 1964;Lindauer, 1990;Lyman, 1979).
Figure 4 Dendrogram obtained by means of hierarchical cluster analysis in Experiment 1.
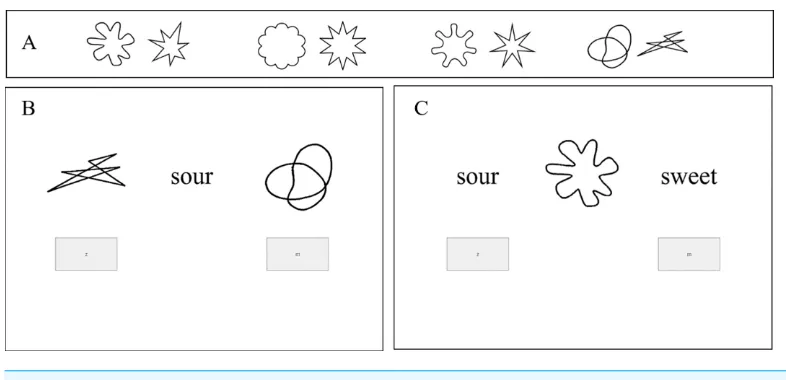
[image:10.612.188.537.387.655.2]Figure 6 (A) The shape stimuli used in both tasks, (B) A trial in the shape response task, and (C) A trial in the taste response task.Note that the shape stimuli are group in pairs as used as responses for the shape response task.
(Liang et al., 2013), that is, by using linguistic taste stimuli. For this purpose, a task was designed in which a larger sample of participants (in order to compensate for potential hardware-related differences across participants and fewer trials, e.g.,Woods et al., 2015) were given congruent or incongruent instructions about the mapping between taste words and shapes and were later asked to respond to shapes or taste words with taste words and shapes, respectively.
EXPERIMENT 2
Methods and materialsParticipants
A total of 253 participants (M age=34.48 years, SD=10.90, age range=18–73 years, 138 females) took part in the study online and received a payment of 1.80 USD. All were based in the USA, and all agreed to take part in the study after reading a standard consent form.
Apparatus and materials
The ten stimuli comprised four pairs of shapes (one round and one angular within each pair, 200×200 pixels each; seeFig. 6A), plus two taste words ‘‘sweet’’ and ‘‘sour.’’ The taste words were again presented in font Times New Roman 80.
Procedure
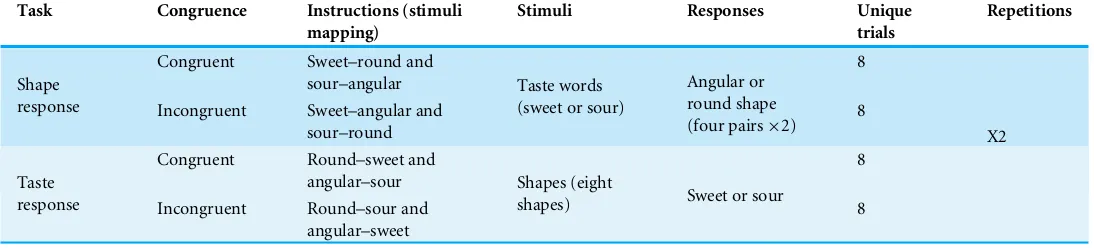
Table 3 Experimental design used in Experiment 2.
Task Congruence Instructions (stimuli
mapping)
Stimuli Responses Unique
trials
Repetitions
Congruent Sweet–round and sour–angular
8 Shape
response Incongruent Sweet–angular and sour–round
Taste words (sweet or sour)
Angular or round shape
(four pairs×2) 8
Congruent Round–sweet and angular–sour
8 Taste
response Incongruent Round–sour and angular–sweet
Shapes (eight
shapes) Sweet or sour 8
X2
That is, each task included a block of congruent trials and a block of incongruent trials. Both task order and block order were randomized across participants. In the congruent (incongruent) block of thetaste response task, the participants were asked to respond with the word sweet every time they saw a round (angular) shape and with the word sour every time they saw an angular (round) shape. In the congruent (incongruent) block of the
shape response task, the participants were instructed to respond with round shapes every time they saw the word sweet (sour), and with angular shapes every time they saw the word sour (sweet). Note, however, that the possible responses were presented to the left or to the right of the target stimulus, and the participants would have to press z or m, a function of the position of the correct response (see below). In both tasks, the participants were instructed to respond as rapidly and accurately as possible to a target stimulus (taste words or shapes) by pressing the key that was associated the stimulus that matched the parings in the instruction (shapes and taste words, respectively).
Table 3summarizes the experimental design. Each of the tasks included eight unique
trials. In theshape response task, half of the trials required of the participants to respond to the word ‘‘sweet’’ and the other half to the word ‘‘sour.’’ Moreover, four trials included the round shapes on the right and the angular on the left (two for ‘‘sweet’’ and two for ‘‘sour’’); in the remaining four trials, the positioning was reversed. In thetaste response task, the participants responded to the eight shapes with words ‘‘sweet’’ and ‘‘sour.’’ The right-left position of ‘‘sweet’’ and ‘‘sour’’ was thus fully counterbalanced.
Analyses
Both accuracy and RTs were analysed as a function of task and congruence. Accuracy and RTs were analysed by means of 2×2 analysis of variance-type statistics (ATS) with the factors of task and congruence. Note that the ANOVA-type statistic, a robust rank-based nonparametric alternative to the classic ANOVA, is robust to both outliers and the violation of assumptions in classical parametric ANOVA (seeErceg-Hurn & Mirosevich, 2008). The analyses were performed in R Statistical Software, as implemented in the {nparLD} package (Noguchi et al., 2012). The significant main effects and interactions were further analysed with the Wilcoxon signed-rank test to which Bonferroni corrections were also applied. Effect sizes were also calculated by means of Cliff’s Delta.
Results and discussion
Accuracy
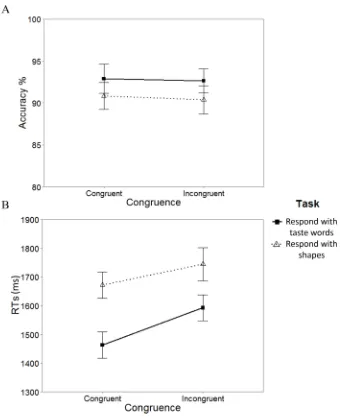
Data from those participants failing to respond accurately on more than 60% of the trials were excluded from the analyses (a total of 14 participants). Whilst there was a significant main effect of task,FATS(1,∞)=15.15,p< .001, the effect of congruence was
not significant,FATS(1,∞)=0.39,p=.530, nor was the interaction between task and
congruence,FATS(1,∞)=1.68,p=.195. Wilcoxon signed-rank test revealed that the
participants were more accurate in the task in which they had to respond with taste words rather than shapes (p=.001, Cliff’s Delta=0.15).Figure 7Asummarizes the results.
RTs
Only the trials in which the participants responded correctly were included in the analyses (91.6% of 15,296 trials). The ANOVA-type statistic revealed a significant effect of task,
FATS(1,∞)=121.31,p< .001, and congruence,FATS(1,∞)=13.71,p< .001. The
interaction between task and congruence was not significant,FATS(1,∞)=3.38,p=
0.066. The participants responded more rapidly in the task in which they responded with taste words rather than with shapes (p< .001, Cliff’s Delta=0.27). Moreover, participants also responded more rapidly on the congruent than the incongruent trials (p< .001, Cliff’s Delta=0.13).
The results of Experiment 2 provide evidence for the idea that taste/shape correspon-dences can indeed produce congruence effects even in the absence of a tastant, but just with shapes and taste words. It is worth mentioning, though, that there was a difference across tasks too: That is, the participants responded more accurately, and more rapidly, in thetaste response taskas compared to theshape response task. Moreover, an overall congruence effect was observed across tasks. The results of Experiment 2 extend previous studies assessing taste/shape congruence (e.g.,Fairhurst et al., 2015;Liang et al., 2013) to taste word/shape congruence.
GENERAL DISCUSSION
Figure 7 Summary of the results of Experiment 2.(A) Accuracy and (B) Mean reaction times (RTs) in both tasks as a function of congruence. The error bars represent the standard error of the means.
congruence effects when linguistic stimuli rather than tastants are used. Experiment 1 revealed that taste words and shapes can share a semantic space, which is mainly characterized by dimensions related to intensity and hedonic value. Moreover, consistent with previous research (Spence & Deroy, 2014, for a review), specific tastes and shapes clustered, ‘‘sweet’’ with round shape and ‘‘bitter,’’ ‘‘salty,’’ and ‘‘sour’’ with angular shape. A limitation of Experiment 1, though, is that only four shapes were used. Nevertheless, the results are consistent with previous research suggesting that the shapes used are distinctively round and angular (e.g., Holland & Wertheimer, 1964;
2This is of particular relevance given
the fact that previous research has documented the importance of some non-semantic features of taste words (e.g., typeface features, seeVelasco et al., 2015b) and/or implicit vocalization, articulation/kinesthesis, and/or sound imagery in conveying meaning (e.g.,Ngo et al., 2013). For example, one may argue that it is not the word ‘‘sweet’’ but rather its sound symbolic meaning, that guides its matching to round shapes. While we cannot rule out all the specific interactions between the aforesaid variables, it is known that tastants and taste words are similarly matched to shapes varying in terms of their curvature (Velasco et al., 2015a).
Experiment 2 introduced a task in which people were instructed to respond either to shapes with taste words or to taste words with shapes, under conditions that defined the stimulus–response relations either congruently (e.g., respond round to ‘‘sweet’’) or incongruently (e.g., respond angular to ‘‘sweet’’). Both task and congruence mattered: First, the participants were more accurate and faster when responding to taste words with shapes than when responding to shapes with taste words. And second, the participants responded more rapidly with congruent as compared to with incongruent pairings of stimuli and responses.
One important question, relating to Experiment 1, is whether the semantic basis of taste words and shapes may also apply to tastants. Research by Velasco et al. (2015a)
demonstrated that the ways in which people match taste words and tastants to shapes follow similar patterns (as might be expected).2 Sweet tends to associate with round shapes whilst bitter, sour, salty, and salty associate with angular shapes. One important direction for future research concerns the evaluation of the semantic space of both taste words and tastants. For example, one could examine the common semantic space for taste words and tastes by running either a semantic differentiation study or a similarity rating experiment on a stimulus set that included both tastes and taste words. Findings ofGallace, Boschin & Spence (2011) with different foods, however, do suggest that foods with specific taste qualities aligned in semantic differential scales (see alsoNgo et al., 2013).
Although the present research focused on taste words and shapes, it is worth considering whether the results would be similar if we had used shape words instead of shapes. Presumably, shape words would operate semantically like shapesper se, at least to the extent that taste words operate semantically like tastes (although in both cases there may be some interesting differences between the connotative meanings of perceptual stimuli and the analogous words, asOsgood, 1960, suggested with colors and color words). In some instances, words may connote ‘prototypes’ that cannot easily be realized in particular stimuli. Such a matter may be an interesting direction for future research.
Nearly two decades ago, Marks (1996)highlighted that ‘‘The correspondences between primary perceptual meanings and secondary linguistic ones need not be perfect—language and perception do not necessarily carve the world up in precisely the same way (cf.Miller & Johnson-Laird, 1976)—but the connections are nevertheless strong’’ (p. 49). The results of Experiment 2 extend previous work on taste/shape associations and taste and shape information processing to taste words and shapes (e.g.,Becker et al., 2011;Gal, Wheeler & Shiv, 2007). As noted before, in the English language, for example, the use of shape-related words such as ‘‘sharp’’ to describe tastes has a long history (Marks, 1978;Williams, 1976;
Yu, 2003). This said, even though the effects found in Experiment 2 were small, so too were earlier taste/shape congruence effects reported with perceptual stimuli (Liang et al., 2013; note, however, that comparing effect sizes across experimental paradigms is not an easy task given their different nature), and these effects prove noteworthy given the seemingly unrelated nature of basic taste words and shapes.
congruent or incongruent). This said, it is reasonable to assert that there is an implicit relation between specific taste words and shape curvature. In other words, participants may find it easier to respond to a learned stimulus mapping that has a stronger (implicit) association than to one that has a weaker association, thus responding faster to the former. How is such an implicit relationship built? The results of Experiment 1, together with those ofVelasco et al. (2015a)andVelasco et al. (2016), provide some clues in support of a hedonic association, and preliminary experimental data for a sensory-discriminative association (see also e.g.,Marks, 1978;Marks, 2013;Parise & Spence, 2013;Spence, 2011, for reviews on possible mechanisms underlying crossmodal correspondences). These ideas are consistent with an affective account of certain associations across the senses (e.g.,Collier, 1996;Palmer et al., 2013). Given that intensity and hedonics are also influenced by other low-level visual properties and shape aesthetic features (e.g.,Palmer, Schloss & Sammartino, 2013), which influence taste/shape correspondences (Salgado-Montejo et al., 2015), it should be reasonable to extend the present results to other visual attributes (e.g., shape symmetry).
The two experiments reported here were conducted online. Even though there is still debate as to the limitations and scope of online research, a number of studies have started to suggest that, in many situations, online research can mimic laboratory results (not to mention the access to larger and more varied samples of participants; see Woods et al., 2015, for a review of perception research online). Nonetheless, the differences in hardware, software, and contexts across online participants may certainly introduce some error (though the larger samples likely compensate, see alsoChetverikov & Upravitelev, in press).
The results of the present study can be of interest to both researchers and practitioners in the context of food and drink design, given that specific stimulus combinations may lead to subtle variations in the processing of taste-related information. Indeed, even though research will be undoubtedly needed, perhaps, by changing the shape of a packaging, plate, or food, it may be possible to influence, for example, the expected and perceived sweetness of foods or drinks without touching their actual concentration (Velasco et al., 2014).
To conclude, people appear to respond differently to tastes and shapes when the mappings are consistent rather than inconsistent with the correspondence—an additional piece of evidence to suggest that taste words and shapes share an abstract semantic network and that the existence of crossmodally shared locations in semantic spaceipso factodefine or characterize crossmodal congruence.
ADDITIONAL INFORMATION AND DECLARATIONS
Funding
The authors received no funding for this work.
Competing Interests
Author Contributions
• Carlos Velasco conceived and designed the experiments, performed the experiments,
analyzed the data, wrote the paper, prepared figures and/or tables, reviewed drafts of the paper.
• Andy T. Woods conceived and designed the experiments, performed the experiments,
analyzed the data, wrote the paper, reviewed drafts of the paper.
• Lawrence E. Marks and Charles Spence conceived and designed the experiments, wrote
the paper, reviewed drafts of the paper.
• Adrian David Cheok reviewed drafts of the paper.
Human Ethics
The following information was supplied relating to ethical approvals (i.e., approving body and any reference numbers):
Central University Research Ethics Committee at the University of Oxford (MS-IDREC-C1-2014-056).
Data Availability
The following information was supplied regarding data availability: The raw data is included in theSupplemental Information.
Supplemental Information
Supplemental information for this article can be found online athttp://dx.doi.org/10.7717/
peerj.1644#supplemental-information.
REFERENCES
Albertazzi L, Canal L, Dadam J, Micciolo R. 2014.The semantics of biological forms.
Perception43:1365–1376DOI 10.1068/p7794.
Bar M, Neta M. 2006.Humans prefer curved visual objects.Psychological Science
17:645–648DOI 10.1111/j.1467-9280.2006.01759.x.
Becker L, Van Rompay TJL, Schifferstein HNJ, Galetzka M. 2011.Tough package,
strong taste: the influence of packaging design on taste impressions and product evaluations.Food Quality and Preference22:17–23
DOI 10.1016/j.foodqual.2010.06.007.
Cavanaugh LA, MacInnis DJ, Weiss AM. 2015.Perceptual dimensions differentiate
emotions.Cognition and Emotion1–16DOI 10.1080/02699931.2015.1070119.
Chetverikov A, Upravitelev P.Online versus offline: the Web as a medium for response
time data collection.Behavior Research Methods. In Press
DOI 10.3758/s13428-015-0632-x.
Cliff N. 1996.Answering ordinal questions with ordinal data using ordinal statistics.
Multivariate Behavioral Research31:331–350 DOI 10.1207/s15327906mbr3103_4.
Collier GL. 1996.Affective synesthesia: extracting emotion space from simple perceptual
stimuli.Motivation and Emotion20:1–32DOI 10.1007/BF02251005.
Cytowic RE, Wood FB. 1982.Synesthesia: II. Psychophysical relations in the synesthesia of geometrically shaped taste and colored hearing.Brain and Cognition1:36–49
DOI 10.1016/0278-2626(82)90005-7.
Erceg-Hurn DM, Mirosevich VM. 2008.Modern robust statistical methods: an easy
way to maximize the accuracy and power of your research.American Psychologist
63:591–601DOI 10.1037/0003-066X.63.7.591.
Fairhurst MT, Pritchard D, Ospina D, Deroy O. 2015.Bouba-Kiki in the plate:
com-bining crossmodal correspondences to change flavour experience.Flavour4:22
DOI 10.1186/s13411-015-0032-2.
Gal D, Wheeler SC, Shiv B. 2007.Cross-modal influences on gustatory perception.
Available at SSRN:ssrn.com/ abstract=1030197.
Gallace A, Boschin E, Spence C. 2011.On the taste of Bouba and ‘‘Kiki’’: an exploration
of word–food associations in neurologically normal participants.Cognitive Neuro-science2:34–46DOI 10.1080/17588928.2010.516820.
Ghoshal T, Boatwright P, Malika M. 2015. Curvature from all angles: an integrative
review and implications for product design. In: Batra R, Seifert C, Brei D, eds.The psychology of design: creating consumer appeal. New York: Routledge 91–105.
Guerdoux E, Trouillet R, Brouillet D. 2014.Olfactory–visual congruence effects stable
across ages: yellow is warmer when it is pleasantly lemony.Attention, Perception, & Psychophysics76:1280–1286DOI 10.3758/s13414-014-0703-6.
Holland MK, Wertheimer M. 1964.Some physiognomic aspects of naming,
or, maluma and takete revisited.Perceptual and Motor Skills19:111–117
DOI 10.2466/pms.1964.19.1.111.
Karwoski TF, Odbert HS, Osgood CE. 1942.Studies in synesthetic thinking: II. The role
of form in visual responses to music.The Journal of General Psychology26:199–222
DOI 10.1080/00221309.1942.10545166.
Kaufman L, Rousseeuw PJ. 2005.Finding groups in data: an introduction to cluster
analysis. Hoboken: John Wiley & Sons.
Kenneth JH. 1923.Mental reactions to smell stimuli.Psychological Review30:77–79
DOI 10.1037/h0068405.
Köhler W. 1929.Gestalt psychology. New York: Liveright.
Liang P, Roy S, Chen ML, Zhang GH. 2013.Visual influence of shapes and semantic
familiarity on human sweet sensitivity.Behavioural Brain Research253:42–47
DOI 10.1016/j.bbr.2013.07.001.
Lindauer MS. 1990.The effects of the physiognomic stimuli taketa and maluma on
the meanings of neutral stimuli.Bulletin of the Psychonomic Society28:151–154
DOI 10.3758/BF03333991.
Lyman B. 1979.Representation of complex emotional and abstract meanings by simple
forms.Perceptual and Motor Skills49:839–842DOI 10.2466/pms.1979.49.3.839.
Marks LE. 1978.The unity of the senses: interrelations among the modalities. New York:
Academic Press.
Marks LE. 1996.On perceptual metaphors.Metaphor and Symbol 11:39–66
Marks LE. 2013. Weak synaesthesia in perception and language. In: Simner J, Hubbard E, eds.The Oxford handbook of synaesthesia. Oxford: Oxford University Press 761–789.
Martino G, Marks LE. 1999.Perceptual and linguistic interactions in speeded
classification: tests of the semantic coding hypothesis.Perception28:903–924
DOI 10.1068/p2866.
Martino G, Marks LE. 2001.Synesthesia: strong and weak.Current Directions in
Psycho-logical Science10:61–65DOI 10.1111/1467-8721.00116.
Miller GA, Johnson-Laird PN. 1976.Language and perception. Cambridge: Belknap
Press.
Ngo MK, Velasco C, Salgado A, Boehm E, O’Neill D, Spence C. 2013.Assessing
cross-modal correspondences in exotic fruit juices: the case of shape and sound symbolism.
Food Quality and Preference28:361–369 DOI 10.1016/j.foodqual.2012.10.004.
Noguchi K, Gel YR, Brunner E, Konietschke F. 2012.nparLD: an R Software Package for
the nonparametric analysis of longitudinal data in factorial experiments.Journal of Statistical Software50:1–23.
Osgood CE. 1960.The cross-cultural generality of visual-verbal synesthetic tendencies.
Behavioral Science5:146–169DOI 10.1002/bs.3830050204.
Osgood CE. 1964.Semantic differential technique in the comparative study of cultures.
American Anthropologist 66:171–200.
Osgood CE, Suci GJ, Tannenbaum PH. 1957.The measurement of meaning. Urbana:
University of Illinois Press.
Palmer SE, Langlois TA, Schloss KB. 2015.Music-to-color associations of
single-line piano melodies in non-synesthetes.Multisensory Research29:157–193
DOI 10.1163/22134808-00002486.
Palmer SE, Schloss KB, Sammartino J. 2013.Visual aesthetics and human preference.
Annual Review of Psychology64:77–107DOI 10.1146/annurev-psych-120710-100504.
Palmer SE, Schloss KB, Xu Z, Prado-León LR. 2013.Music–color associations are
mediated by emotion.Proceedings of the National Academy of Sciences of the United States of America110:8836–8841DOI 10.1073/pnas.1212562110.
Parise CV. 2015.Crossmodal correspondences: standing issues and experimental
guidelines.Multisensory Research29:7–28DOI 10.1163/22134808-00002502.
Parise CV, Knorre K, Ernst MO. 2014.Natural auditory scene statistics shapes human
spatial hearing.Proceedings of the National Academy of Sciences of the United States of America111:6104–6108DOI 10.1073/pnas.1322705111.
Parise C, Spence C. 2013. Audiovisual cross-modal correspondences in the general
population. In: Simner J, Hubbard E, eds.The Oxford handbook of synaesthesia. Oxford: Oxford University Press 790–815.
Piqueras-Fiszman B, Alcaide J, Roura E, Spence C. 2012.Is it the plate or is it the
food? Assessing the influence of the color (black or white) and shape of the plate on the perception of the food placed on it.Food Quality and Preference24:205–208
R Core Team. 2015.R: a language and environment for statistical computing. Vienna: R Foundation for Statistical Computing.Available athttps:// www.R-project.org/.
Ramachandran VS, Hubbard EM. 2001.Synaesthesia–a window into perception,
thought and language.Journal of Consciousness Studies8:3–34.
Salgado-Montejo A, Alvarado J, Velasco C, Salgado CJ, Hasse K, Spence C. 2015. The sweetest thing: the influence of angularity, symmetry, and number of ele-ments on shape-valence and shape-taste matches.Frontiers in Psychology 6:1382
DOI 10.3389/fpsyg.2015.01382.
Schifferstein HNJ, Tanudjaja I. 2004.Visualizing fragrances through colors: the
mediating role of emotions.Perception33:1249–1266DOI 10.1068/p5132.
Spence C. 2011.Crossmodal correspondences: a tutorial review.Attention, Perception, &
Psychophysics73:971–995DOI 10.3758/s13414-010-0073-7.
Spence C, Deroy O. 2014.Tasting shapes: a review of four hypotheses.Theoria et Historia
Scientiarum10:207–238DOI 10.12775/ths-2013-0011.
Spence C, Ngo MK. 2012.Assessing the shape symbolism of the taste, flavour, and
texture of foods and beverages.Flavour 1:12DOI 10.1186/2044-7248-1-12.
Stein BE, ed. 2012.The new handbook of multisensory processing. Cambridge: MIT Press.
Stewart PC, Goss E. 2013.Plate shape and colour interact to influence taste and quality
judgments.Flavour 2:27DOI 10.1186/2044-7248-2-27.
Velasco C, Salgado-Montejo A, Marmolejo-Ramos F, Spence C. 2014.Predictive
packaging design: tasting shapes, typographies, names, and sounds.Food Quality and Preference34:88–95DOI 10.1016/j.foodqual.2013.12.005.
Velasco C, Woods A, Deroy O, Spence C. 2015a.Hedonic mediation of the crossmodal
correspondence between taste and shape.Food Quality and Preference41:151–158
DOI 10.1016/j.foodqual.2014.11.010.
Velasco C, Woods AT, Hyndman S, Spence C. 2015b.The taste of typeface.i-Perception
6:1–10DOI 10.1068/i0697sas.
Velasco C, Woods AT, Liu J, Spence C. 2016.Assessing the role of taste intensity and
hedonics in taste–shape correspondences.Multisensory Research29:209–221
DOI 10.1163/22134808-00002489.
Walker P. 2012.Cross-sensory correspondences and cross talk between dimensions of
connotative meaning: visual angularity is hard, high-pitched, and bright.Attention, Perception, & Psychophysics74:1792–1809DOI 10.3758/s13414-012-0341-9.
Walker L, Walker P.Cross-sensory mapping of feature values in the size-brightness
cor-respondence can be more relative than absolute.Journal of Experimental Psychology: Human Perception and Performance. In Press.
Walker L, Walker P, Francis B. 2013.A common scheme for cross-sensory
correspon-dences across stimulus dimensions.Perception41:1186–1192.
Wan X, Woods AT, Van den Bosch J, McKenzie KJ, Velasco C, Spence C. 2014.
Cross-cultural differences in crossmodal correspondences between basic tastes and visual features.Frontiers in Psychology 5:1365DOI 10.3389/fpsyg.2014.01365.
Williams JM. 1976.Synaesthetic adjectives: a possible law of semantic change.Language
Woods AT, Velasco C, Levitan CA, Wan X, Spence C. 2015.Conducting perception research over the internet: a tutorial review.PeerJ3:e1058 DOI 10.7717/peerj.1058.
Yu N. 2003.Synesthetic metaphor: a cognitive perspective.Journal of Literary Semantics