Technical Note : Development of a 3D Printed Subresolution Sandwich
Phantom for Validation of Brain SPECT Analysis
Ian S Negusa
Dr Robin B Holmesa
Kirsty C Jordanb 5
David A Nashc
Dr Gareth C Thornea
Dr Margaret Saundersa
a Department of Medical Physics and Bioengineering, University Hospitals Bristol NHS
Foundation Trust, United Kingdom
10
b Department of Biomedical Engineering, University of Strathclyde, United Kingdom
c Department of Medical Physics, Portsmouth Hospitals NHS Trust, United Kingdom
Keywords
3D Printing, nuclear medicine, phantoms, quantitative imaging, brain
Abstract Purpose
To make an adaptable, head shaped radionuclide phantom to simulate molecular
imaging of the brain using clinical acquisition and reconstruction protocols. This will allow
20
the characterisation and correction of scanner characteristics, and improve the accuracy
of clinical image analysis, including the application of databases of normal subjects.
Methods:
A fused deposition modelling 3D printer was used to create a head shaped phantom
made up of transaxial slabs, derived from a simulated MRI dataset. The attenuation of
25
the printed polylactide (PLA), measured by means of the Hounsfield unit on CT scanning,
was set to match that of the brain by adjusting the proportion of plastic filament and air
(fill ratio). Transmission measurements were made to verify the attenuation of the printed
slabs. The radionuclide distribution within the phantom was created by adding 99mTc
pertechnetate to the ink cartridge of a paper printer and printing images of gray and white
30
matter anatomy, segmented from the same MRI data. The complete subresolution
sandwich phantom was assembled from alternate 3D printed slabs and radioactive paper
sheets, and then imaged on a dual headed gamma camera to simulate an HMPAO
SPECT scan.
Results: 35
Reconstructions of phantom scans successfully used automated ellipse fitting to apply
attenuation correction. This removed the variability inherent in manual application of
attenuation correction and registration inherent in existing cylindrical phantom designs.
The resulting images were assessed visually and by count profiles and found to be
similar to those from an existing elliptical PMMA phantom.
40
We have demonstrated the ability to create physically realistic HMPAO SPECT
simulations using a novel head-shaped 3D printed subresolution sandwich method
phantom. The phantom can be used to validate all neurological SPECT imaging
applications. A simple modification of the phantom design to use thinner slabs would
45
Introduction
Analysis of regional cerebral blood flow (rCBF) single photon emission computed
tomography (SPECT) is an important part of the assessment of patients with suspected
50
dementia 1. This may be interpreted visually from a series of planar images through the
brain, but this process is relatively insensitive to subtle blood flow loss and is subject to
observer variability2. Computer analysis that fits the image dataset to a standard
geometry and compares it to a ‘normal database’ has been used clinically and in
research. These age matched databases are taken from volunteer controls or a
55
representative normal patient cohort 3–5. Several software packages are available that
allow automated whole-brain analysis of brain SPECT studies 3, 6–8 .
A limitation of SPECT is that different gamma cameras and collimators will yield slightly
different image data for a given distribution of activity. In rCBF SPECT this will both affect
the visual appearance and limit the applicability of normal databases to images acquired
60
on different cameras. In order to characterize, and if necessary correct for, these
variations, a physical phantom can be used that mimics both the radionuclide activity
distribution and the photon attenuation in a patient 9–12. An anthropomorphic phantom will
allow clinically realistic testing of image reconstruction, including attenuation and scatter
correction and resolution recovery.
65
The Hoffman fillable phantom is commercially available and used to model the activity of
gray and white matter 13. However, this has a fixed geometry that, with most versions,
does not include the whole brain. This prevents count normalization to the cerebellum
and makes lesion simulation difficult. In addition the fixed gray and white matter volumes,
and hence relative activity, are not suitable for simulating all scan types. This includes
70
HMPAO SPECT studies of normal function, where the Hoffman phantom’s 4:1 gray to
The subresolution sandwich method (SSM) is derived from the stack phantom design of
Larsson et al. 15 and has been used in previous studies to simulate radionuclide scans of
the human brain using SPECT and PET 8, 16, 17. An SSM phantom is an assembly of 75
individual sheets of paper, separated by slabs of tissue equivalent material, at a distance
of less than half the resolution of the imaging device. Radioactive images are printed on
the paper sheets using a radioactive solution to build a 3D activity distribution. This
method can simulate highly realistic and easily adaptable images for both SPECT and
PET.
80
The construction of existing phantoms from equal sized circular or elliptical sheets of poly
(methyl methacrylate) (PMMA) has limitations 8, 16, 17. The non-anthropomorphic shape is
not physically realistic in terms of gamma ray attenuation and scatter. Additionally,
automated uniform attenuation correction cannot be used, because the edge of the
activity is not the edge of the attenuation. A method was therefore required to produce
85
head shaped tissue equivalent sheets. 3D printing, or additive manufacturing, technology
has been proven able to produce complex distributions of polymers similar to PMMA
from DICOM datasets from CT or MRI 18.
A number of additive manufacturing approaches have been used to create
anthropomorphic phantoms for radionuclide imaging. Fillable phantoms have been
90
produced that overcome many of the limitations of the Hoffman phantom 19 or offer
patient specific organ geometry 20. For PET, a powder deposition printer, with 18F mixed
into the binding resin has been used to create a brain phantom 21. However, there are
disadvantages to these approaches. Resin phantoms with clinical radionuclides have a
very short useful life, while images of liquid filled phantoms may be affected by cold
95
distributions, these approaches are restricted to producing volumes of fixed and largely
uniform activity.
Applying 3D printing to the manufacture of a SSM phantom requires a material that
replicates the radiation attenuation of the head at the emission energy of the radionuclide
100
used. The National Institute of Standards and Technology gives a mass attenuation
coefficient of 0.17 and 0.15 cm2 /g for ICRU brain at 100 and 150 keV respectively 24.
Interpolating and correcting for a density of 1.04 g/cm3 gives an attenuation coefficient of
0.16 cm-1 at 140 keV (99mTc). Iida et al. measured the attenuation for stereo lithography
photopolymer as 0.161 ± 0.006 cm-1 at 140 keV 19. They used a K
2HPO4 solution for the 105
skull. More generally, a range of additive manufacturing materials have been
characterized using CT, showing materials approximating fat, soft tissue and bone 25, 26.
Printers using curable liquid photopolymers have been used to make phantoms
representing breast, lung and soft tissue masses 26–28. Tuning of radiation attenuation
properties has been achieved by doping the binder of a powder deposition printer with
110
NaI 29 and by adjusting the proportions of polymer and air (fill density) in fused deposition
Materials and Methods
A RepRapPro Mendel 3D printer (RepRapPro, Bristol, UK) was purchased in kit form,
115
assembled and calibrated. This was a commercially available example of the open
source RepRap printer, developed at the University of Bath, UK 31. It had one extruder
enabling it to print in a single material. The printer was operated using Pronterface open
source software 32. Individual print (G-code) files were created with Slic3r software
(version 0.9) 33, with a constant fill density set for each print. All 3D printer feedstock, as 120
1.75mm diameter PLA filament, was manufactured and supplied by Faberdashery
(Frome, UK).
The variation of attenuation with fill density was investigated by printing a series of 2cm
cubes at different fill density settings (set in Slic3r). These were scanned on a Siemens
Sensation 16 scanner (Siemens Healthcare, Erlangen, Germany) with a standard axial
125
head protocol (H31 algorithm, 3 mm reconstructed slice width). A single region of interest
was positioned on each image, central to the cube, avoiding the edges, and the
Hounsfield Unit (HU) value and standard deviation recorded. A linear relationship was
seen up to a nominal fill density of 95% (154 HU), with a maximum HU of 164, as shown
in figure 1.
Figure 1 Measured variation of CT Hounsfield Unit with print fill density
The fact that the response is not linear up to a nominal 100% appears to be due, at least
in part, to the extruder feed rate setting, which will be specific to the printer. Excluding the
value at 100% fill density, the following regression equation was calculated at 120 kVp :
135
𝐻𝑈 = (12.2 ± 0.5) ∗ (% 𝑓𝑖𝑙𝑙 𝑑𝑒𝑛𝑠𝑖𝑡𝑦) − (1008 ± 35).
No notable difference in this relationship was seen on a Philips Big Bore CT scanner
(Philips Medical Systems, Best, NL) at 90, 120 or 140 kVp. A fill density of 85% was
chosen to give 30 HU, the value for brain being in the approximate range 20 – 40 HU 34 .
The head volume data to manufacture the phantom was taken from the Brainweb online
140
database of simulated MRI scans 35–38. Subject number 4 was used, which consists of a
head volume including the whole brain but excluding the mouth. A number of software
packages were then used to isolate the head volume, convert this to the required
stereolithography (STL) format and divide the volume into slabs. All tissue voxel values
were set to equal one in MATLAB (MathWorks, Natick, MA). The outline of the volume
145
was then determined in ITK-snap, by automatically segmenting the head volume from the
background 39. The resultant NIfTI file was converted to STL format by creating a
grayscale model of the head volume in 3D Slicer, setting the voxel value threshold to 0.5
40. The slabs, of thickness 4 mm, were then created in netfabb (netfabb, Lupburg,
Germany). Finally Slic3r was used to create the printer instruction G-code for each slab.
150
Print layer height was 0.4mm, except for the first which was 0.3mm to improve adhesion
to the printer bed and reduce overall height to allow for the paper. Each slab of the
phantom was printed, in turn, and labelled.
The narrow beam attenuation coefficient of the printed slabs was estimated by
measuring the transmission with a 99mTc source. An Unfors Raysafe (Billdal, Sweden) Xi 155
containing 4 GBq 99mTc pertechnetate in 4 ml solution. The vial was positioned in an 18
mm thick lead pot with a 10mm diameter hole drilled centrally in the lid. The divergent
beam of photons covered the detector area. The dose rate at the detector was recorded,
and then the 4mm slabs were placed incrementally on top of the lead pot, with the dose
160
rate recorded each time, until a transmission of 40% was measured.
Brain activity distributions were derived from the same simulated MRI scan used to
create the phantom. Grayscale values for gray and white matter were chosen to give a
GM:WM ratio of 2:1, which was validated by counting printed paper samples in a gamma
counter. The resultant images represented 2 x 2 x 4 mm voxels suitable for use in the
165
phantom. An aqueous solution of 4GBq 99mTc pertechnetate in 4 ml volume was added
to the part full ink cartridge of an HP Officejet Pro 8100 printer (Hewlett Packard, Palo
Alto, California) and the images were printed.
The phantom was assembled and held rigid by means of two 5 mm threaded nylon bars
running vertically through holes in each slab. The location of the holes was decided by
170
examining the brain structure to best avoid areas of activity, passing through the
ventricles where possible. Corresponding holes were drilled through the stack of printed
paper sheets prior to assembly. After assembly, excess paper was cut from the
assembled phantom to ensure this did not affect the positioning in the gamma camera.
Filling the printer cartridge, printing the 41 images and assembling the phantom took
175
approximately an hour. A second set of images was printed, on the same day and using
the same printer, and assembled into the elliptical PMMA phantom described by Berthon
17.
Each phantom was imaged on a GE DST XLi dual-headed gamma camera (GE
Healthcare, Little Chalfont, UK) with low-energy high resolution parallel hole collimators.
180
and printed sheets orthogonal to the axis of rotation, using a spirit level to align in the
sagittal and axial planes. Alignment in the coronal plane was judged by eye in the
absence of a laser. Imaging consisted of 128 projections over 360 degrees, using a
zoom of 1.33 to give a pixel size of 3.38 mm. The time per projection was calculated from
185
a static measure of count rate to give a total of 5 million counts for the acquisition.
Reconstruction with attenuation correction was carried out in two stages. An initial filtered
back-projection reconstruction was used to fit an ellipse to the edge of the brain on a
slice-by-slice basis. For the 3D printed head shaped phantom, this process was
automated, as is the clinical routine for this institution. For the elliptical PMMA phantom,
190
the size of the ellipse was set manually using GE Vision software by visual identification
of the partial ring of activity from a printed paper sheet wrapped around the back of the
phantom. The resulting set of ellipses for each phantom was used to apply a uniform
attenuation correction in the second reconstruction. Typically used attenuation
coefficients for water at 140 keV are 0.15 cm-1 (narrow beam) and 0.12 cm-1 (broad 195
beam)41. However, 0.112 cm-1 (broad beam) had previously been shown to give optimal
image uniformity for uniform activity phantom measurements on this camera42. A nominal
broad beam attenuation coefficient of 0.112 cm-1 was set for both phantoms.
The second filtered back-projection for each phantom used a ramp filter on 128 x 128
matrices, with an isotropic voxel size of 3.38 mm. The spatial resolution (full width half
200
maximum) was previously demonstrated to be 10 mm on reconstructed cuts 16. A 10 mm
smoothing filter was applied to reduce visible noise.
For image presentation, each set of images was registered to the source (paper printing
template) data in SPM8 43, and counts globally scaled in MATLAB to give a mean count
for the brain of 100. This gave axial, coronal and (para)sagittal views, along the same
205
the printer grayscale vs. activity response, smoothed, and presented in the same format.
Count profiles were taken for each of the 3DP phantom, elliptical phantom and source
data images, along two lines left to right through the front and rear of a mid brain axial
slice.
Results
The narrow beam attenuation coefficient of the printed slabs was taken from an
exponential fit of 11 transmission measurements plotted against cumulative thickness in
Microsoft Excel, and found to be 0.167 cm-1 (R2= 0.997). The mean thickness of the
slabs, measured from an assembled stack of 20, was 3.90 ± 0.05 mm. The mean
215
thickness of a sheet of A4 office paper (80 gsm), again measured from a stack of 20
sheets, was 0.10 mm, giving an assembled slice thickness of the slabs and paper of 4
mm. The attenuation coefficient of paper was not assessed but has a nominal density of
0.8 gcm-3, indicating a lower attenuation than soft tissue. The mean thickness of
individual slabs was 3.78 ± 0.15 mm, indicating that imperfections in the top surface are
220
leading to air gaps of approximately 0.1 mm. Using the measured slab thicknesses gave
0.172 cm-1 for the printed material (R2= 0.998).
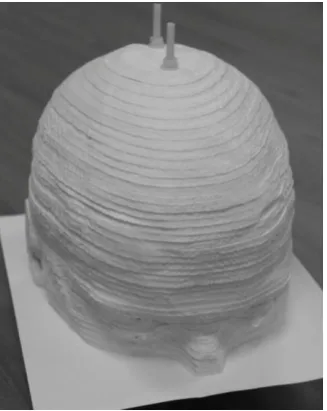
[image:12.595.110.274.430.636.2]The assembled subresolution sandwich (SSM) phantom is shown in figure 2.
Figure 2 The assembled SSM phantom. A single sheet of paper is shown. When
225
assembled for imaging, printed brain activity distributions on paper are placed
This illustrates the 3.9 mm thick PLA slabs and the threaded nylon bars that hold it
together. Fully assembled, the phantom has a sheet of paper, with the corresponding
anatomical activity distribution printed in radioactive ink, sandwiched between each slab.
230
For clarity, a single sheet of paper is shown between the two most caudal slabs to
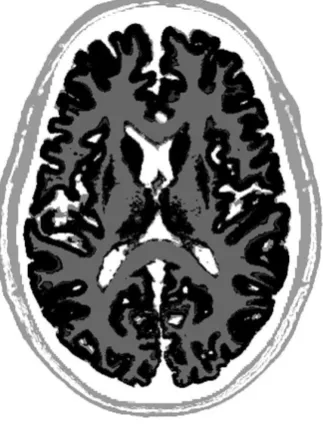
demonstrate the SSM principle. Figure 3 shows the grayscale image of activity printed on
[image:13.595.114.276.243.457.2]paper in a midbrain axial slice.
Figure 3 An example grayscale image for printing on paper
235
Gray matter appears black, and was calibrated to have twice the activity density as the
white matter, which appears gray in the image. Printed activity outside the brain
approximates uptake in areas including the scalp.
The assembled 3D printed anthropomorphic phantom was imaged and example
reconstructed images are shown in figure 4.
Figure 4 Coronal, sagittal and axial reconstructed slices from the anthropomorphic
3D printed phantom
Coronal, sagittal and axial planes are shown, clockwise from top left. The positions of the
displayed orthogonal planes are marked, and are clearly shown on the source data
245
images in figure 6.
As described above, the same paper printed distributions were assembled into an
elliptical PMMA phantom. Figure 5 shows the reconstructed coronal, sagittal and axial
images from the elliptical phantom.
Figure 5 Coronal, sagittal and axial reconstructed slices from the elliptical PMMA
phantom. The arrow shows the position of the additional activity to delineate the
edge of the phantom
The image planes are at the same positions. Figure 5 also shows, arrowed, an additional
sheet of paper, with radioactive ink, taped to the back of the elliptical phantom, required
255
to delineate the phantom outline when manually applying attenuation correction. The
sagittal image shows that this sheet of paper distorted when the phantom was
positioned, which is a potential source of error in the technique. For comparison, the
source data used to create the radioactive ink distribution is presented in the same
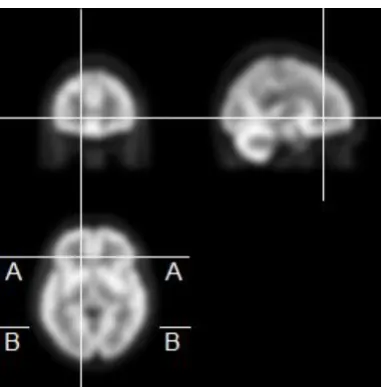
format in figure 6.
[image:15.595.109.302.344.538.2]260
Figure 6 Coronal, sagittal and axial slices from the smoothed source data. The
lines A-A and B-B show the position of the count profiles through the axial slice.
This shows, as continuous lines, the positions of the displayed image planes. Also shown
are the positions of the count profiles, taken along the lines A-A and B-B through the
265
displayed axial slice for each phantom and the source data.
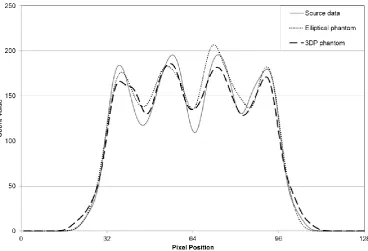
Figure 7 shows count profiles for the 3D printed phantom, elliptical phantom and source
270
Figure 7 Count profiles along the line A-A
The count profiles along the corresponding line B-B, left to right across the rear of the
brain are shown in figure 8.
Figure 8 Count profiles along the line B-B
[image:16.595.83.452.427.678.2]Discussion
A head shaped SSM phantom was constructed in a tissue equivalent material using
a fused deposition modelling (FDM) 3D printer. Reconstructions of the phantom
scans successfully used automated ellipse fitting to apply attenuation correction.
280
This removes the variability inherent in manual application of attenuation correction
and registration inherent in existing cylindrical phantom designs. Count profiles
through the resulting images showed a similar resolution of areas of low and high
activity to an existing elliptical PMMA phantom17. While figure 7 appears to show
better differentiation of a low activity area to the left, no such difference is seen in
285
figure 8. The anthropomorphic phantom will give more realistic absorption and
scatter than an elliptical cylinder, but images with much higher counts would be
required to adequately determine the difference between the phantoms. The
demonstrated advantage of the phantom on a gamma camera without measured
attenuation or scatter correction, is that clinical reconstruction and image processing
290
can be applied to all stages in the phantom simulation.
Many SPECT and PET scanners apply more advanced corrections for attenuation
(often utilising CT data), scatter and resolution. Characterising these scanners
requires phantoms that reflect the geometry of the patient. Joshi et al. showed that
the cylindrical Hoffman phantom did not adequately correct for inter-scanner
295
differences in FDG PET imaging 44. This was in part due to the cylindrical shape, and
the lack of both a skull and scattering material in the neck. Secondly, corrections
derived from a single phantom may not apply to the range of patient’s heads size.
The need for a realistic anthropomorphic phantom to correct for inter-scanner
differences is likely to be more pronounced for SPECT, due to differences in physical
300
The measured narrow beam attenuation coefficient of the slabs in an assembled
stack was 0.167 cm-1, which is very similar to the clinical whole head attenuation
measurements by Iida at 0.166 cm-1 45, but slightly higher than that of brain at 0.16
cm-1 24. This is satisfactory, considering that CT was used to predict the required print 305
density, but there are several sources of error in the estimate. Attenuation
measurements did not include the paper sheets which account for 2.5% of the
thickness of the assembled phantom and have a lower density than the PLA slabs.
Non uniformity in attenuation will have been caused by the thinner (and denser) first
print layer, and by the observed imperfections in the slab top surface; the bottom of
310
each slab, having been melted onto the glass printer bed, is flat but the top could be
sanded smooth. An additional threaded rod may be required to keep the phantom
rigid, as the friction between layers would be lower. Measurements of HU by CT
showed attenuation varies linearly with print density so the attenuation, based on
measurements with paper in situ, could be adjusted in subsequent prints.
315
The use of the print fill density to introduce air between the extruded threads of
polymer and adjust the attenuation properties is suitable for imaging by SPECT or
PET. The resolution for both modalities is much less than the scale of the extruded
threads. A modified phantom for PET would ideally tune the material attenuation to
match the head at 511 keV, with slabs of approximately 2 mm thickness. However,
320
for FDM to be realistic at the sub mm scale, e.g. for CT, it is envisaged that modified
or novel printer feedstock materials would be required, printed at 100% fill.
Further realism in the attenuation properties of the phantom could be achieved by
adjusting the 3D printed material distribution. The software (Slic3r) that we used to
produce the printer instructions (G-code) does not allow for continuously varying fill
325
approach is use the facility in Slic3r to superimpose an additional object (STL file) as
a ‘modifier mesh’ with a different fill density. Alternatively up to three objects can be
combined into one print, with a different extruder printing each volume. This gives
the potential for adjusting flow rate and/or using different feedstock materials. The
330
realism of the phantom could be improved by modelling the skull in a higher
attenuation material 44, 46 and future work will look to develop this.
A disadvantage of the FDM technique is that it is relatively time consuming; each of
the 42 slabs took 3 to 4 hours to print, with approximately 30 minutes required for
cooling. While a small reduction in print time may be possible by optimising settings,
335
it was found that a faster extrusion rate can give uneven prints. This restriction is
inherent to the FDM printing method. The use of a commercial rather than kit built
FDM printer could save time in calibration and adjustment, and better ensure reliable
unattended operation, at the cost of limiting options for multiple extruders with
different materials.
340
Functional brain imaging using PET and SPECT is widely used in the diagnosis and
characterisation of a number of different brain disorders including dementia 5, 47–49,
epilepsy 50–52, movement disorders 53–55 and stroke 56, 57. Functional imaging is
generally used in conjunction with structural neuroimaging and it is apparent that the
accuracy and reliability of imaging used in research studies and in the clinic is
345
improved by the application of increasingly sophisticated post-processing. For tests
involving serial scanning of the same patient (such as epilepsy and stroke) it is
important that the optimal acquisition and reconstruction are used for all scans and
that the co-registration and scaling of scans is carried out accurately.
A number of different multi-centre studies have used FDG PET and DaTscan
350
Initiative (ADNI) and the Parkinson’s Progression Marker Initiative (PPMI) studies,
both of which have used fillable phantoms to minimise inter-scanner differences44, 58.
Further validation of multi-centre studies could be gained by quantifying
inter-scanner variation of the detectability of simulated disease states. The elliptical SSM
355
phantom has been used to investigate differences in detectability of cold lesions in
simulated HMPAO SPECT scans between gamma cameras 59, 60. It has also been
applied to PET, to simulate higher activity tumour uptake 17. The 3D printed
anthropomorphic SSM phantom developed in this work has the potential to improve
characterisation of intra and inter-scanner variation in these applications.
Conclusions
It is important to quantify how accurately SPECT or PET scanners image the
distribution of radionuclide within a patient, particularly when techniques are used to
compare with previous images of that patient or with images of other patients or
365
controls. Correction of images based on the characterisation of scanner systems will
minimise variability between scanners and reconstruction software, and potentially
enable detection of more subtle disease indications through existing and new
techniques. Studies of the differing imaging characteristics of SPECT and PET
scanners are limited due to difficulty in extracting reliable findings from the
370
comparison of inherently variable human scanning, the lack of applicability of
software simulation and the lack of realism of existing physical phantoms.
By using fused deposition modelling (3D printing) we have overcome a major
limitation of existing emission tomography head phantoms. The tissue equivalence
and anthropomorphic shape, derived from an MRI DICOM data set, enables
375
automated attenuation correction routines to be applied to phantom scans.
Improvements to the utility of the phantom would come from the addition of a skull
and from thinner slabs to enable characterisation of PET imaging. Because the SSM
phantom technique enables finely variable concentrations of radionuclide activity
through grayscale printing on paper, it is more adaptable and more easily
380
representative of complex clinical scans than fillable or cast phantoms. It is therefore
suitable for clinically realistic comparisons of scanner response and for validation of
numerical techniques to compare scans with normal databases for both SPECT and
References
1 J.M. Yeo, X. Lim, Z. Khan, and S. Pal, “Systematic review of the diagnostic
utility of SPECT imaging in dementia.,” Eur. Arch. Psychiatry Clin. Neurosci.
263(7), 539–52 (2013).
2 K.J. Van Laere, J. Warwick, J. Versijpt, I. Goethals, K. Audenaert, B. Van
Heerden, and R. Dierckx, “Analysis of clinical brain SPECT data based on
anatomic standardization and reference to normal data: an ROC-based
comparison of visual, semiquantitative, and voxel-based methods,” J Nucl Med
43(4), 458–469 (2002).
3 C. Huang, L.-O. Wahlund, O. Almkvist, D. Elehu, L. Svensson, T. Jonsson, B.
Winblad, and P. Julin, “Voxel- and VOI-based analysis of SPECT CBF in
relation to clinical and psychological heterogeneity of mild cognitive impairment,” Neuroimage 19(3), 1137–1144 (2003).
4 H. Matsuda, S. Mizumura, T. Nagao, T. Ota, T. Iizuka, K. Nemoto, M. Kimura,
A. Tateno, A. Ishiwata, I. Kuji, H. Arai, and A. Homma, “An easy Z-score imaging system for discrimination between very early Alzheimer’s disease and controls using brain perfusion SPECT in a multicentre study,” Nucl Med
Commun 28(3), 199–205 (2007).
5 M. Basely, M. Ceccaldi, L. Boyer, O. Mundler, and E. Guedj, “Distinct patterns
of medial temporal impairment in degenerative dementia: a brain SPECT perfusion study in Alzheimer’s disease and frontotemporal dementia,” Eur J
Nucl Med Mol Imaging 40(6), 932–942 (2013).
6 E. Imabayashi, H. Matsuda, T. Asada, T. Ohnishi, S. Sakamoto, S. Nakano,
and T. Inoue, “Superiority of 3-dimensional stereotactic surface projection
analysis over visual inspection in discrimination of patients with very early Alzheimer’s disease from controls using brain perfusion SPECT,” J Nucl Med
45(9), 1450–1457 (2004).
7 H. Matsuda, S. Mizumura, T. Nagao, T. Ota, T. Iizuka, K. Nemoto, M. Kimura,
controls using brain perfusion SPECT in a multicentre study.,” Nucl. Med.
Commun. 28(3), 199–205 (2007).
8 K.J. Van Laere, J. Versijpt, M. Koole, S. Vandenberghe, P. Lahorte, I.
Lemahieu, and R.A. Dierckx, “Experimental performance assessment of SPM
for SPECT neuroactivation studies using a subresolution sandwich phantom design.,” Neuroimage 16(1), 200–16 (2002).
9 L.R. Barnden, R.L. Hatton, S. Behin-Ain, B.F. Hutton, and E.A. Goble,
“Optimisation of brain SPET and portability of normal databases,” Eur J Nucl
Med Mol Imaging 31(3), 378–387 (2004).
10 K. Van Laere, M. Koole, J. Versijpt, S. Vandenberghe, B. Brans, Y. D’Asseler,
O. De Winter, A. Kalmar, and R. Dierckx, “Transfer of normal 99mTc-ECD brain SPET databases between different gamma cameras,” Eur J Nucl Med
28(4), 435–449 (2001).
11 H. Matsuda, S. Mizumura, T. Soma, and N. Takemura, “Conversion of brain
SPECT images between different collimators and reconstruction processes for analysis using statistical parametric mapping,” Nucl Med Commun 25(1), 67–
74 (2004).
12 N.D. Smith, R.B. Holmes, M. Soleimani, M.J. Evans, S.C. Cade, and C.N.
Mitchell, “Towards adapting a normal patient database for SPECT brain perfusion imaging,” Inverse Probl. 28(6), (2012).
13 E.J. Hoffman, P.D. Cutler, W.M. Digby, and J.C. Mazziotta, “3-D phantom to
simulate cerebral blood flow and metabolic images for PET,” IEEE Trans. Nucl.
Sci. 37(2), 616–620 (1990).
14 R. Wirestam, L. Andersson, L. Ostergaard, M. Bolling, J.P. Aunola, A.
Lindgren, B. Geijer, S. Holtas, and F. Stahlberg, “Assessment of regional
cerebral blood flow by dynamic susceptibility contrast MRI using different deconvolution techniques,” Magn Reson Med 43(5), 691–700 (2000).
15 S.A. Larsson, C. Jonsson, M. Pagani, L. Johansson, and H. Jacobsson,
“Original article A novel phantom design for emission tomography emission tomography imaging,” Eur. J. Nucl. Med. 27(2), 131–139 (2000).
HMPAO SPECT images using a subresolution sandwich phantom.,”
Neuroimage 81, 8–14 (2013).
17 B. Berthon, C. Marshall, R. Holmes, and E. Spezi, “A novel phantom technique
for evaluating the performance of PET auto-segmentation methods in delineating heterogeneous and irregular lesions,” EJNMMI Phys. 2(1), 13 (2015).
18 F. Rengier, A. Mehndiratta, H. von Tengg-Kobligk, C.M. Zechmann, R.
Unterhinninghofen, H.-U. Kauczor, and F.L. Giesel, “3D printing based on imaging data: review of medical applications.,” Int. J. Comput. Assist. Radiol.
Surg. 5(4), 335–41 (2010).
19 H. Iida, Y. Hori, K. Ishida, E. Imabayashi, H. Matsuda, M. Takahashi, H.
Maruno, A. Yamamoto, K. Koshino, J. Enmi, S. Iguchi, T. Moriguchi, H. Kawashima, and T. Zeniya, “Three-dimensional brain phantom containing bone and grey matter structures with a realistic head contour.,” Ann. Nucl.
Med. 27(1), 25–36 (2013).
20 J.I. Gear, C. Long, D. Rushforth, S.J. Chittenden, C. Cummings, and G.D.
Flux, “Development of patient-specific molecular imaging phantoms using a 3D printer,” Med. Phys. 41(8), 082502 (2014).
21 M.A. Miller and G.D. Hutchins, “Development of Anatomically Realistic PET
and PET / CT Phantoms with Rapid Prototyping Technology,” in 2007 IEEE
Nucl. Sci. Symp. Conf. Rec.(2007), pp. 4252–4257.
22 P.G. Hillel and D.L. Hastings, “The effect of phantom wall thickness on volume
determination in SPET,” Nucl. Med. Commun. 16, 1034–1040 (1995). 23 B. Berthon, C. Marshall, A. Edwards, M. Evans, and E. Spezi, “Influence of
cold walls on PET image quantification and volume segmentation: A phantom study,” Med. Phys. 40(8), 082505 (2013).
24 J.H. Hubbell and S. M. Seltzer, Tables of X-Ray Mass Attenuation Coefficients
and Mass Energy-Absorption Coefficients from 1 keV to 20 MeV for Elements Z = 1 to 92 and 48 Additional Substances of Dosimetric Interest,
http://www.nist.gov/pml/data/xraycoef/index.cfm . Accessed : 28 Jan 2016.
characterisation of additive manufacturing materials.,” Med. Eng. Phys. 33(5), 590–6 (2011).
26 J. Solomon and E. Samei, “Quantum noise properties of CT images with
anatomical textured backgrounds across reconstruction algorithms: FBP and SAFIRE.,” Med. Phys. 41(9), 091908 (2014).
27 A.-K. Carton, P. Bakic, C. Ullberg, H. Derand, and A.D.A. Maidment,
“Development of a physical 3D anthropomorphic breast phantom.,” Med. Phys.
38(2), 891–6 (2011).
28 N. Kiarashi, A.C. Nolte, G.M. Sturgeon, W.P. Segars, S. V Ghate, L.W. Nolte,
E. Samei, and J.Y. Lo, “Development of realistic physical breast phantoms matched to virtual breast phantoms based on human subject data.,” Med.
Phys. 42(7), 4116–26 (2015).
29 T.S. Yoo, T. Hamilton, D.E. Hurt, J. Caban, D. Liao, and D.T. Chen, “Toward
quantitative X-ray CT phantoms of metastatic tumors using rapid prototyping technology,” in 2011 IEEE Int. Symp. Biomed. Imaging From Nano to
Macro(IEEE, 2011), pp. 1770–1773.
30 J. Madamesila, P. McGeachy, J.E. Villarreal Barajas, and R. Khan,
“Characterizing 3D printing in the fabrication of variable density phantoms for quality assurance of radiotherapy,” Phys. Medica (2015).
31 R. Jones, P. Haufe, E. Sells, P. Iravani, V. Olliver, C. Palmer, and A. Bowyer,
“RepRap – the replicating rapid prototyper,” Robotica 29(01), 177–191 (2011). 32 pronterface, http://www.pronterface.com/ . Accessed : 28 Jan 2016.
33 Slic3r, www.slic3r.org . Accessed : 28 Jan 2016.
34 A.A. Konstas, G. V Goldmakher, T.-Y. Lee, and M.H. Lev, “Theoretic basis and
technical implementations of CT perfusion in acute ischemic stroke, part 2: technical implementations.,” AJNR. Am. J. Neuroradiol. 30(5), 885–92 (2009).
35 C.A. Cocosco, V. Kollokian, R.K.S. Kwan, and A.C. Evans, “BrainWeb: Online
Interface to a 3D MRI Simulated Brain Database,” in NeuroImage - Proc. 3rd Int. Conf. Funct. Mapp. Hum. Brain(1997), p. S425.
and A.C. Evans, “Design and construction of a realistic digital brain phantom.,”
IEEE Trans. Med. Imaging 17(3), 463–8 (1998).
37 R. K. Kwan, A.C. Evans, and G.B. Pike, “An Extensible MRI Simulator for
Post-Processing Evaluation,” in Lect. Notes Comput. Sci. - Vis. Biomed.
Comput.(Springer-Verlag, 1996), pp. 135–140.
38 R.K. Kwan, A.C. Evans, and G.B. Pike, “MRI simulation-based evaluation of
image-processing and classification methods.,” IEEE Trans. Med. Imaging
18(11), 1085–97 (1999).
39 P. Yushkevich, J. Piven, H.C. Hazlett, R.G. Smith, S. Ho, J.C. Gee, and G.
Gerig, “User-guided 3D active contour segmentation of anatomical structures: significantly improved efficiency and reliability.,” Neuroimage 31(3), 1116–28
(2006).
40 A. Fedorov, R. Beichel, J. Kalpathy-Cramer, J. Finet, J.-C. Fillion-Robin, S.
Pujol, C. Bauer, D. Jennings, F. Fennessy, M. Sonka, J. Buatti, S. Aylward, J. V Miller, S. Pieper, and R. Kikinis, “3D Slicer as an image computing platform for the Quantitative Imaging Network.,” Magn. Reson. Imaging 30(9), 1323–41
(2012).
41 S.R. Cherry, J.A. Sorenson, and M.E. Phelps, Physics in Nuclear Medicine,
4th ed. (Elsevier Saunders, Philadelphia, 2012).
42 R.B. Holmes, Analysis of Functional Neuroimaging (University of Bristol,
2011).
43 SPM, http://www.fil.ion.ucl.ac.uk/spm/ . Accessed : 19 May 2016.
44 A. Joshi, R.A. Koeppe, and J.A. Fessler, “Reducing between scanner
differences in multi-center PET studies,” Neuroimage 46(1), 154–159 (2009). 45 H. Iida, Y. Narita, H. Kado, A. Kashikura, S. Sugawara, Y. Shoji, T. Kinoshita,
T. Ogawa, and S. Eberl, “Effects of scatter and attenuation correction on quantitative assessment of regional cerebral blood flow with SPECT.,” J. Nucl.
Med. 39(1), 181–189 (1998).
46 R.Z. Stodilka, B.J. Kemp, F.S. Prato, and R.L. Nicholson, “Importance of bone
47 A. Swan, B. Waddell, G. Holloway, T. Bak, S. Colville, Z. Khan, and S. Pal,
“The diagnostic utility of 99mTc-HMPAO SPECT imaging: a retrospective case series from a tertiary referral early-onset cognitive disorders clinic.,” Dement.
Geriatr. Cogn. Disord. 39(3-4), 186–93 (2015).
48 R.K.J. Brown, N.I. Bohnen, K.K. Wong, S. Minoshima, and K.A. Frey, “Brain
PET in suspected dementia: patterns of altered FDG metabolism.,”
Radiographics 34(3), 684–701 (2014).
49 T. Yamane, Y. Ikari, T. Nishio, K. Ishii, T. Kato, K. Ito, D.H.S. Silverman, M.
Senda, T. Asada, H. Arai, M. Sugishita, and T. Iwatsubo, “Visual-statistical
interpretation of (18)F-FDG-PET images for characteristic Alzheimer patterns
in a multicenter study: inter-rater concordance and relationship to automated quantitative evaluation.,” AJNR. Am. J. Neuroradiol. 35(2), 244–9 (2014).
50 K. Jafari-Khouzani, K. Elisevich, K.C. Karvelis, and H. Soltanian-Zadeh,
“Quantitative multi-compartmental SPECT image analysis for lateralization of temporal lobe epilepsy,” Epilepsy Res 95(1-2), 35–50 (2011).
51 N.J. Kazemi, G.A. Worrell, S.M. Stead, B.H. Brinkmann, B.P. Mullan, T.J.
O’Brien, and E.L. So, “Ictal SPECT statistical parametric mapping in temporal lobe epilepsy surgery,” Neurology 74(1), 70–76 (2010).
52 D. Pustina, B. Avants, M. Sperling, R. Gorniak, X. He, G. Doucet, P. Barnett,
S. Mintzer, A. Sharan, and J. Tracy, “Predicting the laterality of temporal lobe epilepsy from PET, MRI, and DTI: A multimodal study,” NeuroImage Clin. 9, 20–31 (2015).
53 M. Sudmeyer, C. Antke, T. Zizek, M. Beu, S. Nikolaus, L. Wojtecki, A.
Schnitzler, and H.-W. Muller, “Diagnostic Accuracy of Combined FP-CIT,
IBZM, and MIBG Scintigraphy in the Differential Diagnosis of Degenerative Parkinsonism: A Multidimensional Statistical Approach,” J. Nucl. Med. 52(5), 733–740 (2011).
54 K. Van Laere, C. Casteels, L. De Ceuninck, B. Vanbilloen, A. Maes, L.
Mortelmans, W. Vandenberghe, A. Verbruggen, and R. Dom, “Dual-tracer
dopamine transporter and perfusion SPECT in differential diagnosis of
55 S. Thobois, M. Jahanshahi, S. Pinto, R. Frackowiak, and P. Limousin-Dowsey,
“PET and SPECT functional imaging studies in Parkinsonian syndromes: from the lesion to its consequences,” Neuroimage 23(1), 1–16 (2004).
56 J.T. Whisenant, Y. Kadkhodayan, D.T. Cross, C.J. Moran, and C.P. Derdeyn,
“Incidence and mechanisms of stroke after permanent carotid artery occlusion following temporary occlusion testing.,” J. Neurointerv. Surg. (2014).
57 M. Yamauchi, E. Imabayashi, H. Matsuda, J. Nakagawara, M. Takahashi, E.
Shimosegawa, J. Hatazawa, M. Suzuki, H. Iwanaga, K. Fukuda, K. Iihara, and H. Iida, “Quantitative assessment of rest and acetazolamide CBF using
quantitative SPECT reconstruction and sequential administration of (123)I-iodoamphetamine: comparison among data acquired at three institutions.,”
Ann. Nucl. Med. 28(9), 836–50 (2014).
58 K. Marek, D. Jennings, S. Lasch, A. Siderowf, C. Tanner, T. Simuni, C. Coffey,
K. Kieburtz, E. Flagg, S. Chowdhury, W. Poewe, B. Mollenhauer, T. Sherer, M.
Frasier, C. Meunier, A. Rudolph, C. Casaceli, J. Seibyl, S. Mendick, N. Schuff, Y. Zhang, A. Toga, K. Crawford, A. Ansbach, and P. Taylor, “The Parkinson Progression Marker Initiative (PPMI).,” Prog. Neurobiol. 95(4), 629–35 (2011).
59 R.B. Holmes, D. Martin, L. Tossici-Bolt, L. Jenkins, N. Bush, and P.M. Kemp,
“Multi-Camera Comparison of HMPAO SPECT Simulated Lesion Detectability Using a Subresolution Sandwich Phantom.,” Eur. J. Nucl. Med. Mol. Imaging
35(Supp 2), S176; 298 (2008).
60 R.B. Holmes, M.J. Evans, N.D. Smith, and P.M. Kemp, “A Study of HMPAO
SPECT Database Portability Using a Subresolution Sandwich Phantom,” Eur.
J. Nucl. Med. Mol. Imaging 38(Supp 2), S174; OP392 (2011).
Conflicts of Interest
None
Acknowledgements
post-doctoral research fellowship. DN carried out work as part of an MSc thesis for the
University of Surrey, UK. KJ carried out work as part of a BSc thesis for the