City, University of London Institutional Repository
Citation
:
Kaparias, I., Bell, M. G. H., Singh, A., Dong, W., Sastrawinata, A., Wang, X. and
Mount, B. (2013). Analysing the perceptions and behaviour of cyclists in street environments
with elements of shared space. Paper presented at the 45th Annual Conference of the
Universities’ Transport Study Group, January 2013, Oxford, UK.
This is the accepted version of the paper.
This version of the publication may differ from the final published
version.
Permanent repository link:
http://openaccess.city.ac.uk/6260/
Link to published version
:
Copyright and reuse:
City Research Online aims to make research
outputs of City, University of London available to a wider audience.
Copyright and Moral Rights remain with the author(s) and/or copyright
holders. URLs from City Research Online may be freely distributed and
linked to.
City Research Online:
http://openaccess.city.ac.uk/
[email protected]
This paper is produced and circulated privately and its inclusion
in the conference does not constitute publication. 1
ANALYSING THE PERCEPTIONS AND BEHAVIOUR OF CYCLISTS IN
STREET ENVIRONMENTS WITH ELEMENTS OF SHARED SPACE
I. Kaparias
City University London
M.G.H. Bell
University of Sydney
A. Singh, W. Dong, A. Sastrawinata, X. Wang, B. Mount Imperial College London
Abstract
This paper investigates the impact of the new urban street design concept of shared space on cyclists. Using the recently redeveloped Exhibition Road site in London as an example, which has recently been redeveloped to a modern design with some elements of shared space, the study consists of two parts. The first one conducts a video observation analysis of the behaviour of cyclists in the area before and after redevelopment and looks at changes in key variables, such as flow and speed, while the second provides an insight into the perception of cyclists, which are modelled by means of a purpose-developed survey. Results seem to indicate, from a behavioural perspective, that the redeveloped road layout attracts more cyclists to the area, and in particular commuters, but also that it reduces the average cycling speed. Specifically, reduced speeds are observed in the predominantly pedestrian zone of the area, possibly demonstrating the influence of the increased presence of pedestrians on cycling behaviour. From the perspective of perceptions, on the other hand, results seem to point to clarity as a potential issue needing to be addressed, as many cyclists express confusion as to the exact area where they can cycle.
1 Introduction
The concept of shared space has emerged as part of a continuous trend over many years towards a more integrated approach to the design of urban streets, contrasting the traditional car-oriented approach based on segregation. Inspired by advances in urban planning, it revolves around layouts aimed at asserting the function of streets as places rather than as arteries, which involves designing for easier pedestrian movement and lower vehicle speeds. As such, it contrasts the traditional car-oriented approach, which is based on greater segregation of pedestrians and vehicles to ensure unobstructed traffic flows (Buchanan et al, 1963). Recent guidance published by the UK Department for Transport (DfT) defines shared space as “a street or place designed to improve pedestrian movement and comfort by reducing the dominance of motor vehicles and enabling all users to share the space rather than follow the clearly defined rules implied by more conventional designs” (UK Department for Transport, 2011).
and Transport, 2010); and the “Complete Streets” initiative in the USA (LaPlante and McCann, 2011).
Shared space has been analysed fairly extensively in recent years, yet the vast majority of studies conducted focus almost exclusively on pedestrians and vehicles, with cyclists being largely under-represented. Even in the recent guidance of the UK DfT (2011a), cyclists are identified as an important road user category to be taken into account in street designs with elements of shared space, but are explicitly considered as equivalent to vehicles, with very little insight being given into their actual behaviour and perceptions. It is, hence, the aim of this paper to explore the relationship and impact of shared space on cyclists, in light of the increasing popularity of cycling as a viable alternative to motorised transport modes in cities. The work described here builds on previous work by the authors, covering a wide range of shared-space-related topics, such as traffic conflicts analyses and behavioural studies (Kaparias et al, 2010; 2012; 2013).
Using the example of Exhibition Road in London, which has recently been redeveloped according to the principles of shared space, the present study consists of two parts. The first part analyses the behaviour of cyclists by means of video observation, and looks at changes in key variables, such as speed and flow, as well as at other aspects, such as the effects of cycling between moving pedestrians and the use of hired cycles compared to regular ones. The second part then explores cyclist perceptions through a purpose-developed on-street and online survey, and looks at attributes such as perceived speeds, ease of movement, clarity and perceived safety; the interrelationships between the individual attributes are also investigated.
The paper is structured as follows: Section 2 gives the background of the study, by reviewing previous work on cyclist behaviour and perceptions. Section 3 then presents the methodology adopted in the behavioural observation study, and reports and discusses the results obtained. Section 4 documents the second part of the study, relating to the methodology and analysis of the cyclist perceptions survey, while Section 5 draws conclusions and identifies areas of future work.
2 Background on cyclist behaviour and perceptions
Few studies have specifically investigated the behaviour of cyclists in the past. A notable UK study is the one by Davies et al (2003), who observe and analyse the behaviour of cyclists in vehicle-restricted areas, i.e. areas shared by pedestrians and cyclists with only a few vehicles allowed through for loading and unloading. Using data from 2,220 cyclists in the cities of Cambridge, Hull and Salisbury, the study considers a range of relevant metrics, such as the number of dismounted cyclists, and the speeds and flows of cyclists, and additionally explores cyclist behavioural attributes in comparison with other road users’ behaviour, such as the flow of pedestrians. The results indicate that less than half (40%) of the cyclists dismount in areas with cycling bans, and that this proportion is even lower (11%) when no ban is in place. Also, it is found that cyclists travel with a mean speed of 16 km/h in the areas monitored, and that the speed is negatively correlated with pedestrian flow, as lower speeds are recorded in areas with higher numbers of pedestrians. The study is further coupled with an attitudinal survey, which points out some additional issues, such as the need for clarification of the rules for cycling in vehicle-restricted areas and the recommended use of street furniture in front of the entrances to shops to reduce conflicts with pedestrians.
This paper is produced and circulated privately and its inclusion
in the conference does not constitute publication. 3
consider on-street parking and bus lanes as important features affecting their comfort, and hence do most of the time not notice them.
A considerable amount of research on cyclist perceptions and behaviour in areas shared with other road users has been conducted by the UK DfT, which has resulted in the publication of a series of guidelines and advisory notes. For example, Local Transport Note (LTN) 1/87 (DfT, 1987) mentions that pedestrianisation measures should not force cyclists to use other busier and possibly more unsafe roads, and suggests providing cycling racks in pedestrian areas; it also identifies that it is generally impractical for cyclists to dismount and that a defined cycle track should be provided. The subsequent LTN 1/89 (DfT, 1989) states that sufficient cycle parking must be available, with cycles chained to guardrails and lampposts acting as an indication of the need for extra bicycle facilities. The note also states that cycles are affected by the condition of the pavement more than vehicles, as they are more at risk from potholes and cracks. The later Traffic Advisory Leaflet 9/93 (DfT, 1993) investigates cyclist behaviour in a number of sites and finds that pedestrians change their behaviour with the presence of motor vehicles, but not in response to cycles, and supported by statistics showing that pedestrian/cycle accidents are very rare, concludes that no real factors are found to justify excluding cyclists from pedestrianised zones. It hence suggest providing defined paths for cyclists during heavy pedestrian and cyclist flows, with road users being free to mingle during periods of low flows.
[image:4.595.125.513.436.587.2]The recently published Manual for Streets (MfS) (DfT, 2007) explicitly describes cyclists as being particularly sensitive to traffic conditions, stating that the high flow and speed of vehicles have been found to discourage cycling. As such, MfS suggests a hierarchical approach for the consideration of measures for cyclists, which is shown in Figure 1. The later LTN 2/08 (DfT, 2008) builds on the MfS and specifically identifies that “Cyclists Dismount” signs are over-used and impractical, as they represent a discontinuity in the journey of cyclists, which is highly disruptive; it, instead, states that the sign should only be used in rare occasions, where it is unsafe or impractical for cyclists to continue riding.
Figure 1: MfS hierarchy for providing measures for pedestrians and cyclists (DfT, 2007)
From the review of the background, a number of important factors relating to cyclist behaviour and perceptions become evident, such as the flow and speed of cycles, vehicles and pedestrians, the percentage of cyclists dismounting, the perceived road surface quality, the perceived safety, and the provision of cycling facilities. These are therefore focussed upon in the analysis stage of the paper, described next.
3 Observation of cyclist behaviour
3.1 Study area and observation methodology
[image:5.595.78.479.238.514.2]Exhibition Road is an 800 m long road located in the Royal Borough of Kensington and Chelsea (RBKC) in London and is home to a number of London’s most popular museums (Natural History, Science, V&A). The surrounding area of South Kensington is well-known as a cultural centre, including other venues such as the Royal Albert Hall as well as many academic institutions, including Imperial College London. As the previous conventional dual-carriageway-layout of Exhibition Road was crowded (a problem exacerbated by numerous pedestrian barriers) and dominated by high traffic flows and parked vehicles, the RBKC undertook an engineering scheme, the ‘Exhibition Road Project’, which included its redevelopment to a modern design with some elements of shared space (Figure 2). The project was implemented over four years from mid 2008 to completion in late 2011.
Figure 2: Exhibition Road (top) and Thurloe Street (bottom) before (left) and after redevelopment (right)
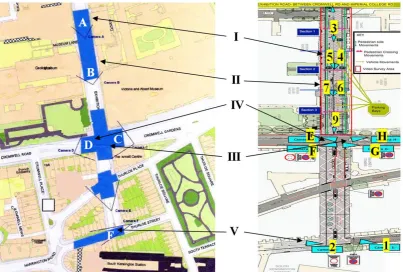
In order to assess the impact of the new design of Exhibition Road on a wide range of aspects, including cyclist behaviour, video footage has been collected for periods before and after the implementation of the scheme. In the before-case, video has been collected in August 2008, prior to the start of the redevelopment works, through high-mast cameras installed at a number of critical locations in terms of conflict occurrences. For the after-situation, video has been recorded at the same locations for periods between October and December 2011, following the completion of the scheme. The locations monitored in the present study and dealing with investigating cyclist behaviour are the main body of Exhibition Road, covered by Camera A in the before- and Cameras 3 and 9 in the after-videos (Location I/II), and Thurloe Street, covered by Camera F in the before and Camera 2 in the after-video (Location V), as shown in Figure 3. As concerns the former, this has seen the conversion of the dual carriageway layout to a single surface, featuring vehicle, pedestrian and transition zones, and giving pedestrians double as much space as before. With respect to the latter, this has been converted from a vehicle-focussed street forming part of a one-way system to an access-only road.
This paper is produced and circulated privately and its inclusion
in the conference does not constitute publication. 5
[image:6.595.118.522.124.396.2]has been implemented. The days and dates chosen for each camera, as well as the duration of the survey are, hence, presented in Table 1.
Figure 3: Camera locations at the Exhibition Road site in the before- (left) and after-monitoring (right)
Table 1: Dates and times of cyclist observation exercise
Date(s) Time
Before
Camera A Monday 25 August 2008 8am-6pm
Camera F Tuesday 26 August 2008 8am-6pm
After
Camera 3 Monday 12 December 2011 8am-6pm
Camera 9 Thursday 15 December 2011 8am-6pm
Camera 2 Thursday 24 November 2011 8am-6pm
As regards the individual behavioural attributes observed in the videos, and based on the review of the background, the cyclist flow before and after the scheme is the most important behavioural component enabling the investigation of whether the new layout attracts or deters cyclists. The scheme has as its core objective to reduce the speeds and flows of motor vehicles, and hence it is expected that this will attract more cyclists. The flows will be counted hourly to show how the flow trend varies during the day, which will give a good insight into the types of cyclists in the area before and after redevelopment. Cyclists in the mornings and evenings are more likely to be commuters, so any changes in the morning and evening flows will indicate the behaviour of commuters.
[image:6.595.173.467.432.550.2]
speeds. The speed analysis will, thus, give an indication on whether the reduced flow or the increased interaction has had a greater impact. In addition, the hourly average speeds will provide information on which type of cyclists travel faster; high speeds in the morning and evening relative to the rest of the day could indicate that commuters travel faster than other cyclists.
Other attributes to be looked at include:
The number of cyclists choosing to cycle outside the vehicle zone (i.e. in the transition or pedestrian zones) on Exhibition Road, which could serve as an indicator of the cyclists’ willingness to share space with pedestrians;
The number of contra-flow cyclists, i.e. the cyclists moving against oncoming vehicle traffic flow, which could give an indication of the freedom of movement of cyclists in the space;
The number of dismounting cyclists in the area, which could provide an insight of the degree to which pedestrians form obstacles for cyclists in the area;
The group behaviour of cyclists, i.e. the number of cyclists cycling side by side instead of forming a single file, which could again give an indication of the freedom of movement of cyclists in the area;
The number of cyclists using shared bikes from the Barclays Cycle Hire scheme, which could provide an insight into the influence and effect of the scheme on cycling behaviour in the area.
3.2 Results
Table 2 presents, the average and peak flows of cyclists on Exhibition Road and Thurloe Street before and after the scheme is implemented. The data show a fairly large increase in the flow of cyclists on Exhibition Road (Location I/II), which is found to be statistically significant at the 0.05-level by means of a t-test. It is hence suggested that more cyclists have been attracted to Exhibition Road post redevelopment. It is important to note, though, that the “before” videos have been collected in August, when schools and universities are shut, whereas the “after” videos have been collected in December, when the educational establishments are open in the area. This may have had an influence on the cyclist flows. The hourly flows of cyclists on Exhibition Road before and after the redevelopment support this finding; as can be noted in the left graph of Figure 4, there is a clear increase in the number of cyclists between 8am and 10am, which suggests that many more commuters cycling on Exhibition Road are recorded post redevelopment.
Table 2: The flow of cyclists before and after the scheme
Location Camera Average flow (cyc/hour) Peak flow (cyc/hour) Peak hour
Location I/II (before) A 33 49 5pm-6pm
Location V (before) F 28 83 5pm-6pm
Location I/II (after) 3 91 172 8am-9am
Location I/II (after) 9 50 87 9am-10am
Location V (after) 2 22 32 5pm-6pm
Thurloe Street (Location V), on the other hand, seems to record a small decrease in the average flow, and a larger one in the peak flow, as shown in Table 2 and on the right histogram of Figure 4. The most notable feature is the peak in the early evening hours’ cyclist flows before redevelopment, which may be explained by the fact that the street was part of a one-way system, so it could have been used by commuters leaving the area in the evenings. The large drop in the evening flow after redevelopment may suggest that the new layout has deterred some commuters from using Thurloe Street. Looking at the statistical significance of these results, it is found by means of a t-test that the decrease in the peak flow is a significant one, while the one in the mean flow is not significant at the 0.05-level.
[image:7.595.71.485.518.610.2]This paper is produced and circulated privately and its inclusion
in the conference does not constitute publication. 7
[image:8.595.118.525.170.297.2]cyclist speeds. More specifically, and focussing on the after-case, it can be seen that different speeds are recorded in the vehicle and in the pedestrian/transition zones of Exhibition Road, with the latter ones being lower. This could confirm the above conjecture about the effect of the degree of sharing and of the interactions with other road users that cyclists are exposed to on their speed. It should be noted that all the speed reductions recorded are statistically significant to the 0.05-level, as found by respective t-tests.
Figure 4: Hourly cyclist flow on Exhibition Road (left) & Thurloe Street (right), before (blue) & after (red)
Table 3: The speed of cyclists before and after the scheme
Mean speed (km/h) Standard deviation (km/h) Cyclists counted
Before 22.3 4.8 187
After (Vehicle zone) 19.8 4.3 194
After (Pedestrian/transition zone) 16.2 3.3 20
The hourly cyclist speeds and flows after the redevelopment are presented in Figure 5, from which a positive correlation between cycling speed and flow can be observed. Calculating the Pearson’s correlation coefficient for the two series, it is found that this correlation is strong (0.702), and it is also statistically significant to the 0.05-level. This implies that as the flow of cyclists increases, their speed also increases. It should be noted, that the highest speeds and flows occur mainly in the mornings and evenings, suggesting that the fast travelling cyclists are mainly commuters.
Figure 5: Hourly flow (dashed) & speed (continuous) of cyclists on Thurloe Street after redevelopment
[image:8.595.158.484.494.674.2]include that the percentage of cyclists cycling in the pedestrian/transition zone of Exhibition Road is 7-8%, the proportion of cyclists dismounting in primarily pedestrian areas around the site (Thurloe Street and pedestrian/transition zone of Exhibition Road) is 17-23%, and that the percentage of Barclays Cycle Hire users of the total number of cyclists in the area is 44%.
4 Survey on cyclist perceptions
Supported by the behavioural analysis of the previous section, the second part of the study investigates the perceptions of cyclists in response to the redevelopment of Exhibition Road to a design with elements of shared space by means of a survey. The analysis gives an insight into the perceptions of cyclists in Exhibition Road, on one hand, and explores the interdependences between the various factors making up these perceptions, on the other. The survey design and analysis results are presented next.
4.1 Survey design and results
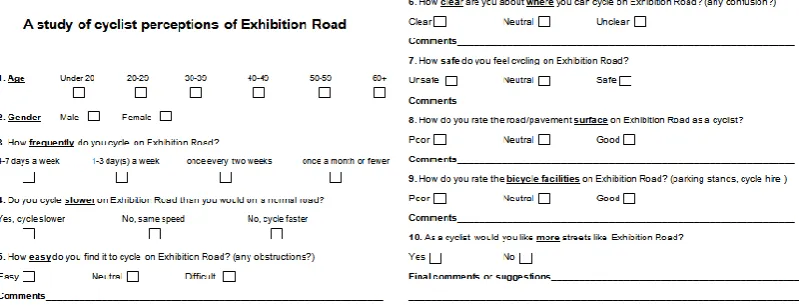
A short questionnaire is developed for the purpose of analysing the perceptions of cyclists in the Exhibition Road area, targeting a large sample of respondents in both on-street and online surveys. The design of the questionnaire is an important task, as careful thought needs to go into the selection of the attributes examined and the formulation of the questions. As the number of questions directly influences the amount of information gained but also the time taken to complete the questionnaire, a trade-off between brevity and level of detail is required. Naturally, respondents may become restless and frustrated with an overlong questionnaire, while too few questions would limit the amount of information that could be obtained. Looking at previous questionnaires in similar exercises, it is decided in this study that 10 questions are required.
[image:9.595.77.477.521.674.2]The first three questions review the respondent’s age, gender and frequency of visit to the area, in order to collect some demographical data of the sample so as to allow for the examination of any possible correlation between demographics and cyclist perceptions. Question 4 explores whether cyclists perceive a reduction in their speed as a result of the redevelopment, while Questions 5-9 look at the perceptions of various aspects of Exhibition Road, including: ease of movement, clarity, safety, road surface and provision of bicycle facilities. The final question then provides an insight into the popularity of the Exhibition Road scheme for cyclists as road users, and its comparison with other streetscapes. An important feature that is also added is the provision of space for the recording of additional comments by the respondents, which can enable subsequent qualitative analysis so as to investigate the causes behind specific responses.
Figure 6: Questionnaire on cyclist perceptions
This paper is produced and circulated privately and its inclusion
in the conference does not constitute publication. 9
frustration are shown by any of the respondents. Also, the respondents seem to understand the questions fairly well and give confident responses, in line with what is expected. No modifications to the survey are, hence, required.
The results of the survey consist of 328 responses, with the main contributors being male (79%) and aged between 20 and 29 years old (63%). While this, initially, seems like a biased sample, it is actually in line with the UK National Travel Survey 2010 statistics (DfT, 2011b), which show that men are 2-3 times more likely to cycle than women, and also that younger people are more frequent cyclists than older ones. In addition, the sample is representative of the cyclist population in the specific area age-wise, given that Exhibition Road is home to a number of educational establishments and has, hence, a strong presence of students in the lower three age categories of the survey. As concerns the frequency of cycling, a good spread of responses is obtained, with 33%, 26%, 19% and 21% for the 4-7 days a week, 1-3 days a week, once in two weeks and once and month categories, respectively.
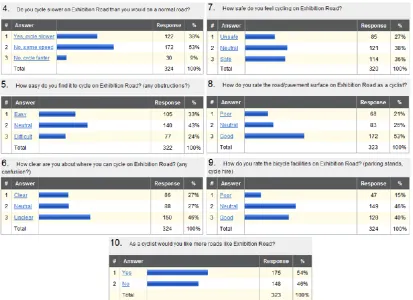
[image:10.595.113.527.399.699.2]The full responses to the questionnaire are given in Figure 7. As can be seen, the vast majority of the respondents perceive their cycling speed on Exhibition Road (Question 4) to be the same as elsewhere (53%) or slower (38%); this finding complements the results of the behavioural analysis, where it is found that cyclists travel slower on Exhibition Road. As concerns the perceived ease of movement (Question 5), the responses are variable, but three of four respondents rate it as “easy” or “neutral”. A notable finding, however, is the response to Question 6, relating to clarity, where almost half of the respondents (46%) rate it as “unclear” and only one in four respondents perceive it as “clear”. Coupled with the qualitative comments from the survey, the main source of this seems to be the mini-roundabout junction layout of Exhibition Road and Prince Consort Road, for which respondents express confusion as to the prevailing set of rules.
Figure 7: Responses to the questionnaire on cyclist perceptions
identify the main sources of this in the fact that certain vehicles travel too fast, in the “unclear” mini-roundabout junction, and in the raised surfaces around the lamp masts, which can be difficult to be seen by cyclists. Conversely, respondents look favourably upon the road surface and bicycle facilities (Questions 8 and 9), with qualitative comments focussing on the issues of the metal drains provided becoming slippery when wet, and on the desire for more bicycle racks in the area.
The final question shows that the opinions of the cyclists are fairly evenly split with respect to the issue of more such schemes being implemented, with a small majority being in favour than against. Cyclists wanting more similar schemes state that they feel safer due to the reduced vehicle traffic, and that the area is a relaxing and aesthetically pleasing environment. Cyclists feeling against more similar schemes state that such layouts still encourage some vehicles to drive too fast, and that such schemes are too costly.
4.2 Analysis and modelling
Performing statistical analysis and modelling of the data collected, interdependences between the various attributes making up the perceptions of cyclists are identified. Namely, as most variables/attributes have categorical outcomes ordered from low to high, ordered logistic regression is used. Ordered logit models take the form Y* = X. + , where Y* is the unobserved dependent variable, X is the vector of independent variables, is the vector of regression coefficients to be estimated, and is a random disturbance term following a logistic distribution. The observed ordinal variable Y is a function of Y*, which has various category thresholds. For example,
Yi =1 if Yi*< 1
Yi=2 if 1<Yi*<2 Yi =3 if Yi*>3
The ordered logit technique uses the observations on Y to determine the parameter vector and the threshold values 1, 2, and 3 so as to be able to subsequently estimate Y* and
predict Y for specific configurations of X.
The parameters used in the statistical analysis, with their respective categories, are:
the seven perception-related parameters, i.e. perceived speed (Speed), ease of moving around (Ease), clarity (Clarity), perceived safety (Safety), road/pavement surface (Surface), provision of bicycle facilities (Facilities), and view on more schemes like Exhibition Road (Popularity), each one having three categories (0=negative, 1=neutral, 2=positive);
and the three demographic parameters, namely respondent’s age (Age, 0=under 20 1=20-29, 2=30-39, 3=40-49, 4=50-59, and 5= 60+), respondent’s gender (Gender, 0=male, 1=female) and frequency of cycling (Frequency, 0=less than once a week, 1=frequent – at least once a week).
Regression is carried out by taking each one of the seven perception-related attributes as the dependent variable and fitting a model with the remaining perception-related and the three demographic parameters as independent variables. Seven models are hence fit. No models are fit with the demographic attributes as dependent variables, though, as these may be considered constant and can thus only be analysed as causes and not as consequences.
This paper is produced and circulated privately and its inclusion
in the conference does not constitute publication. 11
In order to meet this condition, each ordinal variable is replaced by a series of binary ones in the right hand side of each model, depending on the number of categories of the corresponding attribute. Considering the fact that the number of variables coming into a model for each attribute should be n-1, where n is the number of categories of the attribute, two variables are introduced for each perception-related parameter, another two for “Age” and one for each of “Frequency” and “Gender”.
Table 4: Interdependences between cyclist perception variables
Dependent variable
Speed Ease Clarity Safety Surface Facilities Popularity
In de pe n de nt v a ria bl e
Gender . . . . + . .
Age . . ++ . . . .
Frequency . . + . . . .
Speed . . - . . ++
Ease ++ ++ +++ ++ - ++
Clarity . + . . . ++
Safety -- ++ . . ++ +++ Surface . ++ . . . ++ Facilities . . . ++ . . Popularity + + + ++ ++ .
The STATA 10 statistical software package is used to perform the series of regressions and estimate the coefficients of the resulting ordered logit models, and the results of the interdependences identified are summarised in Table 4. Important interdependences can be found between perceived: speed, and ease of movement and safety; ease of movement, and road/pavement surface; clarity, and ease of movement; and safety, and provision of bicycle facilities. Positive interdependences can also be identified between perceived popularity, and perceived: speed, ease of movement, clarity, safety and road/pavement surface. As concerns the demographic attributes, age and cycling frequency seem to positively impact the perceived clarity, while gender appears to positively impact the perceived pavement surface comfort.
5 Conclusions
In light of the shared space concept being increasingly introduced in modern urban street designs, this study has conducted an investigation of the impacts of such designs on cycling, which is increasingly being promoted in cities as an efficient and sustainable alternative to motorised travel modes. Using the recently redeveloped Exhibition Road as a case study, the work has, on one hand, looked at the change in the behaviour of cyclists as a result of the redevelopment by means of video observation and analysis, and on the other hand, provided an insight into the perceptions of cyclists through the conduct of a survey. Results seem to point, from a behavioural perspective, that the redevelopment has attracted more cyclists to the area, but that it has reduced the average cycling speed. From a cyclist perception point of view, on the other hand, generally positive effects of the redevelopment seem to be identified in the pavement surface, in the provision of bicycle facilities, in the perceived ease of movement and in the perceived safety. Clarity, however, seems to be an issue potentially needing further attention for cyclists. A number of interdependences between the various factors making up cyclist perceptions are also identified.
investigate how the behaviour and perceptions change between different cities and countries. This will form a solid basis towards the overall goal of ensuring that the needs and particularities of all road users, including cyclists, are fully addressed in new designs.
Acknowledgement
The authors would like to thank the Royal Borough of Kensington and Chelsea, and in particular Antoneta Horbury and Tesfaye Assegedow, for supporting this work by providing data and guidance.
References
Abraham, JE, McMillan, S, Browlee, AT, and Hunt, JD. Investigation of cycling sensitivities. 81st Annual Meeting of the Transportation Research Board, Washington, DC, USA, 2002. Buchanan C, Cooper GHC, MacEwen A, Crompton DH, Crow G, Michell G et al. Traffic in
towns, HMSO, 1963.
Chartered Institute of Highways and Transport. Manual for Streets 2 – Wider application of the principles. 2010.
Davies, DG, Chinn, L, Buckle, GS and Reid, SJ. Cycling in vehicle restricted areas. TRL report 583, 2003.
Hamilton-Baillie, B. A street revolution. Green Places, Vol. June 2004, 2004a, pp. 20-23. Hamilton-Baillie, B. Urban design: Why don't we do it in the road. Journal of Urban
Technology, Vol. 11, 2004b, pp. 43-62.
Hamilton-Baillie, B and Jones, P. Improving traffic behaviour and safety through urban design. Proceedings of the Institution of Civil Engineers - Civil Engineering, Vol. 158, 2005, pp. 39-47.
Hamilton-Baillie, B. Towards shared space. Urban Design International, Vol. 13, 2008a, pp. 130-138.
Hamilton-Baillie, B. Shared space: Reconciling people, places and traffic. Built Environment, Vol. 34, 2008b, pp. 161-181.
Kaparias, I, Bell, MGH, Greensted, J, Cheng, S, Miri, A, Taylor, C and Mount, B. Development and implementation of a vehicle-pedestrian conflicts analysis method: Adaptation of a vehicle-vehicle technique. Transportation Research Record, Vol. 2198, 2010, 75-82.
Kaparias, I, Bell, MGH, Miri, A, Chan,C and Mount, B. Analysing the perceptions of pedestrians and drivers to shared space. Transportation Research F, vol. 15, 2012, pp. 297-310.
Kaparias, I, Bell, MGH, Dong, W, Sastrawinata, A, Singh, A, Wang, X, and Mount, B. Analysis of pedestrian-vehicle traffic conflicts in street designs with elements of shared space. Transportation Research Record, In press, 2013.
LaPlante, JN and McCann, B. Complete streets in the United States, 90th Annual Meeting of the Transportation Research Board, Washington, DC, USA, 2011.
UK Department for Transport. Local Transport Note 1/87 – Getting the right balance: Guidance on vehicle restriction in pedestrian zones, 1987.
UK Department for Transport. Traffic Advisory Leaflet 9/93 – Cycling in pedestrian areas, 1993.
UK Department for Transport. Local Transport Note 1/89 - Making way for cyclists: Planning design and legal aspects of providing for cyclists, 1989.
UK Department for Transport. Manual for Streets. 2007.
UK Department for Transport. Local Transport Note 2/08 – Cycle infrastructure design, 2008 UK Department for Transport. Local Transport Note 1/11 - Shared space, 2011a.
UK Department for Transport. National Travel Survey 2010, 2011b.