R E S E A R C H
Open Access
A chronology of ratios between black
smoke and PM
10
and PM
2.5
in the context
of comparison of air pollution
epidemiology concentration-response
functions
Mathew R. Heal
1*and Iain J. Beverland
2Abstract
Background:For many air pollution epidemiological studies in Europe,‘black smoke’(BS) was the only measurement available to quantify ambient particulate matter (PM), particularly for exposures prior to the mid-1990s when quantification via the PM10and/or PM2.5metrics was introduced. The aim of this work was to review historic BS and PM measurements to allow comparison of health concentration-response functions (CRF) derived using BS as the measure of exposure with CRFs derived using PM10or PM2.5.
Methods:The literature was searched for quantitative information on measured ratios of BS:PM10, BS:PM2.5, and chemical composition of PM; with specific focus on the United Kingdom (UK) between 1970 and the early 2000s when BS measurements were discontinued.
Results: The average BS:PM10ratio in urban background air was just below unity at the start of the 1970s, decreased rapidly to≈0.7 in the mid-1970s and to≈0.5 at the end of the 1970s, with continued smaller declines in the 1980s, and was within the range 0.2–0.4 by the end of the 1990s. The limited data for the BS:PM2.5ratio suggest it equalled or exceeded unity at the start of the 1970s, declined to≈0.7 by the end of the 1970s, with slower decline thereafter to a range 0.4–0.65 by the end of the 1990s. For an epidemiological study that presents aCRFBSvalue, the corresponding
CRFPM10value can be estimated asRBS:PM10×CRFBSwhereRBS:PM10is the BS:PM10concentration ratio, if the toxicity of PM10 is assumed due only to the component quantified by a BS measurement. In the general case of some (but unknown) contribution of toxicity from non-BS components of PM10 then CRFPM10>RBS:PM10×CRFBS, with
CRFPM10exceeding CRFBS if the toxicity of the other components in PM10 is greater than the toxicity of the component to which the BS metric is sensitive. Similar analyses were applied to relationships betweenCRFPM2.5andCRFBS. Conclusions:Application of this analysis to example published CRFBS values for short and long-term health effects of PM suggest health effects from other components in the PM mixture in addition to the fine black particles characterised by BS.
Keywords: Black smoke, PM10, PM2.5, Epidemiology, Air pollution, Exposure
* Correspondence:[email protected]
1School of Chemistry, University of Edinburgh, David Brewster Road, Edinburgh EH9 3FJ, UK
Full list of author information is available at the end of the article
Background
Prior to the 1990s concentrations of ambient airborne particulate matter (PM) in Europe were largely quanti-fied by the darkness of the particulate material collected on filter papers. In this ‘Black Smoke’ (BS) method, the proportion of white light reflected from the sample (es-sentially the complement of the darkness) was converted to a mass concentration of PM using a standard equa-tion [1, 2]. From the mid-1990s, ambient PM began to be quantified as PM10and/or PM2.5, the total mass
con-centration of all particles within rigorously-defined size fractions, and these are now the usual measure of PM exposure for epidemiological studies [3]. However, for many studies investigating associations between histor-ical air pollution and adverse health, BS values were the only exposure data available. For example, the United Kingdom (UK) Committee on the Medical Effects of Air Pollutants (COMEAP) [4] reported a meta-analysis of 29 time series showing a mean relative risk for cardiovascu-lar premature mortality of 0.6% (95% CI: 0.4–0.7%) per 10 μg m−3 increment in short-term exposure to BS, whilst Janssen et al. [5] derived a pooled risk (from 7 single-city studies) of 0.90% (0.40–1.41%) for cardiovas-cular mortality, and 0.68% (0.31–1.06%) for all-cause mortality, per 10μg m−3increase in BS. There are fewer epidemiological studies of the long-term health effects of particulate air pollution but BS again features as a key metric of exposure [6–10]. The associations between concentrations of black particles and ill-health have been emphasised by the World Health Organisation [11] and others [12].
The concentration value assigned to a BS measure-ment is defined (for British BS) in British Standard 1969:1747:2 [1] and was established by weighing filter samples collected in parallel to the reflectance measure-ments. The Organisation for Economic Co-operation and Development (OECD) definition of BS is related by a simple multiplier: BSOECD= BSBRITISH/0.85 [13]. The
BS calibration curve was established from measurements in 1963 when smoke from residential, commercial and industrial coal burning was the dominant source of am-bient PM in urban areas. At that time the concentrations of smoke-derived particles were so large that non-black particles (secondary inorganic material, sea salt, (re)sus-pended dust and soil, etc.) constituted a small propor-tion of the sampled PM. Since then, the nature of the ambient particle mixture has changed substantially and it has long been known that the BS ‘concentration’ obtained from the calibration curve does not equate to the total mass concentration of particles sampled (e.g. [14–16]). This raises the question of how to compare health coefficients expressed in terms of BS
‘concentrations’ relative to those expressed in terms of PM10 and PM2.5 concentrations.
If BS and PMx (used here to mean PM10 or PM2.5)
characterised completely different exposures to particu-late air pollution then nothing could be inferred about the health response coefficient for PMxfrom that for BS.
However, BS and PMx are both measures of a given
in-haled particle mixture. BS values have been shown to correlate strongly with the elemental carbon (EC) com-ponent of PM (as derived by thermal methods) (e.g. [17–19]). BS is also quantitatively related to black carbon (BC), an alternative optically-derived measure of EC [2]. BS is therefore a good measure of the combustion-derived component of PMx. Some studies have also
demonstrated correlation between BS (or filter darkness) and PMx both temporally (e.g. [16, 20, 21]) and spatially
[18, 22, 23] although ratios can also vary from location to location [24]. Given these physical relationships be-tween BS and PMx, there must also be some relationship
between BS and PMx health response coefficients, albeit
with this relationship dependent on assumptions about what components (size and chemical) of the inhaled PM mixture contribute to its toxicity.
In this work the published literature and datasets were searched to determine changes in BS:PMx ratios from
around 1970 to the early 2000s, when the majority of BS measurements in the UK were discontinued. The focus is on the BS metric (i.e. not filter absorbance, BC or EC measurements), and on urban background environments relevant to the populations underpinning epidemio-logical studies. Given the paucity of contemporaneous measurements, only broad trends in ratios can be de-rived. Nevertheless inferences can be made from these ratios about the relationship between a health response coefficient expressed as a function of BS concentrations with equivalent coefficients expressed as a function of PM10 or PM2.5 concentrations and consequently about
the extent to which an adverse health outcome associ-ated with inhaled PM is associassoci-ated with the particle components characterised by BS.
Methods and results
Historic BS:PMxratios derived from gravimetric
measurements
In the British BS method ambient air was sampled via an inverted funnel and short-length of copper tube through a separate 25-mm diameter Whatman No. 1 filter paper per 24 h period. The reflectance of the collected particle sample was subsequently measured using a white-light reflectometer and the percentage reflection converted to a daily-average BS mass con-centration using a quartic calibration equation [1]. The D50 particle diameter cut-off for a standard BS
equalled PM4.4 by definition. Consequently, BS:PM2.5
and BS:PM10 ratios at that time would have been >1
and <1, respectively. The BS:PM10 ratio would be
around 0.8–0.9 if a value of 0.8–0.9 for the PM4.4:PM10
ratio is assumed. Evidence for this latter ratio, albeit relating to a later time period, is the average PM4.4:PM10
ratio of 0.85 reported by the UK Airborne Particles Expert Group [26] for unpublished data from Leeds in 1995, and the average PM4:PM10ratio of 0.81 reported by Roosli et
al. [27] for measurements in Switzerland in 1997 using Digitel DHA 80 high volume samplers.
Between May 1975 and April 1976, Ball and Hume [14] made weekday measurements of BS and TSP (total suspended particles) on the roof of the County Hall building in central London. For their annual dataset, the BS:TSP ratio was≈0.5 (0.4 for summer, 0.6 for winter). From a detailed analysis of co-located TSP and PM10
measurements from the early 1980s, van den Muelen et al. [28] reported that average PM10:TSP ratios for
west-ern Europe were≈0.7. If the PM10:TSP ratio in the
mid-1970s was close to unity, then the Ball and Hume [14] data indicate a BS:PM10ratio of≈0.7.
The BS calibration curve was re-evaluated in 1979 and the PM mass concentration shown to be approximately double the value derived from application of the original calibration equation [15], i.e. in 1979, BS:PM4.4≈0.5 on
average across the 5 sites and seasons investigated. The divergence in the quantitative relationship in this study (and that of Ball and Hume [14]) from the original calibration measurements in 1963 illustrates the rapid decline throughout this period of the contribution of black particles to PM due to implementation of smoke control measures. Using as above a PM4.4:PM10 ratio of
0.8–0.9, the Bailey and Clayton [15] measurements yield a BS:PM10 ratio of≈0.4–0.45. Bailey and Clayton [15]
also reported data from a sampling system with a single-stage impactor that indicated an average BS:PM2ratio of
0.76. This latter cut point is close to the PM2.5 size
fraction, indicating that at the time of these measure-ments BS:PM2.5≈0.7.
For measurements made in central Leeds for 3–4 months in 1982, Clarke et al. [29] reported data for BS, and from Sierra Model 245 automatic dichotomous samplers, showing average BS:PM2.5 and BS:PM15
ra-tios of 0.54 and 0.34 respectively. The latter indicates a BS:PM10 ratio of≈0.3 if a PM10:PM15 ratio of≈0.9
is assumed.
From a year of daily measurements in Bristol in 1993, average BS:PM10 ratio was 0.23 [30]. In a study of
wintertime PM10and black smoke concentrations across
Europe in 1993/4 the median BS:PM10 ratio in
Amsterdam was 0.35 (no data were collected in the UK in this study, hence Amsterdam was the city most repre-sentative for comparison with UK observations) [16].
The UK Quality of Urban Air Review Group reported mean daily ratios of BS:PM10= 0.29 and BS:PM2.5= 0.48
from co-located measurements at Birmingham Hodge Hill between Jan–Jun 1995 [31].
Daily BS, PM10 and PM2.5 (the latter two metrics
quantified by Partisol gravimetric sampler) measured at the same urban background site in Edinburgh during 1999 and 2000 [32] had median (and interquartile range) daily ratios of 0.42 (0.27–0.60) for BS:PM10 and 0.80
(0.51–1.09) for BS:PM2.5. The higher BS:PM2.5 ratio in
Edinburgh compared with the above data for Birmingham, Bristol and Leeds is likely a consequence of the relatively low PM2.5to PM10ratio at this Edinburgh site [32].
The ratio of BS to PM10was examined in more detail
for Glasgow and Edinburgh using data from the UK air quality data archive (http://uk-air.defra.gov.uk/data) for the period during the late 1990s and early 2000s when both were being measured (Fig. 1) (although in neither city were the measurements co-located). The BS time series were calculated by averaging data across 4 and 3 BS monitoring sites in Glasgow and Edinburgh respect-ively. The mean BS:PM10 ratios for the overlap periods
in the mid to late 1990s in Fig. 1 were 0.30 and 0.29 for Glasgow and Edinburgh respectively using ‘gravimetric equivalent’ PM10 data. The equivalent BS:PM10 ratios
were 0.38 and 0.38 using unadjusted Tapered Element Oscillating Microbalance (TEOM) PM10data. BS trends
in Glasgow and Edinburgh were broadly similar to trends in UK-average BS estimated from UK‘smoke and SO2 network’ annual reports (http:/uk-air.defra.gov.uk)
(Fig. 1). Co-located PM2.5 and PM10 measurements in
the late 1990s from southern UK [33] and across Europe [34] indicate PM2.5:PM10 ratios generally in the range
0.6–0.8. Combining these ratios with BS:PM10 ratios of
0.3–0.4 suggests that BS:PM2.5 ratios at this time may
have been in the range 0.4–0.65.
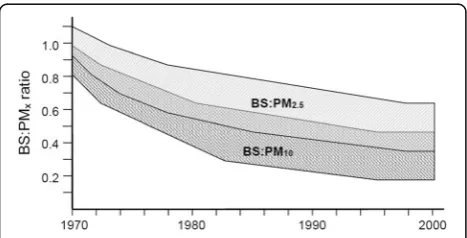
The broad trends in BS:PMx ratios inferred from the
literature described above are illustrated schematically in Fig. 2. In summary, the available data indicate the fol-lowing general trend in average BS:PM10 ratio in urban
background air: close to unity at the start of the 1970s; falling rapidly to≈0.7 in the mid-1970s;≈0.5 at the end of the 1970s; further smaller decline in the 1980s; within the range 0.2–0.4 in the 1990s. Direct data for estima-tion of BS:PM2.5ratios were sparser, and indicate the
fol-lowing general trend: equal or exceeding unity at the start of the 1970s; a decline to≈0.7 by the end of the 1970s; further decline through the 1980s; within the range 0.4–0.65 by the end of the 1990s.
Historic BS:PMxratios derived from compositional
measurements
BS:PMx ratios can also be derived through estimation of
PM mass is due to the following components: ammo-nium sulphate, ammoammo-nium nitrate, sodium nitrate, sodium chloride, primary ‘dusts’, elemental carbon, or-ganic carbon and water of hydration [35, 36]. However, historic measurements of PM chemical speciation back to the 1970s are very limited. Data are by far most abun-dant for sulphate. A summary of the estimates for the historical concentrations of the major chemical compo-nents within UK urban PM2.5 and PM10 is given in
Table 1. A detailed description of the origin of the values assigned to these chemical components is provided in the Additional file 1.
The compositional estimates in Table 1 are expressed in Table 2 as the proportions of PM10and PM2.5 in the
1970s and late 1990s that comprised: carbonaceous ma-terial; secondary inorganic mama-terial; and primary sea-salt and (re)suspended dust combined. The proportions esti-mated for PM10in the late 1990s are consistent with the
average proportions of approximately one-third each carbonaceous, secondary inorganic, and sea-salt plus dust reported for urban background PM10 in
Birming-ham and Glasgow in 2000 [37]. The concentrations of sea-salt, primary dust and secondary inorganic aerosol have remained about the same between the 1970s and late 1990s (a decrease in secondary sulphate in the latter was offset by an increase in secondary nitrate), but con-centrations of carbonaceous material have decreased substantially. The proportions in Table 2 for PM2.5 in
the late 1990s are likewise consistent with the average proportions of 0.4–0.5 primary carbonaceous, 0.4–0.5 secondary inorganic and 0.1–0.2 sea-salt/primary dust reported by the UK Air Quality Expert Group [37, 38] for urban background PM2.5for the year 2000.
Table 1 also presents the totals of the historical com-positional concentrations, and compares BS:PMx ratios
estimated by this speciated approach to ratios estimated from the direct measurements of BS and PMx reported
in Section 2 and Fig. 1. The ranges of these estimates were quite large, but there was consistency between magnitudes of the BS:PMx ratios derived in the two
approaches.
Discussion
BS and PMx are both measures of inhaled particles, the
latter the mass concentration of all particles in a
Fig. 1Annual average BS in Glasgow, Edinburgh and annual average for multiple sites across the UK for 1970–2001. The Glasgow and Edinburgh BS time series are averages across representative background sites in each city (sites EDI 10, 12 & 14 and GLA 51, 68, 95 & 98) operated at different times during the period covered. The UK-average BS time series was computed from sites operational in that year. Also shown are the annual average urban centre‘gravimetric equivalent’TEOM PM10data for Glasgow and Edinburgh from the initiation of these measurements in the 1990s. All data obtained from the UK air quality data archive (http://uk-air.defra.gov.uk/data)
Fig. 2Schematic of estimated ranges (shaded areas) for BS:PM10and BS:PM2.5ratios in UK urban areas between 1970 and 2000 based on data from the observational studies discussed in the text. Theshaded areas do not represent formal statistical confidence intervals. If the average size of the‘black’(i.e.optically absorbing) particles in the particle mixture was decreasing through this time period then the reduction in the proportion ofblackparticles in the PM mixture may be slightly greater than the reduction in the numerical ratios between BS and PMxillustrated in this figure (see text for more
[image:4.595.57.540.87.268.2] [image:4.595.57.291.498.617.2]specified size fraction, the former a measure of a sub-component of the PM4.4 size fraction but assigned a
concentration value that does not equal the true con-centration of that sub-component. The estimation of a concentration response coefficient for one metric from the concentration response coefficient derived for the other depends on the assumptions of where in the inhaled PM the toxicity lies.
Consider first the relationship between the concentration-response functions for BS (CRFBS) and
PM10 (CRFPM10). The PM4.4 size fraction of the BS
measurement is a subset of the PM10 size fraction. If
uniform toxicity in all particle components within PM10
is assumed then the health risk expressed per unit in-crease in PM10 is the same as the health risk expressed
per same unit increase in BS, i.e. CRFPM10=CRFBS. If
the toxicity of PM10 is assumed to result only from the
component to which the BS metric is sensitive then
CRFPM10=RBS:PM10×CRFBS where RBS:PM10 is the
BS:PM10concentration ratio. In the general case of some
(but unknown) contribution of toxicity from non-BS components of PM10 then CRFPM10>RBS:PM10×CRFBS,
with CRFPM10 exceeding CRFBS if the toxicity of the
other components in PM10is greater than the toxicity of
the component to which the BS metric is sensitive. Meaningful relationships can only be derived between
CRFPM2.5andCRFBSif it is assumed that all the particles
quantified by BS are within the PM2.5 size fraction, in
which case the same analysis applies: if the toxicity of PM2.5 is assumed due only to the component to which
the BS metric is sensitive then CRFPM2.5=RBS:PM2.5×
CRFBS whereRBS:PM2.5is the BS:PM2.5concentration
ra-tio; and in the general case of assumed (but unknown) toxicity in the other components of PM2.5 then
CRFPM2.5>RBS:PM2.5×CRFBS, with CRFPM2.5 equalling
CRFBS if the toxicity of the other components in PM2.5
is the same as the toxicity of the component quantified by BS. If a proportion of particles of the BC component characterised by BS are in a size fraction greater than PM2.5then it is not possible to linkCRFPM2.5andCRFBS
without knowledge of this proportion. However, it is likely that the major proportion of particles charac-terised by BS are within PM2.5.
The above analysis can be applied to the work of Janssen et al. [5] who reported pooled values for
CRFBS of 0.90 (0.40–1.41)% for cardiovascular
mortal-ity, and 0.68 (0.31–1.06)% for all-cause mortality, per 10 μg m−3. The studies from which the pooled esti-mates are derived relate to BS data from 1986–1996. The analysis in Section 2 suggests a BS:PM10 ratio at
[image:5.595.57.537.154.354.2]that time of approximately 0.3 (range 0.2–0.4). So if
Table 1Summary of estimates of historical UK average urban BS concentrations, and of individual and summed component concentrations in PM2.5and PM10 (μg m−3). Summations of components assume individual ranges correspond to 4 sd of
uncertainty (i.e. that ranges approximate to a 95% confidence interval) and use standard formulae for combinations of uncertainties. The same approach is used to combine uncertainties in PM2.5:PM10 splits with the ranges of individual
components. Detailed explanation of how these values are derived is given in the Additional file 1. The bottom two rows provide the BS:PMxratios implied by this speciated approach and as inferred from the direct measurements discussed in Section 2
PM component 1970s 1980s Late 1990s PM2.5/PM10split 1970s 1980s Late 1990s
BS BS
35 18 8 35 18 8
PM10 PM2.5
(NH4)2SO4 7–16 7–16 4–7 0.8–0.9 6–14 6–14 3–6
NH4NO3+ NaNO3 3–7 3–10 3–10 0.5–0.7 2–4 2–6 2–6
NaCl 2–5 2–5 2–5 0.2–0.4 0.5–1.5 0.5–1.5 0.5–1.5
Dust 2–4 2–4 2–4 0.2–0.4 0.5–1.5 0.5–1.5 0.5–1.5
EC 8–10 4–5 2–3 0.7–0.9 6–9 3–4 1–2
OM 13–37 6–19 3–9 0.7–0.9 10–30 5–15 2–7
Total PMx 44–70 33–50 21–31 31–53 23–36 13–20
BS:PMxratio (via speciated data)
0.5–0.8 0.35–0.5 0.25–0.4 0.65–1.1 0.5–0.8 0.4–0.6
BS:PMxratio
(direct measurements) ≈
0.7 ≈0.5 ≈0.3 0.7–1.1 0.5–0.8 0.4–0.65
Table 2Estimates of the proportions of carbonaceous, secondary inorganic, and sea-salt and dust material within UK urban PM10
and PM2.5, in the 1970s and late 1990s, derived from the individual
component concentrations given in Table 1
chemical component
PM10 PM2.5
1970s late 1990s 1970s late 1990s
[image:5.595.57.290.662.731.2]the toxicity of PM10 were contained only within the
BS component, CRFPM10 values of ~0.3% and ~0.2%
for cardiovascular and all-cause mortality respectively (per 10 μg m−3 PM10) would be anticipated. The
pooled CRFPM10 values reported by Janssen et al. [5]
are 0.60 (0.23–0.97)% and 0.48 (0.18–0.79)% per 10 μg m−3, which in both cases are greater than the
CRFPM10 estimated from consideration of the BS:PM10
ratio but less than the CRFBS. This therefore suggests
that there may be a mortality effect associated with other components of PM10 to which the BS
mea-surement is insensitive-i.e. non-black components and/or particles larger than the 4.4 μm cut-off of a BS sampler—but that this mortality effect is smaller per μg m−3 increment than that associated with the same increment in BS concentration. A similar analysis is not possible between BS and PM2.5since Janssen et al. [5]
do not report values ofCRFPM2.5.
As a second example, the cohort study of Yap et al. [10] determined a statistically-significant 5% relative risk in all-cause mortality per 10μg m−3increment in 1970s decadal-mean BS. If equal toxicity for all particles is assumed, then the CRFPM10 and CRFPM2.5 values for
long-term all-cause mortality are both also 5% per 10 μg m−3 increment in PM10 or PM2.5. The data
pre-sented in Section 2 indicate BS:PM10and BS:PM2.5ratios
in the 1970s of≈0.7 and≈1.0 respectively, so if toxicity is assumed associated only with the component to which the BS is sensitive then theCRFBSvalue would equate to
CRFPM10 and CRFPM2.5 values of 3.5% and 5%,
respect-ively, per 10 μg m−3 increment in the PM10 and PM2.5
prevailing in the 1970s. If the associations of mortality with BS derived for exposures in the 1970s remain valid for exposures to airborne PM around the year 2000 (when BS:PM10and BS:PM2.5 ratios were≈0.3 and≈0.5,
respectively) then, if toxicity is again assumed only in the BS-sensitive component, theCRFPM10 and CRFPM2.5
values would be≈1.5% and≈2.5%, respectively, per 10 μg m−3increment in the PM10 and PM2.5 prevailing
at that time. COMEAP [39] report aCRFPM2.5for
long-term all-cause mortality of 6%. Comparing this to the effective CRFPM2.5 of 2.5–3.5% of the Yap et al. [10]
study, suggests that the assumption that all the toxicity quantified in the Yap et al. study is associated with what is measured by BS is not valid and that other non-BS components of the inhaled particle mixture also contrib-ute to the associated all-cause mortality. This interpret-ation is consistent with that described above for the BS-based time-series epidemiology, except that for these long-term studies the mortality effect associated with the non-BS component of PM2.5 appears to be
at least as large as that for the same increment in BS concentration. If the assumption regarding time-invariant mortality association with BS between 1970s and 2000 is
not correct then this particular comparative analysis of CRFs doesn’t hold either.
A BS measurement may be a surrogate for other, or additional, toxic components of the particle mixture, such as transitions metals associated with traffic particle emissions. This would not affect the above analyses of CRF values if BS were a consistent surrogate of these other components.
Ratios of BS to PMxwere likely to have varied with
lo-cation at given time points, as has been noted for rela-tionships between BC, EC and BS [24]. The historic data analysed here were urban background and, for the most part, for the UK. Nevertheless it is emphasised again that, because of this variability, only broad trends in ap-proximate BS:PMx ratios can be derived here. However,
epidemiological studies are generally based on measure-ments at one or a few fixed sites and therefore also do not take into account intra-urban variation. So the ana-lyses presented here of approximate BS:PMx ratios at
epidemiologically-relevant monitoring sites is consistent with epidemiology methods; and any ‘sub-population’ intra-urban variability does not negate the potential of deducing information from the relationship between CRFs for BS and for PMx at a given site. Uncertainty is
also intrinsically present when an epidemiological study yields a CRF with respect to BS or PMxbecause it is not
possible to know exactly what particle mixture led to the particular BS or PMxvalues used in the epidemiology.
A further area of uncertainty in interpreting BS data is the extent of any change over time in the specific optical absorption coefficient of the material causing the dark-ness. In the BS method the reflectance depends on both the size of the black particles (absorption per unit mass increases with decreasing particle) and the dilution of the black particles with non-black particles (absorption is greater for a fixed mass of black particles that is in-ternally or exin-ternally mixed with transparent particles) [40–42]. It is probable that both the size distribution and the degree of mixing of black particles changed dur-ing the period under consideration. For example, the dominant source of black particles in the latter part of this historic times series is from high-pressure combus-tion (vehicle engines) which produces particles with smaller diameters than black particles from atmospheric pressure combustion processes (coal and other solid-fuel burning). If in more recent times the black particles are in a smaller size fraction and subject to more dilution with non-absorbing particles, then on both counts re-flectance measurements are more sensitive than previ-ously to the black particles present. This implies that more recent BS:PMx ratios are slightly greater than they
end of the time period under consideration is largely contained within the smaller particle fraction [43–45]. The change in size of black particles does not make any difference to the trends in ratios presented in Fig. 2 or the analyses presented in this discussion; however the reduction with time in the proportion of black particles in the PM mixture may in reality be slightly greater than the reduction in the numerical ratios between BS and PMx.
Conclusions
Examination of the published literature and data has enabled estimates of the changing ratios of BS:PM10and
BS:PM2.5 to be derived for the period 1970 to the early
2000s when routine measurements of BS were dis-continued. These ratios help interpret how health concentration-response functions derived from air pollu-tion epidemiology studies where BS was the measure of exposure relate to concentration-response functions expressed as PM10or PM2.5, and, consequently, whether
health effects are associated solely with the fine black particles to which the BS measurement is sensitive. Ap-plication of this analysis to example published data for short and long-term health effects of particulate matter suggest those studies show there are health effects from non-BS components of PM as well.
Additional file
Additional file 1:Supplementary Information. (PDF 399 kb)
Abbreviations
BC:Black carbon; BS: Black smoke; COMEAP: Committee on the Medical Effects of Air Pollutants; CRF: Concentration-response function; EC: Elemental carbon; OECD: Organisation for Economic Co-operation and Development; PM: Particulate matter; PM10: Mass concentration of particulate matter with aerodynamic diameter <10μm; PM2.5: Mass concentration of particulate matter with aerodynamic diameter <2.5μm; TEOM: Tapered element oscillating microbalance; TSP: Total suspended particulate (matter); UK: United Kingdom
Acknowledgements
The use of data obtained from http://uk-air.defra.gov.uk is acknowledged. These data are subject to Crown copyright, Defra, licenced under the Open Government Licence (OGL).
Funding
No funding was received to undertake the research presented in this paper.
Availability of data and materials
All data used are publicly available in the cited literature and UK air quality data archive (http://uk-air.defra.gov.uk).
Authors’contributions
MRH and IJB jointly conceived the design of the research undertaken. MRH undertook the majority of the data searching and summarising, and wrote the first draft of the paper. Both authors refined the interpretation and presentation of the findings and approve the final version of the paper.
Competing interests
The authors declare that they have no competing interests.
Consent for publication Not applicable.
Ethics approval and consent to participate Not applicable.
Publisher’s Note
Springer Nature remains neutral with regard to jurisdictional claims in published maps and institutional affiliations.
Author details
1
School of Chemistry, University of Edinburgh, David Brewster Road, Edinburgh EH9 3FJ, UK.2Department of Civil and Environmental Engineering, University of Strathclyde, James Weir Building, 75 Montrose Street, Glasgow G1 1XJ, UK.
Received: 28 October 2016 Accepted: 18 April 2017
References
1. BSI. Methods for the measurement of air pollution. Part 2: determination of concentration of suspended matter. London: British Standards Institution; 1969. Report No.: British Standard 1747: Part 2: 1969.
2. Heal MR, Quincey P. The relationship between black carbon concentration and black smoke: a more general approach. Atmos Environ. 2012;54:538–44. 3. Heal MR, Kumar P, Harrison RM. Particles, air quality, policy and health.
Chem Soc Rev. 2012;41:6606–30.
4. COMEAP. Cardiovascular disease and air pollution. A report by the Committee on the Medical Effects of Air Pollutants. London: Department of Health; 2006. https://www.gov.uk/government/collections/comeap-reports.
5. Janssen NAH, Hoek G, Simic-Lawson M, Fischer P, van Bree L, ten Brink H, Keuken M, Atkinson RW, Anderson HR, Brunekreef B, Cassee FR. Black carbon as an additional indicator of the adverse health effects of airborne particles compared with PM10 and PM2.5. Environ Health Perspect. 2011;119:1691–9.
6. Hoek G, Fischer P, Van den Brandt P, Goldbohm S, Brunekreef B. Estimation of long-term average exposure to outdoor air pollution for a cohort study on mortality. J Expo Sci Environ Epidemiol. 2001;11:459–69.
7. Filleul L, Rondeau V, Vandentorren S, Le Moual N, Cantagrel A, Annesi-Maesano I, Charpin D, Declercq C, Neukirch F, Paris C, Vervloet D, Brochard P, Tessier JF, Kauffmann F, Baldi I. Twenty five year mortality and air pollution: results from the French PAARC survey. Occup Environ Med. 2005;62:453–60.
8. Elliott P, Shaddick G, Wakefield JC, de Hoogh C, Briggs DJ. Long-term associations of outdoor air pollution with mortality in Great Britain. Thorax. 2007;62:1088–94.
9. Brunekreef B, Beelen R, Hoek G, Schouten L, Bausch-Goldbohm S, Fischer P, Armstrong B, Hughes E, Jerrett M, Van den Brandt P. Effects of long-term exposure to traffic-related air pollution on respiratory and cardiovascular mortality in the Netherlands: the NLCS-AIR study. Res Rep Health Eff Inst. 2009;139:5–71.
10. Yap C, Beverland IJ, Heal MR, Cohen GR, Robertson C, Henderson DEJ, Ferguson NS, Hart CL, Morris G, Agius RM. Association between long-term exposure to air pollution and specific causes of mortality in Scotland. Occup Environ Med. 2012;69:916–24.
11. WHO. Health effects of black carbon. Copenhagen: World Health Organisation Regional Office for Europe; 2012. ISBN 978 92 890 0265 3. http://www.euro.who.int/__data/assets/pdf_file/0004/162535/e96541.pdf. 12. Grahame TJ, Klemm R, Schlesinger RB. Public health and components
of particulate matter: the changing assessment of black carbon. J Air Waste Manage Assoc. 2014;64:620–60.
13. Quincey P, Butterfield D, Green D, Fuller GW. Black smoke and black carbon: further investigation of the relationship between these ambient air metrics. Atmos Environ. 2011;45:3528–34.
14. Ball DJ, Hume R. Relative importance of vehicular and domestic emissions of dark smoke in greater London in mid-1970s - significance of smoke shade measurements, and an explanation of relationship of smoke shade to gravimetric measurements of particulate. Atmos Environ. 1977;11:1065–73.
16. Hoek G, Forsberg B, Borowska M, Hlawiczka S, Vaskovi E, Welinder H, Branis M, Benes I, Kotesovec F, Hagen LO, Cyrys J, Jantunen M, Roemer W, Brunekreef B. Wintertime PM10 and black smoke concentrations across Europe: results from the peace study. Atmos Environ. 1997;31:3609–22. 17. Kinney PL, Aggarwal M, Northridge ME, Janssen NAH, Shepard P. Airborne concentrations of PM2.5 and diesel exhaust particles on Harlem sidewalks: a community-based pilot study. Environ Health Perspect. 2000;108:213–8. 18. Cyrys J, Heinrich J, Hoek G, Meliefste K, Lewne M, Gehring U, Bellander T,
Fischer P, Van Vliet P, Brauer M, Wichmann HE, Brunekreef B. Comparison between different traffic-related particle indicators: elemental carbon (EC), PM2.5 mass, and absorbance. J Expo Sci Environ Epidemiol. 2003;13:134–43. 19. Reche C, Querol X, Alastuey A, Viana M, Pey J, Moreno T, Rodriguez S, Gonzalez
Y, Fernandez-Camacho R, Sanchez De La Campa A, de la Rosa J, Dall’osto M, Prevot A, Hueglin C, Harrison R, Quincey P. New considerations for PM, black carbon and particle number concentration for air quality monitoring across different European cities. Atmos Chem Phys. 2011;11:6207–27.
20. Penttinen P, Alm S, Ruuskanen J, Pekkanen J. Measuring reflectance of TSP-filters for retrospective health studies. Atmos Environ. 2000;34:2581–6. 21. Roemer WH, van Wijnen JH. Differences among black smoke, PM10,
and PM1.0 levels at urban measurement sites. Environ Health Perspect. 2001;109:151–4.
22. Eeftens M, Tsai MY, Ampe C, Anwander B, Beelen R, Bellander T, Cesaroni G, Cirach M, Cyrys J, de Hoogh K, de Nazelle A, de Vocht F, Declercq C, Dedele A, Eriksen K, Galassi C, Grazuleviciene R, Grivas G, Heinrich J, Hoffmann B, Iakovides M, Ineichen A, Katsouyanni K, Korek M, Kramer U, Kuhlbusch T, Lanki T, Madsen C, Meliefste K, Molter A, Mosler G, Nieuwenhuijsen M, Oldenwening M, Pennanen A, Probst-Hensch N, Quass U, Raaschou-Nielsen O, Ranzi A, Stephanou E, Sugiri D, Udvardy O, Vaskoevi E, Weinmayr G, Brunekreef B, Hoek G. Spatial variation of PM2.5, PM10, PM2.5 absorbance and PMcoarse concentrations between and within 20 European study areas and the relationship with NO2 - Results of the ESCAPE project. Atmos Environ. 2012;62:303–17. 23. Durant JL, Beelen R, Eeftens M, Meliefste K, Cyrys J, Heinrich J, Bellander T,
Lewne M, Brunekreef B, Hoek G. Comparison of ambient airborne PM2.5, PM2.5 absorbance and nitrogen dioxide ratios measured in 1999 and 2009 in three areas in Europe. Sci Total Environ. 2014;487:290–8.
24. Olstrup H, Johansson C, Forsberg B. The Use of Carbonaceous Particle Exposure Metrics in Health Impact Calculations. Int J Environ Res Public Health. 2016;13:249. doi:10.3390/ijerph13030249.
25. Mcfarland AR, Ortiz CA, Rodes CE. Wind tunnel evaluation of the British smoke shade sampler. Atmos Environ. 1982;16:325–8.
26. APEG. Source apportionment of airborne particulate matter in the UK. Report of the Airborne Particles Expert Group. London: DETR; 1999. 27. Roosli M, Braun-Fahrlander C, Kunzli N, Oglesby L, Theis G, Camenzind M,
Mathys P, Staehelin J. Spatial variability of different fractions of particulate matter within an urban environment and between urban and rural sites. J Air Waste Manage Assoc. 2000;50:1115–24.
28. van der Meulen A, van Elzakker BG, van den Hooff GN. PM10 results of a 1-year monitoring survey in the Netherlands. J Air Pollut Control Assoc. 1987;37:812–8.
29. Clarke AG, Willison MJ, Zeki EM. A comparison of urban and rural aerosol composition using dichotomous samplers. Atmos Environ. 1984;18:1767–75. 30. Muir D, Laxen DPH. Black smoke as a surrogate for PM10 in health studies.
Atmos Environ. 1995;29:959–62.
31. QUARG. Airborne particulate matter in the United Kingdom. Third Report of the Quality of Urban Air Review Group. London: UK Department of Environment; 1996. ISBN 0 952077132. http://uk-air.defra.gov.uk/library/reports?report_id=48. 32. Heal MR, Hibbs LR, Agius RM, Beverland IJ. Interpretation of variations in
fine, coarse and black smoke particulate matter concentrations in a Northern European city. Atmos Environ. 2005;39:3711–8.
33. Harrison RM, Yin JX, Mark D, Stedman JR, Appleby RS, Booker J, Moorcroft S. Studies of the coarse particle (2.5–10 mm) component in UK urban atmospheres. Atmos Environ. 2001;35:3667–79.
34. Van Dingenen R, Raes F, Putaud JP, Baltensperger U, Charron A, Facchini MC, Decesari S, Fuzzi S, Gehrig R, Hansson HC, Harrison RM, Huglin C, Jones AM, Laj P, Lorbeer G, Maenhaut W, Palmgren F, Querol X, Rodriguez S, Schneider J, ten Brink H, Tunved P, Torseth K, Wehner B, Weingartner E, Wiedensohler A, Wåhlin P. A European aerosol phenomenology-1: physical characteristics of particulate matter at kerbside, urban, rural and background sites in Europe. Atmos Environ. 2004;38:2561–77.
35. Harrison RM, Jones AM, Lawrence RG. A pragmatic mass closure model for airborne particulate matter at urban background and roadside sites. Atmos Environ. 2003;37:4927–33.
36. Gibson MD, Heal MR, Bache D, Hursthouse AS, Beverland IJ, Craig SE, Clark CF, Jackson MH, Guernsey JR, Jones C. Using mass reconstruction along a four-site transect as a method to interpret PM10 in West-Central Scotland, United Kingdom. J Air Waste Manage Assoc. 2009;59:1429–36.
37. AQEG. Particulate Matter in the United Kingdom. Second report of the Air Quality Expert Group. London: UK Department for Environment, Food and Rural Affairs; 2005. PB10580.http://uk-air.defra.gov.uk/library/reports?report_id=269. 38. AQEG. Fine Particulate Matter (PM2.5) in the United Kingdom. Air Quality
Expert Group. London: UK Department for Environment, Food and Rural Affairs; 2012. PB13837. http://uk-air.defra.gov.uk/library/reports?report_id=727. 39. COMEAP. Long-term exposure to air pollution: effect on mortality. https://
www.gov.uk/government/publications/comeap-long-term-exposure-to-air-pollution-effect-on-mortality: UK Department of Health Committee on the Medical Effects of Air Pollutants. ISBN 978-0-85951-640-2; 2009. 40. Horvath H. Atmospheric light-absorption - a review. Atmos Environ.
1993;27:293–317.
41. Horvath H. Size segregated light-absorption coefficient of the atmospheric aerosol. Atmos Environ. 1995;29:875–83.
42. Bond TC, Bergström RW. Light absorption by carbonaceous particles: an investigative review. Aerosol Sci Technol. 2006;40:27–67.
43. Fischer PH, Hoek G, van Reeuwijk H, Briggs DJ, Lebret E, van Wijnen JH, Kingham S, Elliott PE. Traffic-related differences in outdoor and indoor concentrations of particles and volatile organic compounds in Amsterdam. Atmos Environ. 2000;34:3713–22.
44. Kingham S, Briggs D, Elliott P, Fischer P, Lebret E. Spatial variations in the concentrations of traffic-related pollutants in indoor and outdoor air in Huddersfield, England. Atmos Environ. 2000;34:905–16.
45. Johannesson S, Gustafson P, Molnar P, Barregard L, Sallsten G. Exposure to fine particles (PM2.5 and PM1) and black smoke in the general population: personal, indoor, and outdoor levels. J Expo Sci Environ Epidemiol. 2007;17:613–24.
• We accept pre-submission inquiries
• Our selector tool helps you to find the most relevant journal
• We provide round the clock customer support
• Convenient online submission
• Thorough peer review
• Inclusion in PubMed and all major indexing services
• Maximum visibility for your research
Submit your manuscript at www.biomedcentral.com/submit