City, University of London Institutional Repository
Citation
:
Raoufi, N., Surre, F., Rajarajan, M., Sun, T. & Grattan, K. T. V. (2013). Fibre
Optic pH Sensor Using Optimized Layer-by-Layer Coating Approach. IEEE Sensors Journal,
14(1), pp. 47-54. doi: 10.1109/JSEN.2013.2280283
This is the accepted version of the paper.
This version of the publication may differ from the final published
version.
Permanent repository link: http://openaccess.city.ac.uk/12791/
Link to published version
:
http://dx.doi.org/10.1109/JSEN.2013.2280283
Copyright and reuse:
City Research Online aims to make research
outputs of City, University of London available to a wider audience.
Copyright and Moral Rights remain with the author(s) and/or copyright
holders. URLs from City Research Online may be freely distributed and
linked to.
City Research Online:
http://openaccess.city.ac.uk/
[email protected]
Abstract— In this study the design and characterization of a high resolution wavelength dependent pH optical sensor fabricated using the layer-by-layer technique was undertaken. In this approach, brilliant yellow (BY) as a pH indicator and poly (allylamine hydrochloride) [PAH] as a cross-linker have been deposited on an uncladded silica fibre. A number of key parameters, such as the number of bilayers, the concentration of the BY solution and the shape of the fibre, as well as its core diameter have been varied with a view to optimizing the design and performance of the pH sensor. The results obtained from a series of evaluations show that the sensitivity was enhanced by reducing the concentration of the indicator solution used and by designing a U-bend configuration sensor probe with a sharply bent fibre. However, when making an overall comparison, the straight (unbent) fibre probe resulted in a more sensitive probe when compared to the use of a high radius bend. Further, utilizing a small core diameter of the fibre allows a wide pH range to be measured and with high sensitivity. Additionally, the performance was shown to be improved for measurements over a narrower range of pH, by using a fibre with a larger core diameter. Considering the effect of the number of layers, work carried out has shown that probes with 5-6 bilayers presented the best performance. The sensitivity has been shown to diminish when more than 6 layers were used and the sensing range shifts towards higher pH values. When monitored, the value of pKa (the dissociation constant) of the thin film showed the smallest change of any of the design factors considered. In summary, using a larger core diameter, employing a larger curve radius, a higher number of bilayers, a higher concentration of the indicator solution and applying PAH as an outer layer, all cause a higher pKa value and consequently the probe sensitivity moves
towards alkaline region.
Index Terms— layer-by-layer, optical sensor, pH measurement,
U-bend sensor, chemical sensor
Manuscript received November 9, 2012. This work was supported in part by scholarship from City University London and Islamic Azad University- South Tehran Branch.
Raoufi N. is with Islamic Azad University – South Tehran Branch, Tehran, Iran. She is now studying her PhD in School of Engineering and Mathematical Sciences, City University London, Northampton Square, London, EC1V 0HB, UK; e-mail: [email protected] & [email protected]
Otherauthors are with School of Engineering and Mathematical Science, City University London, Northampton Square, London, EC1V 0HB, UK; emails:
[email protected]; [email protected]; [email protected]; [email protected];
I. INTRODUCTION
H is one of the most common analytical measurements required in both industrial processing and laboratory research in which real-time measurement is needed and thus a quick, reliable, low cost and high resolution sensor is necessary. Fibre optic techniques present many advantages, making this technology a suitable candidate for real time pH point-sensing. It is well known that different structures of fibres that may be used and their various materials employed, as well as different shapes of the probe formed from the fibre can all demonstrate individual behavior in a range of sensor applications [1-4]. Hence optimizing the type of the fibre and the coating method used can be crucial steps in producing the most suitable probes for different sensing applications and ranges. To create such sensors, the layer-by-layer deposition technique is a widely used method to develop a tailored multilayered thin film to coat the different substrates that may be used e.g. glass, ceramics, metals, wood and plastics [5-7], taking also into account their varying size and topology [8, 9]. In essence, the process of deposition is based on electrostatic attraction and can be used with various reagents such as polymers, nanoparticles, metals, dyes, quantum dots and nanotubes [10-15] , biomolecules such as enzymes [16] and proteins [17], etc. In this technique, a charged substrate is alternatively immersed into polyanion and polycation solutions to build up a multilayer coating. The electrostatic attraction that exists between the oppositely charged molecules in every monolayer allows the formation of the layers and hence allows for creating a greater coating thickness with potentially greater sensitivity than a single layer. An important application of the electrostatic self-assembly (ESA) technique is in its use to functionalize an optical fibre for optical recognition purposes [18]. However, active indicators must be used as sensitive films. Changing the optical properties of such sensitive films with changing analyte concentration is based on a recognition measurement. For instance, the variation in parameters such as the refractive index [19-21], absorbance [11, 13], reflected optical power [20], transmitted power [21] and the wavelength at maximum absorbance [22] are several examples of such optical properties. To date, in most of the pH sensors developed, their sensitivity has been determined through intensity-based measurement which can be prone to error. However, in this work, the design and characteristics of a wavelength-dependent pH optical sensor have been studied and reported. This allows the sensor mechanism to be independent of any
Fibre Optic pH Sensor Using Optimized
Layer-by-Layer Coating Approach
Nahid Raoufi
a,b, Frederic Surre
b,
Member, IEEE
, Muttukrishnan
Rajarajan
b,
Member, IEEE,
Tong
Sun
band Kenneth T.V.Grattan
b,
So far, a limited numbers of pH indicator materials such as neutral red, methylene blue and prussian blue have been deposited onto optical fibres to create pH sensors [12, 13, 23]. In the present study, brilliant yellow was applied as an indicator because of the greater wavelength shift seen with pH change, compared to the use of other indicators. This work also builds on previous research by the authors [9, 24] but in this case is novel in focusing particularly on key fabrication parameters and including studies of the effects and influence of the concentration of the indicator, the fibre core diameter and the bending radius of the fibre that was used. The wavelength shift and the sensitivity of the probes prepared in this work – the key measurand-related parameters – demonstrate the value of this approach and the important sensitivity achievable. The work provides a framework for the optimization of the design and structure for the pH sensor, where key information on mentioned parameters have been investigated and data on the influence on the sensor performance are reported.
II. MATERIAL AND METHODS
A. Chemicals
In order to create an effective optical pH sensor, brilliant yellow (BY) was selected as the pH indicator to be used, as discussed earlier. This molecule is negatively charged and can be used as a polyanion. It demonstrates an important and significant colour change – from yellow (at pH 6.4) to red-orange (at pH 8.0) while the pKa is 7.2 and shows a peak at a wavelength of 497nm in the UV-visible region. This indicator dye was prepared from Sigma-Aldrich Poly (allylamine hydrochloride) [PAH] with an average molecular weight (MW) ~15000 and supplied by Sigma-Aldrich. PAH is a positively charged molecule and was used as a polycation.
B. Fabrication of the sensors
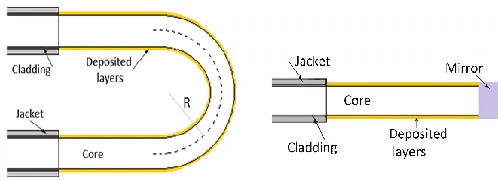
To design and develop the sensor probe, a silica multimode fibre with a core diameter of 1mm and cladding thickness of 10mm was used, as supplied by Thorlabs. To create a straight evanescent sensor, the distal end of the fibre was stripped of the jacket coating and the fibre was polished with 5 µm, 3 µm, 1 µm and 0.3 µm stone-papers respectively to achieve a smooth finish. As the cladding is acetone soluble, it was removable easily. To create an evanescent field U-bend sensor, a part of the fibre also was stripped of its jacket and cladding. A flame was then applied to soften the glass, so that if required the fibre could be slowly bent to create the U-shape, following which the fibres was cleaned and the surface functionalized. Following that the bare core was soaked in piranha solution (a 30:70 (v/v) mixture of H2O2 (30%) and concentrated H2SO4) for 60 minutes to produce the negatively charged surface and it was then rinsed in distilled water. To reflect the radiated light back and guide it to the other end of the fibre in the straight probe, a mirror was created at the tip of the fibre. Both fibres were then coated with positively charged molecules. The layer-by-layer technique used is based
dipped into the polycation solution for 5 minutes. As a result, a thin layer of the positive molecules was adsorbed onto the surface. Following that, the fibre was then dipped into distilled water for 5 minutes to remove any unbounded molecules from its surface and the substrate was alternately placed into the polyanion solution for another 5 minutes which further allowed any unbound molecules to be washed out, again using distilled water. This procedure was repeated and as a result a multilayer coating was built up. To improve the stability of the film and to avoid progressive degradation of the indicator, the coated substrate was cured at 120°C for 4 hours.
C. Experiment
To study the performance of the sensors which had been prepared by building up the layers of the pH indicator on the glass core of the optical fibre and to optimize the conditions for the use of the sensor, a number of key parameters such as the number of bilayers used (one layer of Brilliant Yellow and one layer of PAH constitutes a bilayer), the concentration of the Brilliant Yellow indicator, the size of the core and the shape of the fibre were examined. The concentration of the PAH solution (in 150mM saline solution) was identical at 2.5mM for all samples considered, while two different concentrations for the BY solution (in 150mM saline solution) were examined, these being 0.25 mM and 0.5 mM. The sensing length was 22mm for both the U-bend and the straight probes while radii of the U-bend probes were different, at 1.15mm and 1.55mm. These two configurations shown in Fig. 1.
[image:3.612.318.567.433.523.2]The layer-by-layer technique was employed to coat the uncladded silica core of all the probes alternately with PAH and BY. The probes thus prepared were tested and evaluated in buffer solutions of known pH over the range from 6.6 to 9.4. To measure the absorbance spectra of the coated optical fibre, an experimental setup was designed and developed for the purpose, as demonstrated in [24] and shown schematically in Fig. 2. Measuring the absorbed light as a function of wavelength for different pH buffer solutions using a spectrophotometer gave a series of spectra. Following that, the wavelength of the maximum of each graph was plotted with respect to pH so that the generated graph was seen to obey the appropriate Dose-Response curve.
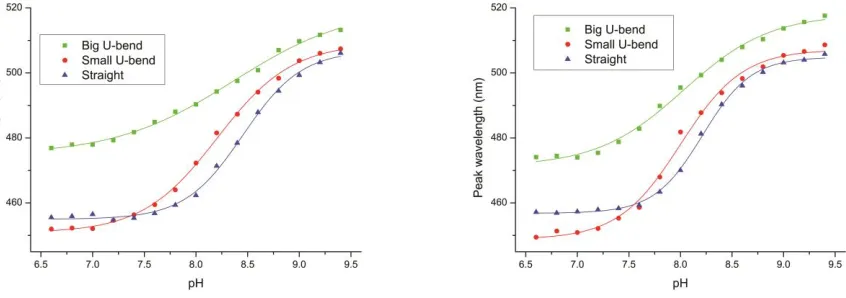
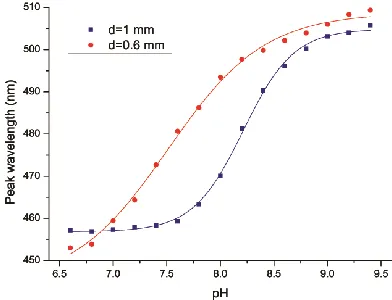
Fig. 4 The peak wavelength for each spectrum with respect to pH for probes with different shapes and different concentrations of BY solution. (CBY is 0.5 mM for the left graphs and is 0.25 mM for the right graphs)
In addition, layers of PAH and BY were built up on the straight optical fibre (with 600µm core diameter) using a range of different bilayers (numbered here from 3.5 to 9.5) such that probes with whole numbers of layers end with BY whereas those with fractional (decimal) numbers of bilayers end with PAH. Fig. 3 shows the performance of the probe for even numbers of layers and odd numbers of layers separately. The conclusions obtained from the respective Dose-Response
[image:4.612.87.515.365.492.2]graph for every probe are summarized in Table 1. Two series of experiments were carried out on U-bend and straight probes (of which the core diameter was identical at 1000µm), and the concentration of the BY solutions was varied from 0.25 mM to 0.5 mM. Six double layers of (PAH/BY) were built up on the glass core. Having examined the probes in the pH buffer solutions, the Dose-Response graphs were plotted and these are shown in Fig.4.
Fig. 2 The experimental set up for straight probes (left) and U-bend probes (right).
[image:4.612.82.505.538.687.2]DOSE-RESPONSECURVEPROPERTIESFORTHEPREPAREDPROBES.
Probe
Code Shape
Core diameter (m)
CBY
(mM)
Number of bilayers (n)
pH at inflection point (pKa)
gradient in the inflection point
Adj. R-square
Wavelength
Wavelength shift/0.2 pH units
pH units/nm at pH 7 at pH 9
P01
St
ra
ig
ht
600 0.25 3.5 7.962 119.868 0.998 457.284 494.777 3.7493 0.0533
P02 “ “ 4 7.686 128.224 0.997 461.663 499.709 3.8046 0.0525
P03 “ “ 5 7.649 150.724 0.996 457.307 497.145 3.9838 0.0502
P04 “ “ 5.5 7.743 177.610 0.994 462.964 504.788 4.1824 0.0478
P05 “ “ 6 7.565 148.703 0.996 459.446 505.983 4.6537 0.0429
P06 “ “ 6.5 7.813 155.845 0.998 467.875 512.642 4.4767 0.0446
P07 “ “ 7.5 7.831 127.530 0.999 471.787 513.819 4.2032 0.0475
P08 “ “ 8 7.708 126.514 0.996 471.848 511.323 3.9475 0.0506
P09 “ “ 8.5 7.842 89.201 0.996 482.971 514.097 3.1126 0.0642
P10 “ “ 9 7.722 85.397 0.998 487.284 515.204 2.792 0.0716
P11 “ “ 9.5 7.872 82.238 0.999 491.61 517.367 2.5747 0.0776
P12 1000 “ 6 8.215 203.929 0.998 457.341 503.176 4.5835 0.0467
P13 “ 0.5 6 8.456 183.690 0.997 456.52 499.31 4.279 0.0436
P14
U
-b
en
d R=1
.5
5mm
“ 0.25 6 8.030 111.826 0.994 474.01 513.7 3.969 0.0629
P15 “ 0.5 6 8.360 79.361 0.996 477.968 509.777 3.1809 0.0504
P16
R
=1
.1
5mm
“ 0.25 6 8.000 193.694 0.994 450.94 505.396 5.4456 0.0387
P17 “ 0.5 6 8.206 161.422 0.998 452.134 503.76 5.1626 0.0367
III. RESULTS AND DISCUSSION
To date, the sensitivity of most of the pH sensors developed has been estimated through designs involving intensity-based measurements. However, the present study was designed to use wavelength change as the key measurand and to optimize the wavelength-dependent pH sensor so that it offered high resolution and sensitivity, with it being fabricated by using the layer-by-layer technique. To do so allows the sensor to function effectively independently of any source variations or other system perturbations than pH change and this is seen as a major advantage. The wavelength shift can be demonstrated by the slope of Dose-Response graph and is the basis of the index for sensitivity used. The inflection point in the Dose-Response graph demonstrates the pKa of the thin film, which is a function of the degree of ionization, revealing the pH at which 50% of the thin film functional groups are ionized [25]. The pKa is given by –log10Ka where Ka is the acid dissociation constant which is the equilibrium constant of the dissociation reaction in the context of the acid-base reaction, in which an acid is ionized reversibly into its conjugate base and the hydrogen ion. As Choi has illustrated in the literature [25] the effective pKa of a polyelectrolyte substantially differs from solution state value when incorporated into a multilayer film.
Reviewing the device response to wavelength change, the sensitivity of the probes is limited, but significant over the pH
range from pH 7 to pH 9, for almost all probes used which were coated with PAH/BY. In this pH range the wavelength shift is clearly measurable, demonstrating that the wavelength shift can be considered as an effective index for sensitivity. Two main properties are discussed in this section; the sensitivity and pKa. In all the experiments carried out, changing the nature of the coating (comprising of components which are active at a specific wavelength) changes the performance of the probes. Changing key factors such as the number of bilayers used, the thickness of these layers and the number of molecules (the density) constituting the layers (resulting from changing the concentration of the polyelectrolyte solution) and also the shape of the probe causes a change in the polarity of the micro-environment and thus the measurements made with the probe, allowing for the optimization of the device sensitivity.
A. Number of layers
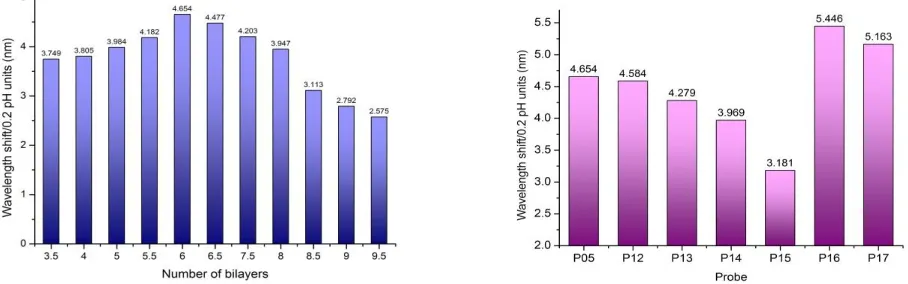
wavelengths once the number of bilayers increases. However, it can be seen that the slopes of graphs are decreasing where from the slope of the Dose-Response graph, the inflection point for the P01 probe can be determined to be 119.9nm/pH unit. This figure increases proportionately with the number of bilayers to a maximum 177.6nm/pH unit, for a probe with 5.5 bilayers. However, the probe with 6 bilayers shows a sensitivity that then decreases, with a slope of 148.7nm/pH unit. For all probes with increasing numbers of bilayers beyond this there is a downward trend, as shown in Table 1 (the rate of reduction of the slope for the last three probes is somewhat less than for the others). A simple comparative measure can be seen in the average wavelength shift for 0.2 pH units – this varies from 2.58 nm for probe P11 to 4.65nm for probe P05 and the highest recorded sensitivity (measured in terms of wavelength shift recorded) is 0.043 pH units for probe P05, with the lowest value of sensitivity seen being 0.078 pH units for the probe P11. The conclusion that can be drawn is that increasing the number of bilayers does not necessarily increase the sensitivity and, in addition, the sensitivity can even decrease when the number of bilayers on the fibre is further increased. Fig. 5 confirms that there is a continuous reduction in the sensitivity for probes ranging from P06 to P11, with a dramatic decline in sensitivity for the probes from P08 to P11. Probes with fewer than 5 bilayers are not as sensitive as the probes labeled P04, P05 and P06. This may arise due to the lower stability of the layers as the thin film may not be sufficiently stable in cases of both very high and very low thickness values, as is verified in the literature [20, 26].
In spite of the fact that all the probes considered
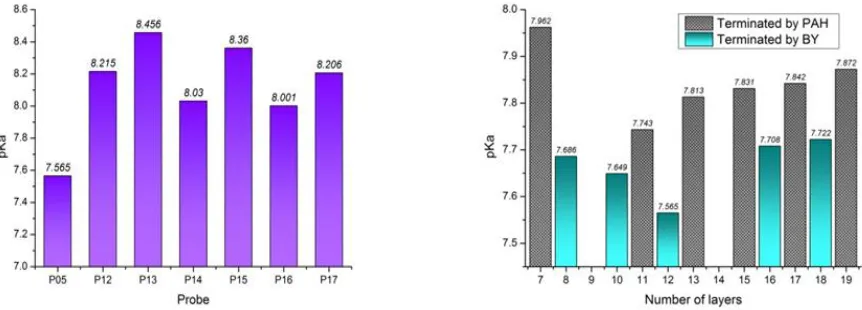
demonstrate their peak sensitivity in the pH range 7 to 9, they do not have the same inflection point and, as a result, show the same pKa and Table 1 shows that the value of pKa varies from one probe to another. The outer layer in the thin film directly affects the measured pKa; overall, the measurement made using a thin film terminated with a PAH shows a slightly higher pKa under the same conditions, when compared to a probe terminated with BY, as shown in Fig. 7. The PAH film
is individually applied as a pH indicator [13, 22, 25] for which the value of pKa is reported to be between 8.0 to 8.8 [25, 27-29], where the reported pKa value for BY is 7.2 [30]. The pKa for the multilayer probe lies between pKa values obtained with the PAH and BY and this is shown in the data recorded in Table 1 for a series of experiments carried out. The average measured value of pKa for an odd number of layers (where the PAH is the outer layer) is 7.8 whilst for an even number of layers (where the BY is outer layer) is 7.7. However, an interesting observation is that the measured pKa value for both the odd and even number of layers decreases with an increase in the thickness of the thin film from 5.5 to 6 bilayers, whilst beyond this the measured pKa value starts to rise with an increasing number of bilayers. This means that the sensitivity of the probes slightly shifts to the alkaline region when more layers are deposited onto the fibre. In addition, when the PAH material is applied as the outer layer, the pKa of the multilayer film rises to reach a higher level; in other words, when there is one more layer of PAH than of BY, the probe shows greater sensitivity in the alkaline region because of higher association constant of the PAH compared to the BY.
B. Shape of the probe
A series of experiments was carried out with the probes constructed using 1000µm core diameter and different shapes; both straight and U-bend with two different radii of 1.15mm and 1.55mm, as seen in Fig. 1. The performance of these probes is summarized in Fig.4 and Fig. 5 confirms that the two different sizes of the U-bend probes developed and fabricated demonstrate two different levels of sensitivity: the sensitivity of the larger radius (‘big’) U-bend not only is not as large as
the sensitivity of the smaller radius (‘small’) U-bend – but it is also less than that of the straight probe. As is seen in Fig. 5, probes P14 and P15 have the least sensitivity when compared to other probes. Further, probes P16 and P17 display the greatest sensitivity with 5.45 and 5.14 nm wavelength shift for just 0.2 pH units. The observation of decreasing sensitivity with increasing probe bend diameter has been discussed in a number of research papers [3, 31, 32]. However by contrast, it
is also been reported in other work [1, 33, 34] that there is an increasing sensitivity with probe bend diameter. Clearly in this body of work there are other factors at work than the probe bend diameter to influence the overall sensitivity of the system and the bending of the fibre plays a relatively minor role. The results obtained from this study show that the sensitivity of the sensor does not necessarily increase when the probes are bent into a U-shape with the obvious attempt through that geometry to increase the interaction between the optical wave and the analyte in the sensing region [33-35]. A further approach to achieving this is to coat the distal end of a straight fibre with a mirror surface, as was also done in this study. In addition, Klepáček has shown in [36] that the gradient of refractive index of the core and the coated layers are effective parameters in optimizing the interaction of the light with the material, in addition to the effect of the radius of the bend and the fibre overall diameter. The interaction region in the U-bend probe is typically greater than for the straight probe, as the slope (measured at the inflection point) for the straight probes are 203 nm/pH unit and 184 nm/pH unit – this is seen to reduce in the cases of the ‘small’ and ‘big’ U-bend probes. Nonetheless, regardless the concentration of the BY solution used, the straight probes show the highest sensitivity in the pH range between 7.6 to 9.0, whereas the U-bend probes show a slightly wider range of sensitivity (from around
pH 7.0 to 9.0). The values of pKa (compared later in Fig. 7) also show that the straight probe shows the highest measured value while the ‘small’ U-bend probes have lower values of pKa, when compared to the ‘big’ U-bend probes. Comparing the situation overall where all the parameters are the same for all the probes, it would appear that by increasing the probe radius, the most sensitive region shifts to a higher pH region and hence in the extreme where the probe is effectively straight (an infinite radius), the region of maximum sensitivity tends towards the alkaline region.
C. Concentration of BY solution
[image:7.612.70.545.69.187.2]To study the effect of the concentration of the indicator solution on the sensor performance, polyanion solutions of two different concentrations were utilized. Fig. 6 shows a comparison of the performance of probes on which were deposited 6 bilayers of PAH/BY in which the BY concentration was 0.25 mM and then 0.5 mM, while the PAH concentration was 2.5mM for both probes. As the graphs show, increasing the concentration shifts the response towards the higher pH region. Thus, the probes prepared with the low concentration of BY are active at a higher wavelength, at a certain values of pH. For instance, the U-bend fibre probes using 0.25mM of BY solution is the basis of a device
[image:7.612.81.512.554.709.2]Fig. 7 The value of pKa for each probe versus number of layers (right) and shape of the probes at different core diameters and concentrations of BY (left).
particularly sensitive for use over the pH range 7.2 to 9.0, while this most sensitive region is seen to move to the pH range 7.4 to 9.2 for similar probes prepared using 0.5mM of BY solution. This aligns with the pKa values stated in Table 1. As illustrated by Table 1 and Fig. 7, the value of pKa increases when the concentration of BY is increased and the sensitive area moves towards the more alkaline i.e. the value of pKa increases from 0.21 for the ‘small’ U-bend probe to 0.36 for the ‘big’ U-bend. For the straight probe, this quantity also shifts by 0.25 towards the alkaline region. Considering the data shown in Fig. 5 and Table 1, the sensors prepared with the lower concentration of BY show higher slopes of the Dose-Response graphs, consequently demonstrating higher sensitivity. Thus an enhancement of the sensitivity can be achieved by either decreasing the number of bilayers or lowering the concentration of the indicator solution.
D. Fibre core diameter
To determine the effect of the optical fibre core diameter on the probe performance, experiments were carried out on probes fabricated from fibre of two different core sizes. Fig. 8 shows a comparison of the performance of these two fibre optic sensors deposited with 6 bilayers of PAH/BY while the concentration of BY solution was maintained at 0.25mM for both probes. As can be seen in the figure, the sensitivity of the sensor fabricated from 1mm core diameter fibre is limited over pH values from pH 7.6 to pH 9.0, when compared to the sensor using narrow core fibre for which the sensitivity is optimal over the wider range from pH 6.6 to pH 9.2. Considering the slope at the inflection point from Table 1, the probe fabricated with the narrow fibre displays a lower slope than does that with the greater fibre diameter. However, the average wavelength shifts for a sample of 0.2 pH units (in the region from pH 7 to pH 9) is 4.65 and 4.28 for the probes using the narrow and the large core fibres respectively, as shown in Fig. 5. Thus although the narrow core fibre can give a satisfactory sensitivity over a wide pH range, the large core fibre enables a more sensitive device, over a smaller pH range
to be created – this also showing a greater slope and higher resolution for the higher pH region. In contrast, Khijwania showed in work published in the literature [37] that an enhanced sensitivity is achieved by decreasing the core size. Referring to Fig. 7 and comparing the value of pKa for different probes, P05 demonstrates a value of 7.57 for the pKa, while for P12 it rises to 8.22. Hence the larger diameter probe can create a sensor working efficiently, but over a small pH range centred around a value of 8.2. On the other hand, examining the region from pH 7 onwards, at the same pH values, the sensor with the narrow fibre core operates at a higher wavelength value.
IV. CONCLUSION
In this study, the design and performance of a number of pH-sensitive probes using brilliant yellow as the pH indicator, with PAH being utilized as a cross-linker, were studied and evaluated. Having recorded absorbance spectra as a function of wavelength for each probe at different buffer pH solutions, for each a Dose-Response graph from the peak wavelength points was created and studied. The key design parameters such as the number of bilayers, the shape of the probe, the concentration of the indicator solution and the core diameter of the optical fibre used were all studied and their effects on performance evaluated.
Key finding to emerge to optimize the device sensitivity include:
Those probes with 5 to 6 bilayers demonstrated the best performance. It has also been observed that the sensitivity of the probes improves with an increasing number of bilayers (optimizing typically at about 5 to 6 bilayers) and beyond this a reduction of sensitivity occurs with an increasing number of bilayers.
The sensitivity can be enhanced by curving the fibre to a U-shape – in this case with a smaller radius for better performance. A lower sensitivity was observed for a larger curve radius, by comparison to the performance of a ‘straight’ sensor.
With only two samples available in this work (at concentrations of (0.25 and 0.5 mM)) it would appear that further improvement in sensitivity would be achieved where the concentration of the indicator solution was lower. For a higher concentration (of BY solution), the devices are less sensitive. However this needs further exploration with a wider range of samples of different concentrations.
In addition, a design utilizing a narrow core fibre leads to a sensor with a wider sensitivity range, compared to larger core fibre. With this design, a highly sensitive sensor but working over a smaller pH range and with a sharper slope and higher resolution is seen.
[image:8.612.67.263.535.685.2]The second major finding was that pKa value varies from one probe design to another.. The pKa slowly rises with an
thin film also clearly influences the pKa value. Thus in summary:
Increasing the number of layers inclines the sensitivity towards higher pH and the more alkaline region.
‘Straight’ probes work best in the more alkaline region compared to U-bend probes
For probes with a bigger radius the value of pKa tends to slightly higher values.
In addition, the role of the concentration of the BY solution must be considered since preparing the sensors with a low concentration of BY leads to lower pKa values while the sensors prepared with higher concentration of polyanion solution work best in the higher pH region due to higher pKa values.
ACKNOWLEDGMENT
This work was supported by scholarship from City University London and Islamic Azad University- South Tehran Branch.
REFERENCES
[1] M. Fabian, E. Lewis, T. Newe, S. Lochmann, and I. Mueller, "Investigation of ethanol and methanol water mixtures in the visible wavelength area using fibre-optic evanescent field absorption sensors based on a U-shaped, a coil-shaped and a meander-shaped probe," in
IEEE Sensors Applications Symposium Atlanta, GA, 2008.
[2] A. Armin, M. Soltanolkotabi, and P. Feizollah, "On the pH and concentration response of an evanescent field absorption sensor using a coiled-shape plastic optical fiber," Sensors and Actuators A vol. 165, pp. 181-184, 2011.
[3] B. D. Gupta and N. K. Sharma, "Fabrication and characterization of U-shaped fiber-optic pH probes," Sensors and Actuators B vol. 82, pp. 89-93, 2002.
[4] F. Wassmann, "Modal field analysis of circularly bent single-mode fibers," JOURNAL OF LIGHTWAVE TECHNOLOGY, vol. 17, pp. 957-968, 1999.
[5] G. Decher, "Fuzzy Nanoassemblies: Toward layered polymeric multicomposites," SCIENCE, vol. 277, pp. 1232-1237, 1997.
[6] F. J. A. Ignacio R. Matias, Richard O. Claus, Kristie L. Cooper, "Molecularly Self-Assembled Optical Fiber Sensors," IEEE, pp. 198-202, 2002.
[7] O. Mermut and C. J. Barrett, "Stable sensor layers self-assembled onto surfaces using azobenzene-containing polyelectrolytes," Analyst, vol. 126, pp. 1861-1865, 2001.
[8] G.Decher, J.D.Hong, and J.Schmitt, "Buildup of ultrathin multilayer films by a self-assembly process: III. Consecutively alternating adsorption of anionic and cationic polyelectrolytes on charged surfaces," Thin Solid Films, vol. 210/21 I, pp. 831-835, 1992.
[9] F. Surre, W. B. Lyons, T. Sun, K. T. V. Grattan, S. O’Keeffe, E. Lewis, C. Elosua, M. Hernaez, and C. Barian, "U-bend fibre optic pH sensors using layer-by-layer electrostatic self-assembly technique," Journal of Physics: Conference Series, Sensors & their Applications XV, vol. 178, pp. 1-4, 2009.
[10] S. Kaul, S. Chinnayelka, and M. J. McShane, "Self-Assembly of Polymer/Nanoparticle Films for Fabrication of Fiber-Optic Sensors Based On SPR," in Optical Fibers and Sensors for Medical Applications IV, Bellingham, WA, 2004.
[11] S. K. Suguru Kodaira, Seung-Woo Lee, William J. Batty, Stephen W. James, Ralph P. and Tatam, "Fabrication of Highly Efficient Fibre-Optic Gas Sensors Using SiO2/Polymer Nanoporous Thin Films," in
3rd International Conference on Sensing Technology, Tainan, Taiwan, 2008.
Sensor," ANALYTICAL SCIENCES vol. 22, pp. 1117-1119, 2006. [13] J. Goicoechea, C. R. Zamarre˜no, I. R. Mat´ıas, and F. J. Arregui,
"Optical fiber pH sensors based on layer-by-layer electrostatic self-assembled Neutral Red," Sensors and Actuators B: Chemical vol. 132, pp. 305-311, 2008.
[14] F. J. A. Gonzaga de Bastida, Javier Goicoechea, Ignacio R. Matias, "Quantum Dots-Based Optical Fiber Temperature Sensors Fabricated by Layer-by-Layer," IEEE SENSORS JOURNAL, vol. 6, pp. 1378-1379, 2006.
[15] K. J. Loh, J. P. Lynch, and N. A. Kotov, "Passive wireless strain and pH sensing using carbon nanotube-gold nanocomposite thin films," in
Sensors and smart structures, technologies for civil, mechanical, and aerospace systems San Diego, California, USA 19-22 March 2007, pp. 652919.1-652919.
[16] J. u. M. Corres, A. Sanz, F. J. Arregui, I. R. Mat´ıas, and J. ı. Roca, "Fiber optic glucose sensor based on bionanofilms," Sensors and Actuators B vol. 131, pp. 633-639, 2008.
[17] I. D. Villar, I. R. Matias, F. J. Arregui, and J. M. Corres, "Fiber optic glucose biosensor," Optical Engineering, vol. 45, pp. 104401-1-104401-6, 2006.
[18] J. B. S. G. Decher, Multilayer Thin Films: Wiley-VCH Verlag GmbH & Co., 2002.
[19] J. G. D Viegas, J M Corres, J L Santos, L A Ferreira, FMAra´ujo and I R Matias, "A fibre optic humidity sensor based on a long-period fibre grating coated with a thin film of SiO2 nanospheres," MEASUREMENT SCIENCE AND TECHNOLOGY, vol. 20, pp. 1-4, 2009.
[20] I. R. M. Ignacio Del Villar, Francisco J. Arregui, Richard O. Claus, "ESA-Based In-Fiber Nanocavity for Hydrogen–Peroxide Detection,"
IEEE TRANSACTIONS ON NANOTECHNOLOGY, vol. 4, pp. 187-193, 2005.
[21] I. R. Matias, F. J. Arregui, J. M. Corres, and J. Bravo, "Evanescent field fiber-optic sensors for humidity monitoring based on nanocoatings,"
IEEE SENSORS JOURNAL, vol. 7, pp. 89-95, 2007.
[22] C. R. Zamarre˜no, M. Hernáez, I. D. Villar, I. R. Matías, and F. J. Arregui, "Optical fiber pH sensor based on lossy-mode resonances by means of thin polymeric coatings," Sensors Actuat B-Chem vol. 155, pp. 290-297, 2011.
[23] C. R. Z. n. J. Goicoechea, I.R. Matias, F.J. Arregui, "Utilization of white light interferometry in pH sensing applications by mean of the fabrication of nanostructured cavities," Sensors and Actuators B vol. 138, pp. 613-618, 2009.
[24] N. Raoufi, F. Surre, T. Sun, M. Rajarajan, and K. T. V. Grattan, "Wavelength dependent pH optical sensor using the layer-by-layer technique," Sensors and Actuators B: Chemical, vol. 169, pp. 374-381, 2012.
[25] M. F. R. Jeeyoung Choi, "Influence of the Degree of Ionization on Weak Polyelectrolyte Multilayer Assembly," Macromolecules, vol. 38, pp. 116-124, 2005.
[26] I. R. M. Ignacio Del Villar, Francisco J. Arregui, "Fiber-Optic Chemical Nanosensors by Electrostatic Molecular Self-Assembly,"
Current Analytical Chemistry, vol. 4, pp. 341-355, 2008.
[27] M. M. Fang, C. H. Kim, G. B. Saupe, H. N. Kim, C. C. Waraksa, T. Miwa, A. Fujishima, and T. E. Mallouk, "Layer-by-layer growth and condensation reactions of niobate and titanoniobate thin films,"
Chemistry of Materials vol. 11, pp. 1526-1532, 1999.
[28] H. Ochiai, Y. Anabuki, O. Kojima, K. Tominaga, and I. Murakami, "Dissociation of poly(allylammonium) cations in salt solutions,"
Journal of Polymer Science Part B: Polymer Physics, vol. 28, pp. 233– 240, 1990.
[29] A. I. Petrov, A. A. Antipov, and G. B. Sukhorukov, "Base-acid equilibria in polyelectrolyte systems: From weak polvelectrolytes to interpolyelectrolyte complexes and multilayered polyelectrolyte shells,"
Macromolecules, vol. 36, pp. 10079-10086, 2003.
[30] R. W. Sabnis, Handbook of acid-base indicators: Taylor & Francis Group, 2008.
[31] P. Nath, "Enhanced sensitivity fiber-optic sensor with double pass evanescent field absorption," MICROWAVE AND OPTICAL TECHNOLOGY LETTERS, vol. 51, pp. 3004-3006, 2009.
[32] B. D. Gupta, H. Dodeja, and A. K. Tomar, "Fibre-optic evanescent field absorption sensor based on a U-shaped probe," Optical and Quantum Electronics, vol. 28 pp. 1629-1639, 1996.
[34] P. K. Choudhury and T. Yoshino, "On the pH response of fiber optic evanescent field absorption sensor having a U-shaped probe: An experimental analysis," Optik vol. 114, pp. 13-18, 2003.
[35] S. K. Khijwania, K. L. Srinivasan, and J. P. Singh, "An evanescent-wave optical fiber relative humidity sensor with enhanced sensitivity,"
Sensors and Actuators B, vol. 104, pp. 217-222, 2005.
[36] R. Klepáček and L. Kalvoda, "Monte Carlo simulation of light propagation in U-bent optical fiber," in Optical Sensors 2011; and Photonic Crystal Fibers V, 2011.
[37] S. K. Khijwania and B. D. Gupta, "Fiber optic evanescent field absorption sensor: Effect of fiber parameters and geometry of the probe," Optical and Quantum Electronics, vol. 31, pp. 625-636, 1999. Nahid Raoufi received her BSc and MSc degree in chemical engineering from Sharif University of Technology and Azad University, Tehran, Iran, in 1992 and 1997 respectively. She is currently working toward PhD degree on Instrumentation and Measurement in City University London.
She joined to Azad University as a lecturer in chemical engineering in 1997 where she is now funded for her PhD. During years 2003 to 2008 she has collaborated with ERI as a researcher and project manager, and has done some projects in nanostructured materials synthesis and the design and construction of photoreactor for waste-water treatment.
Frederic Surre received the BEng, Msc and PhD in Electronic Engineering from INPT-ENSEEIHT, Toulouse, France in 1998, 1998 and 2003 respectively. In 1998, Frederic was a Research Engineer with ENSAE, France, where he was responsible for opto/microwave measurements. In 2004, he joined Trinity College’s School of Physics, and Dublin City University’s RINCE, Ireland. His research interests included photonic devices for all-optical communications and generation and guiding of Terahertz waves. In 2008, he joined City University London to work on optical and terahertz sensors for structural health monitoring. He is vice-chairman of the IEEE Instrumentation and Measurement Technical Committee 16.
Tong Sun was awarded the Doctor of Engineering from Harbin Institute of Technology, China in 1998 and PhD from City University London, London, UK, in Applied Physics in 1999. She was an Assistant Professor at Nanyang Technological University in Singapore from year 2000 to 2001 before she rejoined City University in 2001, as a Lecturer. She was promoted to a Senior Lecturer in 2003, a Reader in 2006 and a Professor of Sensor Engineering in 2008 at City University, London. She has authored or co-authored some 180 scientific and technical papers.
Muttukrishnan Rajarajan is a Professor in the Sensors and Instrumentation Centre at City University London. He completed his PhD in the area of numerical modelling of optical devices and sensors at the same centre in 1999. Since 2002 he has been actively researching in the areas of biosensors, nanowires and biophotonics. He has published more than 150 international journal and conference papers and is a regular reviewer for IEEE, Elsevier and OSA journals. He is also on the editorial board of several international journals and is on the technical programme committee of several well-known conferences.
Kenneth T.V.Grattan graduated in Physics from Queen’s University Belfast with a BSc (First Class Honours) in 1974, followed by a PhD in Laser Physics. Following a period as Research Fellow at the Imperial College of Science and Technology to work on advanced photolytic drivers for novel laser systems, he joined City University in 1983, being appointed Professor of Measurement and Instrumentation and Head of the Department of Electrical, Electronic and Information Engineering in 1991. His research interests have expanded to include the use of fibre optic and optical systems in the measurement of a range of physical and chemical parameters. He obtained a DSc from City University in 1992 for his work in sensor systems and was appointed Dean of the School of Engineering & Mathematical Sciences Informatics in 2008. In the same year he was elected to the Fellowship of the Royal Academy of Engineering. In 2012 he became Dean of the City Graduate School.