Smart Frequency Control
for the Future GB Power System
Peter Wall
Negar Shams,
Vladimir Terzija
The University ofManchester Manchester, UK
Vandad Hamidi
Charlotte Grant
National Grid Warwick, UK
Douglas Wilson,
Seán Norris
Kyriaki Maleka
Alstom Grid Edinburgh, UK
Campbell Booth,
Qiteng Hong,
Andrew Roscoe
The University ofStrathclyde Glasgow, UK
Abstract—Replacing fossil fuel burning synchronous generation
with asynchronous renewable generation to deliver environmental goals will significantly reduce system inertia. Reduced inertia allows a faster and larger frequency deviation after a disturbance and the reduction in inertia in GB will be significant enough in the next decade that the existing frequency control will be too slow to contain the frequency deviation after a large disturbance. Therefore, delivering fast, coordinated frequency control from new service providers, e.g. energy storage, (termed “smart frequency control”) will be vital to overcoming the challenge posed by reduced/variable inertia in GB. This paper describes some of the challenges that must be overcome when delivering this form of control, in terms of controller design and the definition of a new ancillary service, alongside simulation results for a 36 zone equivalent model of the GB frequency response that illustrate these challenges and the threats posed by reduced inertia.
Index Terms-- frequency control, inertia, synthetic inertia, swing
equation, wide area control
I. INTRODUCTION
To help deliver the UK’s low carbon future, the GB power system will undergo significant decarbonisation of its generation portfolio [1]. Mostly, this will consist of non-synchronous renewable generation displacing non-synchronous thermal generation. The inertia of synchronous generation limits the initial frequency deviation after a disturbance. However, non-synchronous generation does not contribute inertia to the system, as its rotating mass (the source of inertia) is decoupled from the system (e.g. it is connected over a converter) or it has no rotating mass at all (e.g. PV). Therefore, system inertia will be reduced, e.g. GB inertia may be reduced by up to 45 % by 2024/25 [2] [3], which will result in a faster and larger frequency deviation for any disturbance. This threatens the success of the existing frequency control. The faster, larger deviation in frequency in a reduced inertia system can be corrected by contracting a larger volume of conventional governor response from the remaining synchronous generation; this would not limit the larger initial RoCoF, but would reduce the RoCoF with time and thereby limit the frequency deviation.
However, this would increase the cost of frequency control in GB by £200m – £250m by 2020 [4]. Furthermore,
the delayed response of conventional governors (in GB the response typically starts 2 seconds after the initiating event) means that, as inertia is further reduced, they will eventually be unable to prevent an unacceptable frequency deviation, regardless of the volume of response. An alternative to this is the creation of new control services that release additional power into the system more quickly than conventional services. This does not limit the initial RoCoF, but reduces the size of the frequency deviation (when compared to the same amount of conventional response), as the RoCoF will be reduced sooner and this will allow secure system operation for lower inertia. However, the faster release of additional power can put greater stress on the power system, particularly transient angular-stability. To address this, the additional power must be deployed in proportion to both the severity of the initiating event and the proximity to this event. These fast frequency control services are enabled by new tools for managing power systems in real time (e.g. wide area monitoring [5][6] and control [7]). The coordination of these new services into a single wide area control response will allow the creation of smart frequency control that can be a cost effective solution for the threat of reduced inertia.
Demonstrating that this smart frequency control is possible in the GB system is the role of the Smart Frequency Control (SFC) project [4] that is funded as part of the Network Innovation Competition (NIC) in GB under the principle name of Enhanced Frequency Control Capability. SFC will create a monitoring and control scheme that deploys a smart frequency control response based on regional measurements of RoCoF. SFC is led by National Grid in partnership with Alstom, Belectric, Centrica, Flexitricity, The University of Manchester and the University of Strathclyde.
This paper will present the importance of inertia to frequency control in Section II. Section III defines the concept of smart frequency control, introduces some of the challenges faced when attempting to develop a wide area controller that can deliver smart frequency and describes the testing facilities that will be used during the course of the project. Section IV describes how the finite energy available to most SFC resources will impact on the nature of the SFC response. Section V presents simulated examples for a 36 zone equivalent GB model using DIgSILENT PowerFactory to illustrate the threat of low inertia and some of the issues that have motivated the design of the SFC scheme. Section VI concludes the paper.
II. FREQUENCY CONTROL AND INERTIA
The inertia of a power system describes the kinetic energy stored in the rotating masses connected to the power system (e.g. synchronous generators and direct online motor loads). In the event of a power imbalance being created across the air gap of a machine (e.g. by a loss of generation elsewhere in the system) this stored energy is naturally and immediately used to temporarily eliminate this imbalance, e.g. by releasing some of the stored energy and slowing down. This relationship can be described using the second order swing equation [8]:
2 m e
d f
H P P
dt
(1)
where, H is the inertia constant in seconds, Pm is the per unit mechanical power applied to the shaft, Peis the per unit electrical power and f is the per unit frequency. Therefore, if the inertia is reduced the RoCoF will be larger after any given disturbance. Therefore, reduced inertia is a threat to frequency control, as it reduces the time available before the deviation will violate the security limits. Furthermore, in the future inertia will vary more significantly throughout the day (e.g. as the dispatch of wind generation varies with weather throughout the day) and across the system (e.g. some regions of the system will have higher penetrations of asynchronous generation than others. These temporal and regional variations will require frequency control to become more adaptive, as actions that are suitable for one time and region may be unsuitable for another time and region.
With an estimate of the inertia [9][10] and measurements of the RoCoF before and after the disturbance this equation can be used to estimate the size of active power disturbance that a system has experienced [11].
III. SMART FREQUENCY CONTROL PROJECT
A. Objective of the SFC Project
The objective of the SFC project is to develop and demonstrate a new regional monitoring and control system that will calculate and initiate the required rate and volume of rapid response. It will also demonstrate the viability of obtaining rapid response from new service providers.
The output of these technology trials will be used to support the development of appropriate commercial frameworks that will eventually support the emergence of new balancing services products. By developing an innovative technological solution in combination with new commercial frameworks the SFC project will allow newer generation technologies to effectively compete with existing technologies in the balancing services market.
Wide Area Control (WAC) is a logical extension of a Wide Area Monitoring System (WAMS) and the trials in SFC build upon the ongoing work of the NIC funded VISOR project, which is deploying the first complete GB WAMS to showcase the benefits of WAMS to business as usual in GB. However, WAC requires a significantly more robust communications network than WAMS, as delays can directly impact the quality of the control action. SFC will consider how these requirements can be met within the GB WAMS.
B. Definition of Smart Frequency Control
The changing nature of system inertia must be accommodated by changes to the frequency control of power systems. The control response must become:
faster, to quickly remove the increased RoCoF that arises from reduced inertia and thereby limit the magnitude of the frequency deviation;
more adaptive, to accommodate the daily/seasonal variation in the reduced inertia and the contrasting natures/availabilities of the new resources; and,
regional in nature, to accommodate the variations in inertia between different regions of the system (i.e. the regional nature of reduced inertia).
The concept proposed in SFC is a form of occasional frequency control that begins to act 0.5 seconds after a disturbance. The role of SFC is to detect a disturbance, quickly alleviate the post disturbance RoCoF and then prevent frequency collapse in reduced inertia systems by using the coordinated response of new service providers to manage the fast frequency deviation until the traditional primary governor response can overtake this management of frequency (primary response in GB begins within 2 seconds) . Note, that this form of response can help to remove the RoCoF more quickly but cannot reduce its maximum value immediately after the large disturbance (i.e. the maximum post-disturbance RoCoF will be unchanged by SFC). To deliver this fast response SFC will be sensitive to the RoCoF and not the deviation in frequency, as traditional non-emergency frequency control is (note, some SIPS and Adaptive UFLS are responsive to RoCoF).
SFC is anticipated to act within 0.5 seconds. Therefore, SFC assumes that, whilst system inertia is reduced, it is large enough to allow the system frequency to survive the first 0.5 seconds relying only on the natural inertial response.
C. Control Scheme Development
The SFC scheme must be designed to deliver a coordinated, fast frequency response from multiple new service providers for a low-inertia system. However, a number of challenges must be overcome by such a scheme:
The robust, fast and accurate measurement of RoCoF Distinguishing between a disturbance to the active
power balance and other power system events that cause large RoCoF and may initially appear to be disturbances to the active power balance (e.g. short circuits).
Balancing the need for wide area information and coordination against communication/computation delays and the volume of data traffic
Ensuring that inter-area and local oscillations after a disturbance do not cause an over/under response Delivering the coordinated response in the correct
regions to avoid reducing angular stability a) Overview of the SFC scheme
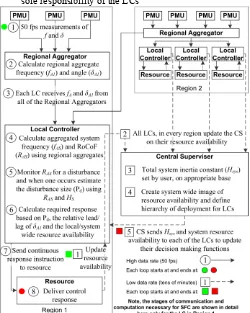
resources to deliver the fast control action, see Figure 1 for an overview of its operation, it is made up of:
Phasor Measurement Units (PMUs) to gather the raw frequency and phasor-angle data,
Regional Aggregators that combine the multiple steams of local frequency and angle data into a single stream that is representative of the aggregated frequency and angle behavior of the region of the power system Local Controllers (LCs) at each controllable resource
that act autonomously to detect a disturbance and deliver a control command to the resource, which can include windfarms, battery/PV, etc. The LC combines the aggregated frequencies and angles from each region into a single system frequency and angle and uses this to detect the disturbance and tailor its control response. Central Supervisor (CS), which performs a
[image:3.612.51.301.316.629.2]coordinating role for the scheme. The CS will communicate configuration information to the LCs based on its general oversight of the system such as the current resource portfolio information, which is envisaged to be updated in the order of minutes. It is not involved in any control decision making, which is the sole responsibility of the LCs
Figure 1: Diagram of the SFC scheme. The regions will have more than one controller, but only one is shown in Region 1 for the sake of clarity and only the communication to support this LC is shown.
b) Motivation for Distributed Control
A distributed control scheme, as shown in Figure 1, is proposed because it offers a robust control solution, whilst also minimizing the required data-bandwidth through the use of data-aggregation in the regional aggregators; minimizing
the effects of communication delays, by locating controllers close to resources; and providing graceful degradation of the scheme, where the loss of a single controller will not prevent the rest of the scheme from operating. The function of each element of the scheme and the general data flow within it can be separated into two data rates, i.e. slow (on the order of minutes or tens of minutes) and fast (the data rate of the PMUs, e.g. 50 frames per second). In Figure 2 this data flow and functionality is shown for only a single LC in region 1.
A fully centralized scheme would be prohibitively intensive on the communication network where each PMU would stream signals to a central controller, which must then issue control signals back to every controllable element. This is mitigated in a distributed scheme by way of the data-aggregation and, because each resource has a dedicated LC, there is a significantly shorter delay in sending the control signal to the resource.
However, the requirement for a local controller at every resource is a disadvantage of this distributed control. This will require a large number of local controllers to be installed and, for some resources, the cost of installing the controller may be prohibitive compared to the amount of revenue the resource may earn from participating in the scheme.
c) Benefits of Wide Area Monitoring of Frequency over Local Monitoring for disturbance detection
The magnitude of a disturbance to the active power balance is reflected in the magnitude of the RoCoF immediately after the disturbance, according to the swing equation (1). This means that the presence of a disturbance and its size could be detected using local measurements of the RoCoF and the estimate of the system inertia received from the central supervisor. However, this approach would face significant challenges due to local variations in frequency that may arise from local events. For example, faults and system oscillations can cause localized changes in frequency that, in the local data and the time frame available for SFC to act (0.5 seconds), may appear similar to a disturbance to the system wide power balance. Discriminating between disturbances to the active power balance and local events quickly and reliably using only local data is challenging and this limits the ability to use local measurements for detecting large system events.
Therefore, wide-area measurements are essential; as the aggregated frequency from each region minimizes the influence of local events and the aggregation of these regional frequencies allows the influence of inter area oscillations to be minimized. This aggregated system frequency is then used by the LCs to detect and respond to disturbances. This mitigates the risk of the LCs responding to local events.
d) Coordinating the Response of the Local Controllers to mitigate the potential impact of SFC on agular stability
to this must be incorporated into the scheme to mitigate the risk that SFC will increase the angular strain on the system. This solution consists of using the wide area angle measurements to identify the region where the disturbance occurred and then using this to target the SFC response and ensure it does not increase generation in regions of the system that are already accelerating away from the rest of the system.
D. Harware in the Loop Laboratory Testing
A flexible and thorough laboratory testing of Wide Area Control Systems is only possible using Hardware in the Loop testing. The Manchester Real Time Digital Simulator (RTDS) has 6 racks and 30 PB5 Processor Cards. One of the key challenges here is to create an appropriate GB system model in the RTDS, which is suitable for assessing the frequency response of the future GB system and is able to consider a range of different scenarios. Each scenario will have different penetration levels of asynchronous generation and consequently different system inertia. The specific challenges in the testing will be the suitability of the communication infrastructure and testing the simultaneous interaction of all service providers. The benefit of HiL testing is that it combines the flexibility of dynamic simulation with the need to incorporate the actual SFC hardware into the tests. The size of the Manchester RTDS will allow the study of a reduced model of a large, multi-region power system (to study the central supervisor and system wide aggregation) and a detailed model of one or two regions (to study the regional aggregators and local controllers).
E. Power Networks Demonstration Center (PNDC)
The PNDC consists of an outdoor compound containing overhead and underground 11 kV equipment and associated protection and control equipment. An LV network with a variety of programmable load banks is also available. Both the 11 kV and LV networks contain test points at which control, monitoring, protection and measurement devices can be directly connected. The facility also contains protection injection facilities, an industry-standard supervisory control and data acquisition (SCADA) system with control room, and an RTDS. For more details see [13][14]. The network can be operated in grid-connected mode or as an islanded system that is supplied via a motor-generator (MG) set with a variable speed drive. Decoupled mode will be used in the SFC project, see Figure 2 for the test set up.
This setup allows disturbances to be initiated both on the actual PNDC network, to emulate local events, and using the RTDS to emulate remote events in other regions, which will test the scheme’s regional response capability. Through the Power-Hardware in the Loop (P-HiL) simulation, the scheme’s response actions on the load banks can be fed back to the network so that the effects of the control actions on the system’s frequency can be observed. Communication emulators will also be used to investigate the impact of various levels of latency and jitter on the SFC scheme. Tests of operation under a wide range of frequency events and transients will be conducted, including tests to validate the scheme’s sensitivity and ability to identify events, its response to said events, and to test its ability to not react (i.e.
remain stable) for transient events (e.g. local short circuits) for which no response should be provided.
[image:4.612.342.527.149.261.2]The main benefit of using the PNDC is that it allows a wide range of tests to be conducted and maximizes the credibility of results, thereby increasing the learning from the exercise. Furthermore, it allows situations to be synthesized (e.g. very high RoCoF events, etc.) that may not typically be witnessed during a field trial.
Figure 2 The PNDC test set up will use an MG set to interface the physical PNDC network with an RTDS network model.
IV. SHAPING THE SFCRESPONSE
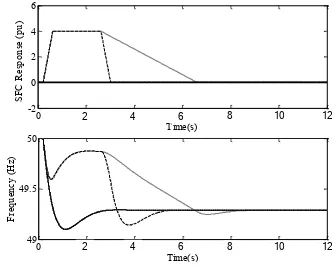
Delivering SFC requires the fast, coordinated control of a variety of service providers to shape the response required. This response can be separated into three phases 1) a fast ramp up of power output from service providers to arrest the frequency deviation 2) sustaining this power injection for a time to stabilize the frequency oscillations 3) a slow ramp down of the power injection to smoothly hand back responsibility for managing the frequency deviation to the primary governor response, see Figure 3. Without this ramp down SFC will simply delay the unacceptable deviation in frequency and not prevent it, see Figure 3. The rate of this ramp down must be coordinated with the primary control resources available, i.e. the fewer primary control resources available the slower the ramp must be. Equally, the required ramp up rate will be dependent on the inertia of the system, i.e. lower inertia will require a faster ramp up. Therefore, optimizing the procurement of SFC resources will not be possible in isolation; this procurement must consider the cost/availability of ‘real’ inertia and primary frequency control to ensure that SFC is providing value for money.
0 20 40 60 80 100 120
49 49.5 50
Time(s)
F
re
qu
en
cy
(
H
z)
0 20 40 60 80 100 120
-0.3 -0.2 -0.1 0 0.1
Time(s)
R
oC
oF
(H
z/
s)
0 20 40 60 80 100 120
-2 0 2 4 6
Time(s)
S
m
ar
t F
re
qu
en
cy
R
es
po
ns
e
(p
u)
0 20 40 60 80 100 120
0 1 2 3 4
Time(s)
C
on
ve
nt
io
na
l G
en
er
at
io
n
R
es
po
ns
e
(p
u)
0 20 40 60 80 100 120
49 49.5 50
Time(s)
F
re
qu
en
cy
(
H
z)
0 20 40 60 80 100 120
-0.3 -0.2 -0.1 0 0.1
Time(s)
R
oC
oF
(H
z/
s)
0 20 40 60 80 100 120
-2 0 2 4 6
Time(s)
S
F
C
R
es
po
ns
e
(p
u)
0 20 40 60 80 100 120
0 1 2 3 4
Time(s)
C
on
ve
nt
io
na
l G
en
er
at
io
n
R
es
po
ns
e
(p
u)
2 4 6 8 10 12
2 4 6 8 10 12
Figure 3 The SFC response must be step up quickly, be sustained and then ramped down to hand back control to the governors.
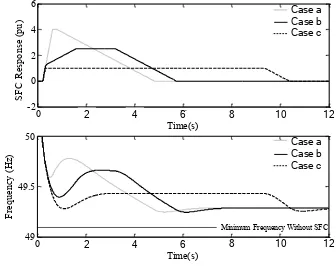
[image:4.612.348.516.531.665.2]shape this response, i.e. how best to use the pool of energy available to SFC. Figure 4 presents a number of illustrative examples of how a fixed amount of energy can be used to deliver a varied power injection. Secondary control is not included in Figure 3 and Figure 4 for simplicity and to illustrate that the steady state frequency is the same in each case, as SFC has no long term power injection.
From Figure 4 it can be seen that delivering a high initial power injection (case a) means the ramp down must begin sooner. Comparison of a and b is a good example of the benefits of a fast response, the slower second stage of the ramp up for b allows a significantly larger maximum deviation; however, the extended hold may be useful in systems that experience significant inter-area oscillations. Case c allows the largest maximum deviation but avoids the swings in frequency seen for a and b. From these examples, it would appear that any attempt to optimize the SFC response will require a sophisticated and rigorous method for assessing the severity of a frequency deviation, due to the complexity of shaping the optimal SFC response and its interaction with the cost/availability of real inertia and primary response.
0 20 40 60 80 100 120
49 49.5 50 Time(s) F re qu en cy ( H z)
0 10 20 30 40 50 60
-0.2 -0.1 0 0.1 0.2 Time(s) R oC oF (H z/ s)
0 20 40 60 80 100 120
0 1 2 3 4 Time(s) C on ve nt io na l G en er at io n R es po ns e (p u)
0 20 40 60 80 100 120
-2 0 2 4 6 Time(s) S F C R es po ns e (p u)
Minimum Frequency Without SFC
0 20 40 60 80 100 120
49 49.5 50 Time(s) F re qu en cy ( H z)
0 10 20 30 40 50 60
-0.2 -0.1 0 0.1 0.2 Time(s) R oC oF (H z/ s)
0 20 40 60 80 100 120
0 1 2 3 4 Time(s) C on ve nt io na l G en er at io n R es po ns e (p u)
0 20 40 60 80 100 120
-2 0 2 4 6 Time(s) S m ar t F re qu en cy R es po ns e (p u)
Minimum Frequency Without SFC Case a Case b Case c Case a Case b Case c
2 4 6 8 10 12
[image:5.612.390.500.89.213.2]2 4 6 8 10 12
Figure 4 The SFC response has finite energy available, but can deliver highly customized active power management
Finally, these results illustrate the importance of considering energy and not just power when defining the shape of the SFC response, which is a key difference between SFC and primary response. The SFC resources, for the most part, can deliver power very quickly but have finite energy; unlike synchronous generation that has significant stored energy in its mechanical and thermal systems. Therefore, when shaping the SFC response care must be taken to not exhaust the energy available too soon, which would risk only delaying the dangerous frequency deviation and not preventing it, see Figure 3.
V. SIMULATIONS OF SMART FREQUENCY CONTROL
This section presents simulation results that illustrate some of the issues discussed in the paper, these include: the impact of low inertia, the consequences of regional inertia and the potential impact of smart frequency control on the angular separation across a power system. These simulations were performed using a 36 Zone Model of the GB system (Figure 5) developed by National Grid. This model was specifically created for the study of the frequency dynamics of the future GB system. The generators in this system all have governors but no fast frequency control response is included in the results presented here unless specified in the
scenario being described. Furthermore, the secondary response is not included.
Zone 32
Zone 1 Zone 2
Zone 4
Zone 16
Scotland
Figure 5: 36 Zone model of the frequency response of the GB system
The results presented here consider three test cases:
Case 1: System inertia is uniformly distributed across the system and has an overall level of H.
Case 2: As in Case 1 system inertia is uniformly distributed across the system but has an overall level of ½H
Case 3: The inertia of the zones in Scotland (marked in Figure 5) are reduced to 1/5 of their values in Case 1 but the inertia of the zones in the rest of the system is left unchanged, this is to simulate the emergence of regional inertia.
A. The Impact of Low Inertia
The first simulation consisted of reducing the generation in Zone 1 by 1800 MW (the reference incident in GB [2]) at t=0.5 s. Figure 6 compares the frequency response of the system for each of the three cases using the frequency of the center of inertia (COI). Comparison of the COI frequency [8], for each case reveals three features. 1) Case 1 and 3 have very similar behavior with only a small difference, which can be accounted for by the reduced overall inertia in Case 3. This indicates that regional inertia has little effect on the COI frequency of the power system. 2) Case 2 has a significantly faster and deeper initial deviation, as would be expected for a system with reduced inertia. 3) All three cases eventually settle to the same new steady state frequency, although Case 2 reaches it more quickly.
0 5 10 15 20
[image:5.612.87.255.306.439.2]49.75 49.8 49.85 49.9 49.95 50 Time(s) Fr equ enc y (Hz ) H 1/2 H Regional H Case 1 Case 2 Case 3
Figure 6: COI Frequency response for Case 1, 2 and 3 for a generation decrease in Zone 1 of 1800 MW
B. The Emergence of Regional Inertia
[image:5.612.321.527.500.602.2]calculation of the COI frequency conceals the frequency behavior in low inertia regions. As such, it is a poor choice for monitoring the frequency in a system with regional inertia, as it may give a false impression of system security and prevent fast control actions from being targeted properly.
0 1 2 3 4 5
49.75 49.8 49.85 49.9 49.95 50 50.05
Time(s)
Fre
qu
en
cy
(Hz
)
FDis1H2normal40
Zone 2 Zone 32 COI
0 1 2 3 4 5
49.75 49.8 49.85 49.9 49.95 50 50.05
Time(s)
Fre
qu
en
cy
(H
z)
FDis32H3nsH2normal Zone 2 Zone 32 COI
[image:6.612.54.291.120.240.2]A B
Figure 7: Comparison of COI and zonal frequencies in low inertia systems reveals limitations on the COIs usefulness for SFC
C. The Need for Coordination
The local behavior seen in Figure 7 for an 1800 MW generation loss in Zones 1 and 32 can also be seen in the initial angle change in each zone, A and B of, respectively. From Figure 8 it can be seen that in both cases the angles close to the disturbance lead the angles that are further from the disturbance. This behavior can be used to target the smart frequency control as close to the disturbance as possible.
0.35 0.4 0.45 0.5 -0.2
-0.15 -0.1 -0.05 0
Time(s)
A
ng
le
D
iffe
re
nc
e
(d
eg
)
AngleDis32H3nsH2normal
Zone 2 Zone 4 Zone 16 Zone 32 Zone 1 0.35 0.4 0.45 0.5
-2 -1.5 -1 -0.5 0 0.5 1
Time(s)
A
ng
le
D
if
fe
re
nc
e (
de
g)
AngleDis1H3nsH2normal
Zone 2 Zone 4 Zone 16 Zone 32 Zone 1
A B
[image:6.612.60.291.329.423.2]Figure 8: Initial angular separation for disturbances in Zone 1 and Zone 32
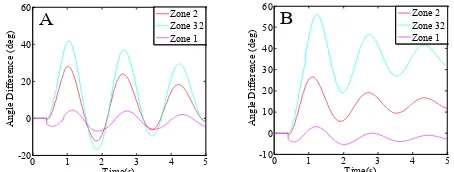
Figure 9, depicts the regional angle after an 1800 MW loss of generation in Zone 1 for Case 3 and with a fast control response activated in Zone 1 (A) and Zone 32 (B) respectively. It can be seen that by activating the fast control response in a zone that is distant from the disturbance it significantly exacerbates the angular strain across the system.
0 1 2 3 4 5
-20 0 20 40 60
Time(s)
A
ng
le
D
iff
er
en
ce
(
de
g)
AngleDis1Hnormalloadshed900zone1at0.9 Zone 2 Zone 32 Zone 1
0 1 2 3 4 5
-10 0 10 20 30 40 50 60
Time(s)
A
ng
le
D
iff
er
en
ce
(
de
g)
AngleDis1Hnormalloadshed900zone32at0.9 Zone 2 Zone 32 Zone 1
A B
Figure 9: Poorly targeted action can increase the angular stress, compare A (Action in Zone 1) and B (Action in Zone 32) for a disturbance in Zone 1
VI. CONCLUSION
Managing the reduction in system inertia (due to the displacement of synchronous generation that has an inherent, natural inertial response to a power imbalance, with asynchronous generation that has no natural response) will be of critical importance to frequency control in GB in the coming decades. Reduced inertia allows a faster, larger frequency deviation to occur after a disturbance that conventional primary response is too slow to contain. A
potential solution to this is developing new control services that deliver a control response more quickly.
Smart Frequency Control is a form of occasional frequency control that begins to act 0.5 seconds after a disturbance. The role of SFC is to quickly remove the post disturbance RoCoF and then prevent frequency collapse in reduced inertia systems by using the coordinated response of new service providers to manage the fast frequency deviation until the traditional primary governor response can overtake this management of frequency.
The challenges faced when attempting to deliver SFC include: the fast, robust estimation of the rate of change of frequency and the disturbance size immediately after a large disturbance; and controlling the new service providers to deliver a proportional, targeted response that will arrest the frequency deviation but not exacerbate the angular stress on the system. Furthermore, the quantity and nature of SFC resource required and how the SFC response is shaped will be dependent on the system inertia and availability of primary response. Therefore, creating a new market that will allow competition between these different control services and competition between the new SFC service providers will be particularly important if SFC is to be a success.
REFERENCES
[1] Department of Energy and Climate Change “Planning our electric
future: a white paper for secure affordable and low carbon electricity”, URL:https://www.gov.uk/government/uploads/system/uploads/attachm ent_data/file/48129/2176-emr-white-paper.pdf, retrieved 06/10/15.
[2] National Grid “System Operability Framework,” 2014.
http://www2.nationalgrid.com/UK/Industry-information/Future-of-Energy/System-Operability-Framework/ , retrieved 2/7/15
[3] National Grid “Electricity Ten year Statement” 2014
http://www2.nationalgrid.com/UK/Industry-information/Future-of-Energy/Electricity-ten-year-statement/, retrieved: 06/10/15
[4] National Grid“Smart Frequency Control” Project Website:
http://www.nationalgridconnecting.com/The_balance_of_power/index. html, retrieved: 06/10/15
[5] V. Terzija, et al. "Wide-Area Monitoring, Protection, and Control of
Future Electric Power Networks," Proceedings of the IEEE , vol.99,
no.1, pp.80,93, Jan. 2011
[6] A. G. Phadke and J. S. Thorp, Synchronized phasor measurements and
their applications. New York; London: Springer, 2008.
[7] A Chakrabarti, S.; Kyriakides, E.; Tianshu B.; Cai, D.; Terzija, V.; ,
"Measurements get together," Power and Energy Magazine, IEEE , vol.7, no.1, pp.41-49, January-February 2009
[8] P. Kundur, N. J. Balu, and M. G. Lauby, Power system stability and
control. New York; London: McGraw-Hill, Inc., 1994.
[9] P. Wall and V. Terzija, "Simultaneous Estimation of the Time of
Disturbance and Inertia in Power Systems," Power Delivery, IEEE Transactions on , vol.PP, no.99, pp.1-14
[10] P.M Ashton,, et al, M.E. Bradley, "Inertia Estimation of the GB Power
System Using Synchrophasor Measurements," Power Systems, IEEE Transactions on , vol.PP, no.99, pp.1,9
[11] V. Terzija, "Adaptive Underfrequency Load Shedding Based on the
Magnitude of the Disturbance Estimation," in Power Engineering Society General Meeting, 2007. IEEE, 2007, pp. 1-1.
[12] P.M. Anderson, M. Mirheydar, "A low-order system frequency
response model," Power Systems, IEEE Transactions on , vol.5, no.3, pp.720-729, Aug 1990
[13] C.D. Booth; F. Coffele, G.M. Burt "The Power Networks
Demonstration Centre: An environment for accelerated testing, demonstration and validation of existing and novel protection and automation systems," 12th IET International Conference on Developments in Power System Protection, Copenhagen, 2014
[14] Power Network Demonstration Centre, www.pndc.co.uk, retrieved
[image:6.612.62.289.506.592.2]