A novel two-dimensional angular resolved proton spectrometer
Su Yang1,2, Xiaohui Yuan1,2,a) , Yuan Fang1,2, Xulei Ge 1,2,3, Yanqing Deng1,2,4 ,Wenqing Wei1,2, Jian Gao1.2, Feichao Fu1,2, Tao Jiang 1,2, Guoqian Liao 5, Feng Liu1,2, Min Chen1,2, Yutong Li2,5, Li Zhao3, Yanyun Ma2,4, Zhengming Sheng1,2,6, Jie Zhang1,2,a)
1
Key Laboratory for Laser Plasmas (Ministry of Education) and Department of Physics and Astronomy, Shanghai Jiao Tong University, Shanghai 200240, China
2
Collaboration Innovation Center of IFSA(CICIFSA), Shanghai Jiao Tong University, Shanghai 200240, China
3
State Key Laboratory of Surface Physics and Department of Physics, Fudan University, Shanghai, 200433, China
4
College of Science, National University of Defense Technology, Changsha 410073, China 5
Beijing National Laboratory for Condensed Matter Physics, Institute of Physics, Chinese Academy of Sciences, Beijing 100190, China
6
SUPA, Department of Physics, University of Strathclyde, Glasgow G4 0NG, United Kingdom
Corresponding authors: [email protected]; [email protected]
We present a novel design of two-dimensional (2D) angular-resolved spectrometer for full beam characterization of ultrashort intense laser driven proton sources. A rotated 2D pinhole array was employed, as selective entrance before a pair of parallel permanent magnets, to sample the full proton beam into discrete beamlets. The proton beamlets are subsequently dispersed without overlapping onto a planar detector. Representative experimental result of protons generated from femtosecond intense laser interaction with thin foil target is presented.
I. INTRODUCTION
The unique properties of the beam of intense laser-driven protons have attracted enormous interests over the past decades due to several foreseen applications in medical cancer therapy,1,2 alternative approach for fusion energy,3 and advanced imaging scheme.4,5 A number of proton acceleration mechanisms have been proposed and demonstrated, which were identified according to the beam properties, i.e., directionality, energy spectral shape, or spatial-intensity profile. Although great efforts have been dedicated to resolve the dominant mechanisms and their relative contributions, full characterization of the source properties is required for deeper understanding of the underlying physics and acceleration dynamics, which is also pre-requisite for beam quality improvement and optimization for applications.
Two major diagnostics are employed for proton beam detection. The first is a multi-layer thin film stack for spatial-intensity distribution measurement at discrete energies.6,7 Another one is an energy spectrometer (spec) for sampled proton beam in a small solid angle of the order of 10−4 to 10−5 msr using magnetic and (or) electric field(s) dispersion,8 respectively. By replacing the pinhole with a slit or a row of pinholes, one-dimensional (1D) angular-resolved energy distributions of proton beams were measured.9-12 This design was proposed to have imaging capability.9 The energy spectrum, spatial distribution, and angular distribution of the proton beam were found to be inherently correlated with each other using the novel spectrometer design.13
for plain metal foil target, asymmetric proton beams were also measured.18 To resolve the non-uniformity and asymmetry in proton beams, the two-dimensional (2D) angular-resolved measurement is pre-requisite. Furthermore, due to the limited target alignment accuracy, the target normal axis may have a pitch angle with respect to the laser incidence plane, causing the proton beam pointing variation from shot to shot. The 1D angular-resolved measurement may introduce systematic errors. Therefore, a 2D angular-resolved proton spectrometer is more desirable for source characterization, which is expected to give a more comprehensive picture on energy- and spatial-intensity distributions of proton beam. By using a 2D entrance-pinhole array, we designed a spectrometer which is capable of measuring the energy spectra in 2D angular dimensions simultaneously.
II. PRINCIPLE AND DESIGN
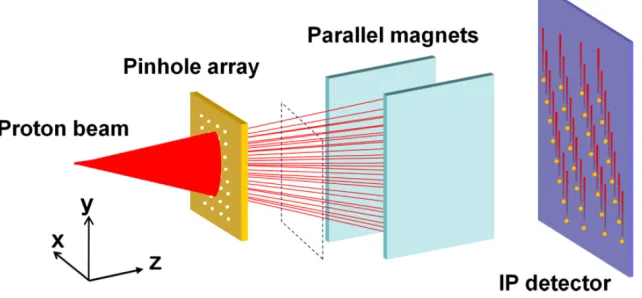
FIG. 1. The schematic of 2D angular-resolved proton spectrometer. The proton beam is sampled to multiple beamlets with a 2D periodic pinhole array plate. The discrete beamlets propagate through a pair of parallel magnets for energy dispersion. An image plate (IP) detector is used to record the dispersed protons. Each yellow points on detector represents the infinite energy in the specific direction. The pinhole array needs be rotated with respect to its normal axis to avoid the overlapping of protons from each pinhole.
A schematic of the 2D angular-resolved proton wide-angle spectrometer (2D pWAS) is shown in Fig. 1. Instead of a single pinhole, a slit, or a row of pinholes used in typical magnetic spectrometer, the divergent proton beam is sampled by a 2D periodic pinhole array manufactured on the high-Z material plate (tungsten or stainless steel in our case), which forms 2D-distributed discrete beamlets in the plane marked by dashed square in Fig. 1. The beamlets propagate into a pair of parallel permanent magnets and get dispersed. A large area image plate (IP, BAS-SR2025) detector is used to record the signals. Each of the yellow points on the detector plane corresponds to non-deflected x-ray or neutral signal, which defines the infinite large proton energy (also known as reference, zero point), as displayed later in Fig. 3(b).
The dispersion of protons in magnetic field is governed by the Lorentz formula according to their energies as
d mv
(
)
qv B
dt
(1)
where m, q,
v
andB
are proton mass, charge, velocity, and magnetic field, respectively. In a perfect parallel magnetic field (only Bx component is nonzero), protons will undergo an
equidistant spiral motion, resulting in a uniform motion along x− axis and circular motion in y − z
[image:2.595.142.463.267.416.2]magnetic field, vectorial magnet field (characterized with the three components along x−, y−, and
z−axis) and their spatial distributions should be taken into account. The three main axes are defined in Fig. 1.
[image:3.595.147.446.266.623.2]To allow a wide collection angle for proton beam, the distance between the two magnets is expected to be large. However, a bigger gap will reduce the magnetic field strength, decreasing the resolving power of the spectrometer. A compromise was found based on the measurements from dosimetry film stacks and normal Thomson parabola spectrometer (TP-spec). For the high-contrast laser-foil interaction and from the measurement using dosimetry film stacks, the proton beam normally has a divergence angle less than 20°which decreases with proton energy.16 When the spectrometer is placed 60 mm away from the target, which is determined by the internal space of the target chamber, a pair of 10 mm-thick 50 mm × 100 mm identical NdFeB magnets with a separation of 40 mm will have a matched condition.
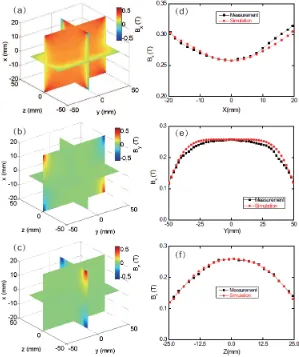
FIG. 2. Slice images of spatial distributions of the three components of magnetic field simulated with Radia code, (a) Bx, (b) By, and (c) Bz. The lineout plots of Bx component along the three major axes are compared with the
measurement in (d)-(f), which show perfect matches.
The magnetic field distribution simulations were performed using Radia,19 a 3D magnetostatics computer code based on boundary integral methods. Figs. 2(a)-2(c) are slice plots of the simulated spatial distributions of Bx, By, and Bz in Cartesian coordinate system. The field
strength is strongest close to the surface of either of the magnets for Bx. Significant enhancement
complex vectorial field distribution must be employed for full angle energy dispersion calculation. The accuracy of magnetic field simulations was cross-checked with the direct measurements using a Hall probe detector for Bx in the three main axes. The simulations are in good agreement with
measurements, as shown in Figs. 2(d)-2(f), with an error of less than1%. The magnetic field strength Bx at center is about 0.26 T. According to a previous experimental result when using the
normal TP-spec of the similar magnetic field strength, a pinhole with a diameter φ = 250 μm could give reasonable good spectra, concerning the proton signal-to-noise ratio and energy resolution.20
One key technique to gain high-resolution 2D angular measurement is to rotate the pinhole array about the z-axis to avoid the signal overlapping. A highest angular-resolution is achieved when the pinhole separation is smallest and nearby proton tracks are just separated horizontally. The following relationship needs to be satisfied:
tan( )
rD
(2) Here θr is the rotation angle around the central pinhole axis (z-axis) and D is the distance betweentwo adjacent pinholes. Furthermore, aluminum foil is required to filter out the low energy protons to avoid the proton track overlapping with the upper zero point (in the vertical direction), which will set a minimum detectable energy. For a typical magnetic spectrometer, the proton energy dispersion Y can be calculated from:
Y
BqL L
1(
2
L
1/ 2) / 2
mE
, where E is the proton kinetic energy, L1 is the magnet length along the z-axis, and L2 is the distance from the end ofmagnets to the detector plane. The pinhole array plate is set at the entrance of the magnets. From a first-order approximation, 1.0 MeV protons will have a deflection of Y = 21.5 mm from the zero point on the detector plane for L1 = 50mm and L2 = 215mm when passing through the central
pinhole (i.e., along z-axis). To allow the 1.0 MeV proton measurable, the rotated angle should meet the following criterion:
1 2
sin( )
rd
L
L
D
Y
d
(3) here d = 60 mm is the distance of pinhole plate to the target and the pinhole array is at the entrance of magnets. A lower proton energy will cause a larger deflection, and therefore a relatively smallerθr is requested to resolve lower energy protons. Therefore an optimum condition for angular
resolution and minimum detecting energy range is the compromise and balance of a number of parameters, involving the pinhole diameter and separation, the rotated angle, and the magnets specifications.
A series of modeling of proton trajectories in the spectrometer and the energy-dispersion spatial distributions on detector plane were performed with the particle tracing code GPT (General Particle Tracer).21The GPT code is based on an embedded fifth-order Runge-Kutta driver, which provides a 3D simulation package to study charged particle dynamics in magnetic fields. The magnetic field distributions were taken from Radia simulation results (shown in Fig. 2). In the simulations, a population of 5 × 10⁶ protons with an exponential energy spectral distribution from 1.0 MeV to 5.0 MeV, as well as a beam of 106 photons of 1.0 keV simulating nondeflectable signals, was set. The protons and photons both have identical uniform spatial distributions with a diameter of 5 μm and uniform angular distributions with a cone angle of 20°. The representative simulated proton energy-dispersion distribution is shown in Fig. 3(a), with a rotated angle θr =
15°and pinhole separation D = 2 mm. The geometry of pinhole array is depicted in Fig. 3(a) in black dots and rotation is illustrated with black lines labeled in θr. It is seen that each pinhole
mm from zero point for the pinhole at center and 21.2 mm for that at the top-right corner. The energy resolving power (E/dE) of the spectrometer is calculated to be 10 for 1.0 MeV protons.
As discussed before, the IP detector should be covered with Al foil to remove low-energy protons, as well as shield from the scattered plasma light and stop heavier ion beam. A 15 μm -thick Al foil will filter out protons below 1.0 MeV and carbon ions below 17.5 MeV as calculated by Monte Carlo ion transport code SRIM.22In our experiment, carbon ions with maximum energy of 6.9 MeV were measured using a MCP based TP-spec. To reconstruct the proton energy spectrum from each pinhole, the energy-dependent response of IP detector,23 which has been calibrated with monoenergetic proton beams from traditional accelerator by Ref. 24 and the energy loss of protons in Al foil are considered.
III. EXPERIMENT AND DISCUSSION
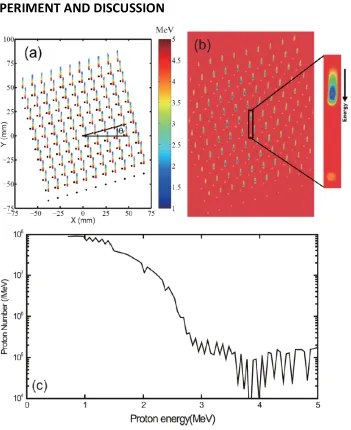
FIG. 3. (a) The calculated proton deflection on the detecting plane relative to the respective zero point for different proton energies using the GPT code. The proton energy used in the simulation is from 1.0 MeV to 5.0 MeV. 11 × 11 pinholes are employed. The axis of pinhole array has a rotated angle θr = 15°to the central pinhole. (b) A raw
[image:5.595.123.474.241.671.2]The test experiment was performed using the 200 TW Ti:Sapphire laser system in Shanghai Jiao Tong University. In this experiment, the laser energy was chosen to be ~1.0 J, and the pulse duration was 25 fs. The laser pulse was focused to a spot of 6 μm in diameter at full width at half-maximum (FWHM) by an f /4 off-axis parabolic (OAP) mirror, giving a calculated peak intensity of 4 × 10¹⁹ W/cm2 on foil targets. The laser incidence angle is 9°. The designed 2D pWAS was placed 60 mm away from the target along the normal direction in the rear side, which therefore could still cover the laser direction. Considering the possible proton track broadening due to extended source size and to allow flexible alignment, the pinhole distance was set to be D = 2 mm, and an array of 11 × 11 identical pinholes fabricated on a round stainless-steel plate by chemical dissolution was used in the experiment. Fig. 3(b) shows a raw image of proton signal on IP detector. Weak dots are the zero points for individual pinholes. The protons are deflected vertically upwards. The spectral line at the center is longer (the distance between the high energy cutoff to the zero is shorter) and brighter than the marginal ones, which intuitively shows that larger proton flux with higher energy was produced close to the normal direction. It seems that the divergence angle is larger than 20°. However, as will be shown later that it is energy-dependent. For protons with energy lower than 1.8 MeV, the divergence angle is larger than 20°. Whereas for higher energy protons, the angle is gradually reduced. This is a direct evidence of target normal sheath acceleration (TNSA) dominated proton generation mechanism. In Fig. 3(b), the proton track along the normal axis including its zero point is enlarged. The respective energy spectrum was plotted in Fig. 3(c), taking into account of energy dispersion, response of IP detector, and energy loss through Al foil. The spectral shape is similar to that from a normal TP-spec.
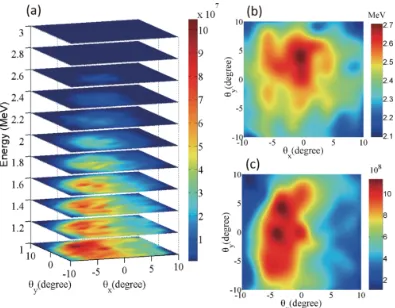
FIG. 4. (a) Slice plot of the reconstructed energy-dependent proton spatial intensity distribution. (b) The angular distribution of maximum proton energy. (c) The integrated proton energy distribution (MeV/msr).
[image:6.595.101.496.392.700.2]simulation, we could reconstruct 2D angular-resolved proton energy distributions. The slice plots are shown in Fig. 4(a). Here each slice shows a spatial-intensity distribution of protons representing a certain energy. These patterns are very much similar to the measurement made by dosimetry films, however, at a much improved energy resolution determined by the IP spatial resolution and pinhole size. At the bottom slice, 1.0 MeV, we get the largest proton flux and divergence angle. With the proton energy increasing, the flux of protons and the divergence angle both decrease dramatically. The maximum proton energy is about 2.7 MeV, only concentrated in the central part of the detector. The envelope of the angular-energy intensity distribution gives a 2D maximum energy distribution of the proton beam, as is shown in Fig. 4(b); here protons with the largest maximum energy were measured close to the target normal direction.
By analyzing the spectrum for each beamlet, the energy spectra were individually integrated to obtain the angular distribution of the total proton energy in each beamlet. The polynomial interpolation was used to give a quasi-continuous angular distribution of integrated proton energies, as is shown in Fig. 4(c). By accumulating the integrated proton energy over the 2D angles (θx and θy), we obtained the overall proton energy. The laser-to-proton energy conversion
efficiency is calculated as the ratio of the overall proton energy to the input laser energy for protons with energy higher than 1.0 MeV and within the 20°collection angle, which is 0.8% in this shot. One interesting feature is that the patterns of maximum proton energy distribution (Fig. 4(b)) and integrated proton energy distribution (Fig. 4(c)) are significantly different. The protons along the target normal axis obtain the maximum energy, whereas there is a 4°off the normal axis in the peak of integrated proton energy distribution. This difference may be due to the complex proton acceleration dynamics, for example, the influence of self-induced magnetic field on sheath evolution at the target rear surface.25This deserves dedicated efforts for further study, which is beyond the scope of this paper.
FIG. 5. (a) The simulated proton energy dispersion from 1.0 MeV to 50.0 MeV with a divergence angle of 20°by using 2D pWAS. (b) A schematic of proton and heavier ion energy spatial distributions on detector plane when electric field and magnetic field are both applied, here the red dotted lines correspond to protons and blue and green dotted lines represent two example heavier ions with different charge-to-mass ratio, respectively.
[image:7.595.96.500.451.669.2]higher-energy protons and multispecies ion beams are expected to be produced. The proposed 2D pWAS is still applicable after some modifications. Since higher-energy protons are less deflected in the magnetic field, the energy resolution in higher-energy region is relatively poor. To improve the resolution, stronger magnets or longer drifting distance is required. Fig. 5(a) shows the simulated 2D angular-resolved proton energy dispersion with the energy up to 50 MeV. Aluminum foil with proper thickness could be applied to spatially separate the ion trajectories of different species.12 Alternatively, a pair of electrodes can be added to the 2DpWASto provide a transverse deflection which also spatially separates the proton and heavier ion tracks, just functions as a multi-pinhole TP-Spec. Fig. 5(b) illustrates a schematic of energy dispersion on detector plane when both electric and magnetic fields are applied for both protons and multi-species ions. It is noteworthy that because of the large gap between the two magnets, a higher voltage (>10 kV) is required to allow enough dispersion in the E-field direction. Fortunately this high voltage (HV) power supply is commercially available.
IV. SUMMARY
We have designed and tested a 2D angular-resolved proton spectrometer, which is capable of measuring the energy spectra and spatial-intensity distributions of protons in two dimensions simultaneously. This spectrometer has the combined function of magnetic spectrometer and dosimetry film stack and could provide accurate information on proton spatial intensity distribution with precise energy steps. With further improvement on real-time detection using plastic scintillator and CCD imaging system, this novel design will be a complementary diagnostic for characterizing the proton sources and optimizing the beams for applications. In principle, multispecies ions could also be measured along with protons by adding a pair of electrodes for transverse deflection. These extended detection capabilities may shine new insight on the laser-ion acceleration physics.
ACKNOWLEDGMENTS
We acknowledge financial support from National Basic Research Program of China (Grant No. 2013CBA01502), National Natural Science Foundation of China (Grant Nos. 11421064, 11205100, 11205243, and 11375262), and National Key Scientific Instrument Development Project (Grant No. 2012YQ030142).
REFERENCE
1. S. V. Bulanov and V. S. Khoroshkov, Phys. Plasmas. Rep. 28, 453 (2002).
2. V. Malka, E. Lefebvre, E. d’Humieres, R. Ferrand, G. Grillon, C. Albaret, S. Meyroneinc, J. P. Chambaret, A. Antonetti, and D. Hulin, Med. Phys. 31, 1587 (2004).
3. M. Roth, T. E. Cowan, M. H. Key, S. P. Hatchett, C. Brown,W. Fountain, J. Johnson, D. M. Pennington, R. A. Snavely, S. C.Wilks, K.Yasuike, H. Ruhl, F. Pegoraro, S. V. Bulanov, E. M. Campbell, M. D. Perry, and H. Powell, Phys. Rev. Lett. 86, 436 (2001).
4. M. Borghesi, D. H. Campbell, A. Schiavi, M. G. Haines, O. Willi, A. J. MacKinnon, P. Patel, L. A. Gizzi, M. Galimberti, R. J. Clarke, F. Pegoraro, H. Ruhl, and S. V. Bulanov, Phys. Plasmas 9, 2214 (2002).
P. Patel, M. Galimberti, and L. A. Gizzi, Rev. Sci. Instrum. 74, 1688 (2003).
6. R. A. Snavely, M. H. Key, S. P. Hatchett, T. E. Cowan, M. Roth, T. W. Phillips, M. A. Stoyer, E. A. Henry, T. C. Sangster, M. S. Singh, S. C. Wilks, A. MacKinnon, A. Offenberger, D. M. Pennington, K. Yasuike, A. B. Langdon, B. F. Lasinski, J. Johnson, M. D. Perry, and E. M. Campbell, Phys. Rev. Lett. 85, 2945 (2000).
7. F. Nürnberg, M. Schollmeier, E. Brambrink, A. Blažević, D. C. Carroll, K. Flippo, D. C. Gautier, M. Geissel, K. Harres, B. M. Hegelich, O. Lundh, K. Markey, P.McKenna, D. Neely, J. Schreiber, and M. Roth, Rev. Sci. Instrum. 80, 033301 (2009).
8. E. L. Clark, K. Krushelnick, M. Zepf, F. N. Beg, M. Tatarakis, A. Machacek, M. I. K. Santala, I.Watts, P. A. Norreys, and A. E. Dangor, Phys. Rev. Lett. 85, 1654 (2000).
9. H. Chen, A. U. Hazi, R. van Maren, S. N. Chen, J. Fuchs, M. Gauthier, S. Le Pape, J. R. Rygg, and R. Shepherd, Rev. Sci. Instrum. 81, 10D314 (2010).
10. D. Jung, R. Horlein, D. Kiefer, S. Letzring, D. C. Gautier, U. Schramm, C. Hubsch, R. Ohm, B. J. Albright, J. C. Fernandez, D. Habs, and B. M. Hegelich, Rev. Sci. Instrum. 82, 013306 (2011).
11. Y. Zheng, L. N. Su, M. Liu, B. C. Liu, Z.W. Shen, H. T. Fan, Y. T. Li, L. M. Chen, X. Lu, J. L. Ma, W. M. Wang, Z. H. Wang, Z. Y. Wei, and J. Zhang, Rev. Sci. Instrum. 84, 096103 (2013).
12. S. Palaniyappan et al., Nat. Commun. 6, 10170 (2015).
13. S. Ter-Avetisyan, M. Schnurer, P. V. Nickles,W. Sandner, T. Nakamura, and K. Mima, Phys. Plasmas 16, 043108 (2009).
14. P. Mckenna, A. P. Robinson, D. Neely, M. P. Desjarlais, D. C. Carroll, M. N. Quinn, X. H. Yuan, C. M. Brenner, M. Burza, M. Coury, P. Gallegos, R. J. Gray, K. L. Lancaster, Y. T. Li, X. X. Lin, O. Tresca, and C.-G.Wahlstrom, Phys. Rev. Lett. 106, 185004 (2011).
15. O. Tresca, D. C. Carroll, X. H.Yuan, B. Aurand,V. Bagnoud, C. M. Brenner, M. Coury, J. Fils, R. J. Gray, and T. Kuhl, Plasma Phys. Controlled Fusion 53, 105008 (2011).
16. Y. Fang, X. L. Ge, S. Yang, W. Q. Wei, T. P. Yu, F. Liu, M. Chen, J. Q. Liu, X. H. Yuan, Z. M. Sheng, and J. Zhang, Plasma Phys. Controlled Fusion 58, 075010 (2016).
17. J. Fuchs, T. E. Cowan, P. Audebert, H. Ruhl, L. Gremillet, A. Kemp, M. Allen, A. Blazevic, J.-C. Gauthier, M. Geissel, M. Hegelich, S. Karsch, P. Parks, M. Roth, Y. Sentoku, R. Stephens, and E. M. Campbell, Phys. Rev. Lett.91, 255002 (2003).
18. K. Zeil, S. D. Kraft, S. Bock, M. Bussmann, T. E. Cowan, T. Kluge, J. Metzkes, T. Richter, R. Sauerbrey, and U. Schramm, New J. Phys. 12, 045015 (2010).
19. P. Elleaume, O. Chubar, and J. Chavanne, “Computing 3D magnetic fields from insertion devices,” in Proceedings of the 1997 Particle Accelerator Conference, 1997 (IEEE), Vol. 3, pp. 3509–3511.
Li, X. H. Yuan, Z. M. Sheng, and J. Zhang, Plasma Phys. Controlled Fusion 58, 045025 (2016).
21. See http://www.pulsar.nl/gpt for more information about GPT.
22. J. F. Ziegler, M. D. Ziegler, and J. P. Biersack, Nucl. Instrum. Methods Phys. Res., Sect. B 268, 1818 (2010).
23. A. Mančić, J. Fuchs, P. Antici, S. A. Gaillard, and P. Audebert, Rev. Sci. Instrum. 79, 073301 (2008).
24. T. Bonnet, M. Comet, D. Denis-Petit, F. Gobet, F. Hannachi, M. Tarisien, M. Versteegen, and M. M. Aleonard, Rev. Sci. Instrum. 84, 013508 (2013).