A game theory competition analysis of
quadropolistic liner container shipping market
Murat Aymelek, Evangelos Boulougoures, Osman Turan
University of Strathclyde, UK
Abstract
This paper demonstrates a non-cooperative four rational player’s static game framework to analyse the shipping alliance competition on a particular Far East-Northern Europe liner shipping service loop. The complete-perfect information case of the players is taken into account and the Cournot-Nash equilibrium pure strategy solution concept is utilised. The approach developed in this study focuses on the current liner shipping alliance structure and assumes the long term stability of the current alliances. The research steps are mathematically integrated to different methodological outcomes and numerically tested in the given case study. The results suggested that, in a two year period, additional ship capacity deployment would reduce the competitiveness of the alliances. It is proposed that outcomes of this research will provide significant theoretical contribution to the existing literature and will generate a robust tactical decision support rationale regarding to the capacity deployment problem of the liner container shipping industry.
Keywords: Shipping Alliances, Cournot Oligopoly, Liner Shipping, Competition Analysis, Capacity Deployment
1. Introduction
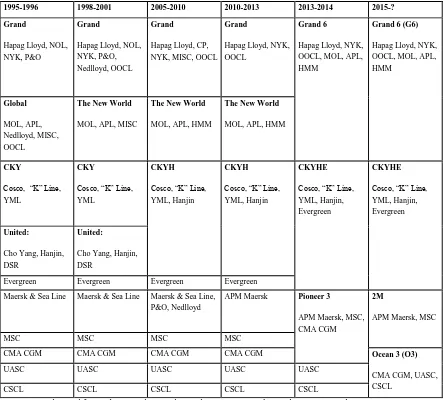
decision makings and tactical planning of members in order to gain operational flexibility, sustainability and cost efficiency due to the shared utilisation service capabilities. The liner shipping alliances have experienced competitive developments and evolutions since 1995. In 1998, due to cross-alliance mergers and acquisitions, the form of shipping alliances changed and The New World Alliance replaced Global Alliance (Doi et al., 2000). This trend was spread on other alliances and continued until China’s rejection of the Pioneer 3 shipping alliance network. Thus, the shipping liners were enforced to develop new perspectives for their strategic alliances. As shown in the following Table, in 2015 the shipping alliances were shaped as four competitors as a consequence of the rejection of the P3 alliance.
Table.1 Historical development of the shipping alliances
Source: Adapted from (Panayides and Wiedmar, 2011; Shi and Voss, 2008)
1995-1996 1998-2001 2005-2010 2010-2013 2013-2014 2015-?
Grand
Hapag Lloyd, NOL, NYK, P&O
Grand
Hapag Lloyd, NOL, NYK, P&O, Nedlloyd, OOCL
Grand
Hapag Lloyd, CP, NYK, MISC, OOCL
Grand
Hapag Lloyd, NYK, OOCL
Grand 6
Hapag Lloyd, NYK, OOCL, MOL, APL, HMM
Grand 6 (G6)
Hapag Lloyd, NYK, OOCL, MOL, APL, HMM
Global
MOL, APL, Nedlloyd, MISC, OOCL
The New World
MOL, APL, MISC
The New World
MOL, APL, HMM
The New World
MOL, APL, HMM
CKY
Cosco, “K” Line, YML
CKY
Cosco, “K” Line, YML
CKYH
Cosco, “K” Line, YML, Hanjin
CKYH
Cosco, “K” Line, YML, Hanjin
CKYHE
Cosco, “K” Line, YML, Hanjin, Evergreen
CKYHE
Cosco, “K” Line, YML, Hanjin, Evergreen
United:
Cho Yang, Hanjin, DSR
United:
Cho Yang, Hanjin, DSR
Evergreen Evergreen Evergreen Evergreen
Maersk & Sea Line Maersk & Sea Line Maersk & Sea Line, P&O, Nedlloyd
APM Maersk Pioneer 3
APM Maersk, MSC, CMA CGM
2M
APM Maersk, MSC
MSC MSC MSC MSC
CMA CGM CMA CGM CMA CGM CMA CGM Ocean 3 (O3)
CMA CGM, UASC, CSCL
UASC UASC UASC UASC UASC
Nowadays, the rationale behind strategic cooperation in the liner container shipping business is efficient capacity utilisation of the fleets owned by individual shipping liners by aiming to prevent the negative impacts of the ship size enlargement trend. The research effort on the capacity deployment is associated with the recent developments of the liner shipping. One of the main obstacles in the liner container shipping industry is the regulatory enforcement of the International Maritime organization (IMO). The energy efficiency, emission, and sustainability regulations of IMO required significant operational effort and investment of the shipping liners in order to reduce greenhouse gas (GHG) emissions, to save energy and to contribute to the marine sustainability. Another obstacle that the industry faces is the overcapacity of ship capacity supply to the market due to the enlargement of the ship size which also causes operational problems for the ports such as draft, handling and port traffic. In addition, instability of bunker prices drives the innovation requirements for energy efficiency of existing marine and structural systems and available bunkering sources. Due to the capacity oversupply, freight rates in low levels and threatens the financial stability of the liner shipping companies. All these obstacles have a huge influence on the liner shipping competition outcomes for global trade and competitiveness level of the players in the liner shipping market.
2. Literature Review
A wide academic literature exists regarding to competition analysis and capacity deployment problem of the liner shipping. Panayides and Cullinane (2002) addressed strategic issues of the liner shipping competition. They clarified theoretical background of competitive advantage in liner shipping industry by applying the famous management guru Michael E. Porter’s ideas and resource based view. In addition, as Srivastava et al (2001) mentioned market based view and as Grant (1996) explained knowledge-based (technology) view should be considered as other theories could be applied to the liner container shipping in order to gain competitive advantage. Progoulaki and Theotokas (2010) investigated the resource based view in shipping competitiveness. In their research they adapted the resource based view to human source and crew management sections of a shipping company in order to gain competitive advantage. Greeve (2009) mostly focused on the impact of innovation on the shipping competitiveness and compared the diffusion of panamax container ships with double hull oil tankers. In another similar study, Poulis et al (2013) compared competitiveness of shipping companies in consideration of their information communication technologies. On the other hand, majority of the studies in the literature utilised market based view. Dimitriu et al (2007) utilised agent based simulation and game theory approach in order to generate a competitive short sea passenger shipping network. In terms of liner container shipping, Yong (1996) carried out a game theoretic research on the competition among three deep sea shipping liners where the shipping liners are determined as an incumbent firm, a potential entrant and a buyer. His results claimed that exclusive dealing contracts could be significant market barriers to entry when the entrant player has a limited capacity.
shippers and consignees. Their numerical analysis indicated that high liner shipping frequency is very significant for the products have high value density, high inventory cost, low demand variability and high service level requirement. The study was in favour of the shipping alliance ideology based on increasing the liner shipping port call frequency on a certain liner service loop and creating differentiation.
3. Methodology
[image:6.612.119.502.338.463.2]Methodological aspect of this paper addresses practical capacity deployment rationales of the shipping alliances based on the December 2015 alliance structures. It also adapts the static Cournot heterogeneous four player capacity allocation game concept to the shipping liner alliance market competition with an integrated research framework. The mathematical steps of the methodology generated includes cost calculations of the players, Cournot competition optimal capacity deployment and freight mechanism, additional capacity increase or capacity reduction decision scenarios, Nash pure solutions for the complete information state of the players. By this methodological application, it is aimed to determine the equilibrium points of the market for different decision making alternatives. The methodological steps of the paper could be simplified as in the following figure.
Figure 1 – Methodology of the study
The Cournot competition model is commonly applied for the case of oligopolistic control of a group of firms on the freight determination in a particular market. This study assumes the deep sea liner container shipping market as a four player oligopoly consisting of the existing shipping alliances which can be called “alliance quadropoly”. The study disregards cooperation at any level between alliances and individual alliance members and assumes a perfect competition among alliances where a complete information flow is provided.
In the case of four non-cooperative fully competing players, let indicates the ship capacity deployments of the quadropolistic competition counterparties during a certain time period in the market boundaries. It is assumed that the freight of the liner shipping services has a direct mathematical relationship with total deployed shipping capacity through inverse demand function of economy theory which is a linear function assisting to simplify and explain the capacity-freight relationship. The average shipment price (ocean freight) of the liner service on a specific loop that
Step 1 •Cournot competition model of four player's game
Step 2 •Cost calculations of alliances on a particular liner service loop
Step 3
•Additional ship capacity allocation-investment tactical decision making scenario
quadropoly supply can be shown as where is a constant parameter that representing the market behaviour, and are the constant slopes of the market from each player’s market position. In order to calculate the profit functions of the players, let the average container port-to-port shipment round trip cost function of the players be and revenue of the players be
. Therefore, the profit function of player 1 is , the profit function of player 2 is , the profit function of player 3 is
, and the profit function of the player 4 is . Then it is possible to formulate the profit functions of the each player as below.
According to Cournot oligopoly model marginal profit functions or each player can be found as following (Elsadany, 2013).
Where;
Using the above model it is possible to show marginal profit of each counterparties of the quadropolistic game as follows.
Then the best response capacity allocations of each player can be written in the form of Cournot oligopoly model.
In order to show mathematical relationship between optimal capacity deployment of the players and the fixed shipping price of four player oligopoly by Cournot model, the following equations are generated.
In final form of the equations, we can simply show the capacity allocations of the players as:
In the existence of the allocated capacities, the above equations will assist us to find the slopes of the market ( ) for each players and to determine values of the market where fixed price per unit is known and cost per unit of each player is calculated.
In the case of liner shipping services, in order to calculate the total cost of each player ( ) on a specific round trip service, with identical ships, it is required to calculate voyage costs , operational costs and capital costs (Stopford, 2009).
Simply the voyage cost of each player ( ) may be calculated as sum of the average bunker costs , average port charges and any required canal charges ( .
The operational cost of players ( ) may be calculated as sum of manning cost
, insurance cost , stores , maintenance , and administration costs
.
In order to calculate number of round trips for a ship per year, it is required to calculate total round trip time. The total rime requires for a liner service round trip is calculated as below.
Where;
= Route distance between and port of call = Average speed between and port of call =Average port time of port of call
= Average total round trip delays from unexpected port waiting, maintenance and weather
Capital cost per ship round trip of each player may be calculated with following formula for .
Where;
= Cash price of the average ship of each player
= Interest rate of the average ship of the players for adequate time period
= Number of instalment for each player
= Loan of the players
Then the number of round trips per year for a ship is with largest integer possible. If it is assumed that the liner service provides weekly service from each port of calls, it is required to allocate number of ships with largest integer possible. The total annual cost of a liner service loop for a shipping alliance/shipping liner is shown as below.
Annual additional costs per service loop
Based on the given total annual cost, the average per container shipment cost could be shown as following.
Where;
= Capacity utilisation rate of the liner service of player
Let is a particular additional capacity decision that shipping liners could employ on the liner shipping service by enlarging the average ship size. New capacity of a shipping alliance could be expressed as:
Where;
is 0 or
is capacity allocation of in the new scenario.
In final form of the previous equations, we can simply show the capacity allocations as:
Where;
is the new freight rates based on the capacity deployment decision is the new cost per container based on the capacity deployment decision.
In heterogeneous four player game let the pure strategy set of the player is denoted by
with where it is assumed that all players have =2 pure strategies in order to simplify the model. The set of all pure strategy profiles is
It is possible to represent the total number of pure strategies in the quadropoly game as
and pure strategy combinations in the game as . Thus, the number of pure
strategies in game is 8 and the pure strategy combinations in the game is Briefly all pure strategy combinations in the game could be shown as following (Chatterjee, 2009).
Where;
means pure strategy of player and each player has 2 available strategies in a four player game for and .
With the given strategy combinations the utility profit payoff ( combination matrix of the players in quadropoly is identified as below.
Where;
F, the solution concept, is formulated as . The strategy combination is the Nash equilibrium if no player has incentive to deviate from his strategy given that the other players do not deviate from their strategies (Nash, 1950).
Formally Nash equilibrium best response function of the game can be shown as follows:
Where;
is the Nash equilibrium best response strategies of the other players is any alternative strategy of player
4. Case Study
[image:13.612.117.558.465.642.2]In this section, the previously developed methodology is applied to a hypothetical Far East- Northern Europe liner service loop. The Far East-Northern Europe liner shipping market is selected due to its more balanced market share among the liner shipping alliances. The market supply shares of the alliances comparisons according to main route areas are given in the figure 2.
Figure-2 Market shares of the liner shipping alliance supply capacities
Source: Own eloborations based on (Alphaliner, 2015) data
This study assumes the liner shipping service of the Global alliances as identical with routes and port of calls and each alliance utilises a certain average ship sizes on the given liner
28,42% 35,05% 16,13%
45,45%
29,47% 20,62% 35,48%
43,18%
26,32% 23,71%
34,41%
4,55%
15,79% 20,62%
13,98% 6,82%
0,0% 10,0% 20,0% 30,0% 40,0% 50,0% 60,0% 70,0% 80,0% 90,0% 100,0% East-West
Far East- Europe Trans-Pacific Trans-Atlantic
shipping service route. The route consists of, including East bound and West bound, 13 voyages between 14 port of calls namely; Qingdao, Kwangyang, Busan, Shanghai, Yantian, Singapore, Algericas, Hamburg, Rotterdam, Le Havre, Algericas, Singapore, Yantian, Qingdao. Due to the Qingdao port called second time at the end of the round trip it is excluded from port of calls and the total port of calls for one round trip is accepted as 13. The visual illustration of the identically assumed Far East- Northern Europe liner service loop is illustrated as following.
Figure 3 – Typical Far East-Northern Europe liner container shipping service
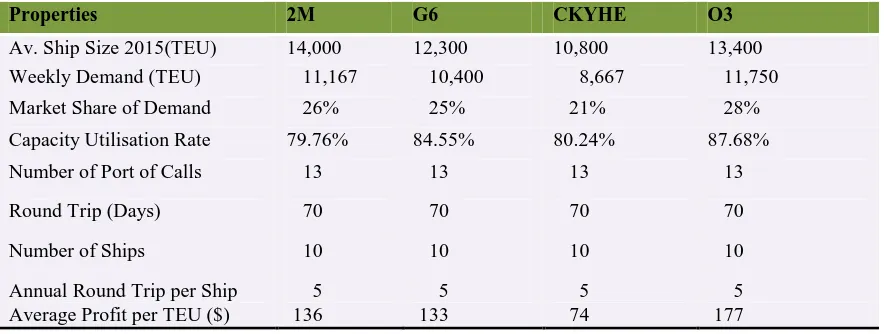
For the given service loop, the current average freight rate is identified as $650/TEU from 2015 Shanghai-Rotterdam and Rotterdam- Shanghai rates of the world container index data. Thus, the market slope values of the alliances are determined as
Table.2 Properties of the liner shipping alliances for the service route
Properties 2M G6 CKYHE O3
Av. Ship Size 2015(TEU) 14,000 12,300 10,800 13,400
Weekly Demand (TEU) 11,167 10,400 8,667 11,750
Market Share of Demand 26% 25% 21% 28%
Capacity Utilisation Rate 79.76% 84.55% 80.24% 87.68%
Number of Port of Calls 13 13 13 13
Round Trip (Days) 70 70 70 70
Number of Ships 10 10 10 10
Annual Round Trip per Ship 5 5 5 5
Average Profit per TEU ($) 136 133 74 177
Source: (Drewry, 2016)
6. Scenario Building
In order to analyse the competition state of the market 2 years after from present, a market scenario is generated. In this scenario, the bunker prices will climb up to $250 per tonne. It is assumed that demand for each service will increase 3.4% annually. The round trip days, number of ships on the service, annual round trip per ship, number of port of calls, port charges, and annual additional costs are assumed as same as the present. It is proposed that CKYHE is the first rational player who needs to take a rational action regarding to capacity deployment decision-making due to its lower profit. Then the G6 is the second rational player and the 2M and O3 are adaptive players. It is assumed that the competition game is static and the players determine their best strategies by consideration of the tactical strategy behaviours of the competitor shipping alliances.
According to the given scenario each player has 2 available strategy options given below: 1- No average ship capacity increase on the current average ship capacity
2- 2000 TEU capacity increase on the existing average ship capacity
Therefore, the pure strategy combinations of the alliances for capacity deployment decision making are given as following:
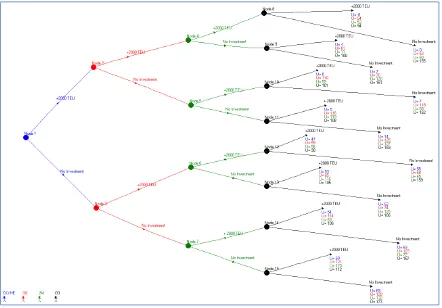
The Cournot-Nash complete information quadropoly game model is generated on available commercial software called GamePlan 3.7 and illustrated in figure 4. The game model of the given case study scenario includes following elements:
The name and order of the players, and their strategy options The decision node connections of the players
Figure 4 – Game model of the case study
7. Results
Figure 5 – Freight rates according to strategy combinations
The methodology applied in this study provides changes of the costs per TEU transported of the alliances for each strategy combination. The cost per TEU changes of the alliances based on the strategy combinations are given in figure 6. According to determined cost behaviours, the CKYHE shipping alliance has competitive cost disadvantage against other shipping alliances for all strategy combinations. On the other hand, for all players, whilst the capacity increase decision increases the costs, the no capacity increase investment decision reduces the costs.
Figure 6 –Costs per TEU transported according to strategy combinations $620 $625 $630 $635 $640 $645 $650 $655
1 2 3 4 5 6 7 8 9 10 11 12 13 14 15 16
Fr eig h t Ra tes Strategy Combinations Freight Rate $450 $470 $490 $510 $530 $550 $570 $590 $610 $630 $650
0 1 2 3 4 5 6 7 8 9 10 11 12 13 14 15 16
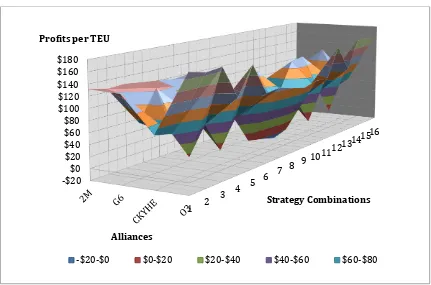
[image:18.612.139.535.481.681.2]The figure 7 illustrates the profit distribution of the shipping alliances in a 3D form according to each given strategy combinations. From the given figure it is possible to see the deep and peak points of the profit distributions for each shipping alliance.
Figure 7 – Profit distribution according to strategies of the alliances
The figure 8 provides the Nash equilibrium solution results of the game. The strategy combination 1 is determined as the equilibrium point of the game which is illustrated with a complete straight line from the node of the player 1 to player 4. Also, the results on the GamePlan 3.7 software provides some detailed numerical outcomes of the tactical strategy selection of the alliances. The “p” symbols shown in the figure 8 are the probabilities of each move at each game node. As a consequence of the utilisation of the Cournot-Nash pure strategy solution is utilised, p values found as only equal to 0 and 1. Another given symbol “e” is the expected pay offs of the strategy choices between decision nodes. “E” represents the expected pay offs of each player at each node. “U” shows the zero sum utilities (pay offs) of each final strategy moves.
1 2 3 4
5 6 7 8
9 10 11 12
13 14 15 16
-$20 $0 $20 $40 $60 $80 $100 $120 $140 $160 $180
Strategy Combinations Profits per TEU
Alliances
Figure 8 – Nash Equilibrium solution of the alliance quadropoly game
After determination of the equilibrium point of the game, the financial situations of the alliances are comparatively shown in figure 9. According to results the O3 alliance is determined as the most competitive shipping alliance.
Figure 9 – Annual costs, revenue and profit of the alliances in equilibrium point $0
$100 $200 $300 $400 $500
2M G6 CKYHE O3
Mi
ll
io
nen Annual Voyage Costs ($)
[image:20.612.112.516.536.687.2]8. Conclusion
This study addresses the development a game theoretical analysis tool for the liner container shipping alliance competition on a particular liner service loop. The study integrates shipping economics practices with capacity deployment related tactical decision making concepts. In this study, it is clearly emphasised that the capacity deployment decision making on a specific liner service loop should include the competitive behaviour of competitors. According to the obtained results, O3 shipping alliance is determined as the most competitive shipping alliance and CKYHE shipping alliance is found as the least competitive shipping alliance. Recent merge of the Cosco- CSCL and Cosco’s decision to be a part of O3 shipping alliance is supporting the results of this study.
Acknowledgements
This research is funded by Turkish Government. Authors specially thank to National Education Ministry of Turkey for their financial support.
References
ABITO, J. M. M., 2005, Overtonnaging in liner shipping cooperative agreements: a non-cooperative game theory approach. Working paper, National University of Singapore. ACCIARO, M., 2011, Service differentiation in liner shipping: advance booking and express services, International Journal of Shipping and Transport Logistics, 3(4), 365-383.
AGARWAL, R., and ERGUN, O., 2010, Network design and allocation mechanisms for carrier alliances in liner shipping. Operations Research, 58(6), 1726-1742.
ALPHALINER, 2015, Alphaliner Newsletters, Date of access: 20/03/2016. http://www.alphaliner.com/
CHATTERJEE, B., 2009, An optimisation formulation to compute equilibrium in finite games. International conference on methods and models in computing science, Delhi, India. DIMITRIOU, L., TSEKERIS, T., and STATHOPOULOS, A., 2007, Competitive network design in short-sea liner markets using agent-based game-theoretic models. 1st International conference on competitiveness and complementarity of transport modes-perspectives for the development of intermodal transport, Aegean University, Chios, Greece.
DOI, M., OHTA, H., and ITOH, H., 2000, A theoretical analysis of liner shipping conferences and strategic alliances. Review of Urban and Development Studies, 12(3), 228-249.
DREWRY, 2016, Consolidation in the liner industry, White paper, Drewry Maritime Advisors.
ELSADANY, A. A., AGIZA, H. N., and ELABBASY, E. M., 2013, Complex dynamics and chaos control of heterogeneous quadropoly game. Applied Mathematics and Computation, 219(24), 11110-11118.
GKONIS, K. G., and PSARAFTIS, H. N., 2007, Some key variables affecting liner shipping costs. Working paper, National Technical University of Athens.
GRANT, R. M., 1996, Toward a knowledge-based theory of the firm. Strategic Management Journal, 17(S2), 109-122.
GREVE, H. R., 2009, Bigger and safer: the diffusion of competitive advantage. Strategic Management Journal, 30(1), 1-23.
KUO Y., and LUO, M., 2015, Strategic capacity competition and overcapacity in shipping. Maritime Policy and Management, 1-17.
LINSTAD, H., ASBJORNSLETT, B. E., and STROMMAN, A. H., 2016, Opportunities for increased profit and reduced cost and emissions by service differentiation within container liner shipping. Maritime Policy and Management, 43(3), 280-294.
NASH, J. F,, 1950, Non-cooperative games. PhD thesis, University of Princeton
PANAYIDES, P. M., and CULLINANE, K., 2002, Competitive advantage in liner shipping: a review and research agenda. International Journal of Maritime Economics, 4(3), 189-209. PANAYIDES, P. M., and WIEDMER, R., 2011, Strategic alliances in container liner shipping. Research in Transportation Economics, 32(1), 25-38.
PROGOULAKI, M., and THEOTOKAS, I., 2010, Human resource management and competitive advantage: an application of resource-based view in the shipping industry. Marine Policy, 34(3), 575-582.
SARIVASTAVA, R. K., FAHEY, L., and CHRISTENSEN, H. K., 2001, The resource-based view and marketing: the role of market-resource-based assets in gaining competitive advantage. Journal of Management, 27(2001), 777-802.
SHI, X., and VOSS S., 2011, Game theoretical aspects in modelling and analysing the shipping industry. In: Computational Logistics, edited by J. W. Bose, H. Hu, C. Jahn, X. Shi, R. Stahlbock, S. Voss. Lecture Notes in Computer Science, Vol. 6971 (Berlin: Springer Berlin Hiedelberg), pp.302-320.
SHI, X., and VOSS, S., 2008, Iterated cooperation and possible deviations between liner shipping carriers based on noncooperative game theory. Transportation Research Record: Journal of the Transportation Research Board, 2066(2008), 60-70.
SONG, D. W., and PANAYIDES, P. M., 2002, A conceptual application of cooperative game theory to liner shipping strategic alliances. Maritime Policy and Management, 29(3), 285-301.
STOPFORD, M., 2009, Maritime Economics (London, U.K., and New York, U.S.A.: Routlegde)
UNCTAD, 2014, Review of maritime transport 2013,United Nations Publication, Geneva, Switzerland.
WANG, Y., MENG, Q., and DU, Y., 2015. Liner container seasonal shipping revenue management. Transportation Research Part B: Methodological, 82, pp.141-161.