City, University of London Institutional Repository
Citation
:
Wilson, D.T., Hawe, G.I., Coates, G. and Crouch, R.S. (2013). A multi-objective
combinatorial model of casualty processing in major incident response. European Journal of
Operational Research, 230(3), pp. 643-655. doi: 10.1016/j.ejor.2013.04.040
This is the published version of the paper.
This version of the publication may differ from the final published
version.
Permanent repository link: http://openaccess.city.ac.uk/14437/
Link to published version
:
http://dx.doi.org/10.1016/j.ejor.2013.04.040
Copyright and reuse:
City Research Online aims to make research
outputs of City, University of London available to a wider audience.
Copyright and Moral Rights remain with the author(s) and/or copyright
holders. URLs from City Research Online may be freely distributed and
linked to.
Innovative Applications of O.R.
A multi-objective combinatorial model of casualty processing
in major incident response
Duncan T. Wilson
⇑, Glenn I. Hawe, Graham Coates, Roger S. Crouch
School of Engineering and Computing Sciences, Durham University, South Road, Durham DH1 3LE, UK
a r t i c l e
i n f o
Article history:
Received 21 September 2012 Accepted 21 April 2013 Available online 30 April 2013
Keywords: Scheduling
Combinatorial optimization Emergency response
a b s t r a c t
During the emergency response to mass casualty incidents decisions relating to the extrication, treat-ment and transporting of casualties are made in a real-time, sequential manner. In this paper we describe a novel combinatorial optimization model of this problem which acknowledges its temporal nature by employing a scheduling approach. The model is of a multi-objective nature, utilizing a lexicographic view to combine objectives in a manner which capitalizes on their natural ordering of priority. The model includes pertinent details regarding the stochastic nature of casualty health, the spatial nature of multi-site emergencies and the dynamic capacity of hospitals. A Variable Neighborhood Descent metaheuristic is employed in order to solve the model. The model is evaluated over a range of potential problems, with results confirming its effective and robust nature.
Ó2013 The Authors. Published by Elsevier B.V.
1. Introduction
Of the four phases of disaster management described in[1]and illustrated inFig. 1, theresponsephase has received comparatively little attention from the OR research community, as noted in recent surveys of the field[2,3].
This gap is not due to a lack of demand. Calls for better decision making in terms of the coordination of organizations and distribu-tion of resources during the response to mass casualty incidents (MCIs) can be found in reports on such recent disasters as the Madrid terrorist bombings of March 11th 2004[4]and the London terrorist bombings of July 7th 2005[5]. In this study, we seek to help satisfy this demand by identifying a specific and previously untreated decision problem met in MCI response, designing a mathematical model of this problem and specifying a solution methodology which can generate high quality solutions in a timely manner.
1.1. Casualty processing in MCI response
A significant component of any MCI response operation is the delivery of casualties to a hospital where they can undergo com-prehensive treatment for their injuries. In order to complete such a delivery for any one casualty, several tasks may be required. In
the case where the casualty is trapped (for example, under fallen debris), then time must be spent on their extrication. If the casu-alty is in a unstable condition, before this extrication can take place they will require stabilizing treatment to ensure the process can be carried out safely. Following their extrication, the casualty will be taken to a nearby safe area denoted the Casualty Clearing Station (CCS), where they will receive any necessary treatment required to ensure their safe subsequent transportation to a hospital, which must be specified from a number of candidates. This sequence of events, which we will refer to ascasualty processing, is illustrated inFig. 2.
In the UK the thirteen objectives shown inTable 1, which are ‘‘in no particular order of prominence’’[7], are held during the re-sponse to any disaster. The importance of effective casualty pro-cessing in terms of achieving objectives (i) and (ii) is clear, with an effective casualty processing operation ensuring the timely delivery of casualties to hospitals in a manner which reflects the injury profiles of casualties and the capabilities and capacities of hospitals.
1.2. Resource management models for major incident response
Decision support tools aimed at assisting in some area of resource management in disaster response have covered a broad range of objectives and decision variables. We now review these tools with the aim of identifying to what extent they cover casualty processing, i.e. to what degree they provide support for the rele-vant decisions and the associated objectives of saving lives and relieving suffering.
Several examples of models which give no explicit consider-ation to the processing of casualties exist in the literature. Such
0377-2217Ó2013 The Authors. Published by Elsevier B.V.
http://dx.doi.org/10.1016/j.ejor.2013.04.040 ⇑ Corresponding author. Tel.: +44 (0) 1904 659005.
E-mail address:[email protected](D.T. Wilson).
Contents lists available atSciVerse ScienceDirect
European Journal of Operational Research
j o u r n a l h o m e p a g e : w w w . e l s e v i e r . c o m / l o c a t e / e j o r
Open access under CC BY license.
work has generally focussed on either the distribution of emer-gency responder units to areas which require their attention, or on the distribution of some vital commodities such as food and medicine around the affected area. Of the former type [8–12], a varying degree of detail in the modeling of casualties is present. Only[9]considers casualties explicitly in their model, providing a means with which to forecast the number of fatalities resulting from any proposed responder assignment which they use as an objective function. The proposed method considers the overall changes on the entire casualty group incurred due to factors such as delayed rescuing or delayed transportation to hospital. In con-trast, [8,10–12] all employ objectives relating to how long the response operation takes and do not consider casualties explicitly. Due to the abstract nature of the tasks to which responders are assigned, it may be possible to interpret them as the tasks required when processing casualties. However, no details regarding how this could be implemented are given.
[image:3.595.138.451.73.250.2] [image:3.595.98.494.278.352.2] [image:3.595.36.285.401.518.2]Considering models focussing on the distribution of vital goods
[13–23], common objectives used in the models include the mization of the cost of transporting the goods in question, mini-mizing the time taken to distribute the goods, and the
minimization of unsatisfied demand. The models described in
[17,21] are notable for their inclusion of objectives designed to maximize the ‘‘fairness’’ of the distribution by examining the larg-est difference between the unsatisfied demand at all locations in their problem environment. In all of these models, casualties are at best present in an implicit manner, assumed to be generating demand for the goods in question at various points in the problem environment but not being modeled explicitly.
A further set of models which address the distribution of vital goods incorporate the transportation of casualties into the same model. That is, the same vehicles used to distribute emergency supplies are used to transport casualties to hospitals or other appropriate treatment facilities. The model proposed in[15]is ex-tended in this fashion in[24–26]. These models consider casualties as another good or commodity which requires transportation from supply points to demand points, and as such the same commodity flow objectives of minimizing transportation cost and unsatisfied demand as used above are employed, albeit with weights used to differentiate between casualties and goods. In[27]the authors de-scribe a model based upon the vehicle routing problem which includes the specification of the routes to be taken by response helicopters and at which point on these routes they should collect casualties to return them to base. In[28]the problem of evacuating civilians in an urban environment whilst simultaneously directing responders into the environment is modeled, where the objective is to minimize the total travel time with different groups being assigned different priorities. The problem of assigning ambulances to clusters of casualties is described in[29]and developed in[30], where a model for online (i.e. making decision sequentially rather than simultaneously) use is described. The model advises where an ambulance should be sent once it becomes free, and then to which hospital it should transport its charge. The model does not account for other parts of casualty processing, nor does it approach the problem in a holistic manner.
The decision problem of assigning patients to operating rooms is addressed in[31], although not in the context of major incident
Fig. 1.The four phases of disaster management.
Fig. 2.An example of the processing of a single casualty in an MCI (adapted fromFig. 1of[6]).
Table 1
The thirteen objectives of response in the UK[7].
(i) Saving and protecting human life (ii) Relieving suffering
(iii) Protecting property
(iv) Providing the public with information
(v) Containing the emergency; limiting its escalation or spread (vi) Maintaining critical services
(vii) Maintaining normal services at an appropriate level (viii) Protecting the health and safety of personnel (ix) Safeguarding the environment
(x) Facilitating investigations and inquiries (xi) Promoting self-help and recovery (xii) Restoring normality as soon as possible
response. Rather, the authors propose an optimization model based around a bulk service queuing model to assist in the alloca-tion of operating theater slots to patients who have been catego-rized as requiring the attention of a specific medical discipline. Although the model is designed to assist decision making over a much larger time-period and at a coarser grain than that which would be required in major incident response, the categorization of patients into separate classes could be beneficial in such a set-ting where some casualties may require the attention of specialist staff and facilities (for example, burns units). Only two pieces of work have been found to address the treatment of casualties in the major incident response environment [32,33]. Survival time distributions are employed in[33]in a model designed to suggest from which of a number of health classes a casualty should be se-lected whenever an operating room becomes free, with the aim of minimizing the expected number of fatalities. In contrast, the model detailed in[32]considers the treatment of casualties taking place at the disaster scene, attempting to prescribe optimal se-quences of patients to medical teams with the same aim of mini-mizing expected fatalities. However, in both cases the related decisions of how casualties should be rescued and how they should be transported to hospital are not incorporated.
1.3. Contribution of this paper
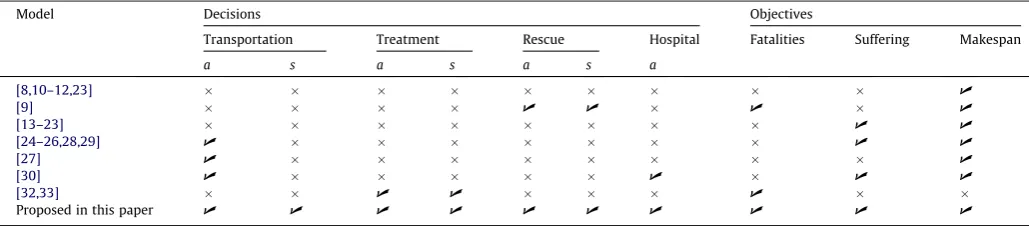
Whereas a number of models have been developed to give deci-sion support to a tactical decideci-sion maker during disaster response (seeTable 2), there has yet to be any comprehensive treatment of the entire casualty processing procedure. We hypothesize that a model which incorporates a high level of detail with regards to this area, allowing for control at the level of individual casualties and spanning the entire processing time-line, will lead to significant efficiencies in response operations and a corresponding contribu-tion towards objectives (i) and (ii) as listed inTable 1. Furthermore, we propose that a task scheduling framework, such as that provided by the Flexible Job-Shop Problem (FJSP), would provide an appropriate foundation for such a model to be built upon.
In Section2we will describe how the standard FJSP formulation can be adapted to accommodate the unique characteristics of the casualty processing problem, resulting in a new variant of this combinatorial optimization problem. A corresponding solution methodology will then be described in Section3. In Section4the proposed model will be evaluated across a range of problem types. Finally, concluding remarks and suggestions for further research are given in Section5.
2. Model
2.1. The flexible job-shop scheduling problem
The flexible job shop scheduling problem is a variant of the Job Shop Scheduling Problem (JSP), and is defined in[34]as follows.
We are given a set of machinesM= {Mk}, 16k6mand a set of
JobsJ= {Ji}, 16i6n. Each jobJiconsists of a sequence ofniordered
operationsOi,j, 16j6ni. Each operation may be processed by a
subset of machinesMi,j#M, with machineMk2Mi,jhaving a fixed
and predetermined processing timePi,j,kfor the operationOi,j. It is
assumed that all machines are available from time zero, that a machine can process at most one operation at a time, and that preemption is not allowed.
The objective of the standard FJSP is to minimize the makespan, that is, the latest completion time of all jobs, by finding the optimal allocation of operations to machines and the correct ordering of operations on these machines.
2.2. Casualty processing as a FJSP variant
The FJSP model requires some alterations before it can be con-sidered an adequate representation of the casualty processing problem faced in MCI response. Before we give the details of these alterations, we first note the problem elements which can be di-rectly mapped:
1. Jobs?Casualties,ci2 C;16i6nc, wherencis the total
num-ber of casualties;
2. Operations?Tasks, ti;j2 T;16j6nt;i, where nt,i is the total
number of tasks associated with casualtyci;
3. Machines?Responder units,rk2 R;16k6nr, wherenris the
total number of responder units.
Details of which tasks and responder units are included in our model are given in Table 3. The relationships between tasks, responders and casualties is illustrated in Fig. 3, showing which tasks are required for a casualty in a specific state, ordered from left to right in terms of the dependency relations, together with the responder units capable of performing each of these tasks.
In addition to a set of responders, casualties and associated tasks, the model also requires a number of further components and details. Firstly, a set of hospitalsH ¼ fhlg;16l6nh, to which
casualties may be transported is needed. Secondly, an undirected graph G representing the transport network which spans all geographical areas of interest must be specified. This network will include the nodes specifying the locations of hospitals, disaster sites and emergency service stations. We also require some detail regarding each casualty within the model, specifically a binary sta-bility variable indicating whether stabilizing treatment is required cs
i, a binary ‘trapped’ variable indicating whether or not the
casu-alty requires extricationce
i, and a triage level associated with their
initial healthct
i. Triage is a procedure carried out in MCIs where the
[image:4.595.43.558.641.754.2]health of each casualty is briefly assessed in order to estimate the extent of their injuries. The result of this procedure is a designated triage level, which can take one of the four values shown inTable 4 [35]. In the UK, following a major incident, it is standard policy to require a full triage operation be completed before any treatment
Table 2
A summary of the decision variables and objectives employed in models of disaster response. Decisions are denoted asafor allocation,sfor sequencing.
Model Decisions Objectives
Transportation Treatment Rescue Hospital Fatalities Suffering Makespan
a s a s a s a
[8,10–12,23] U
[9] U U U U
[13–23] U U
[24–26,28,29] U U U
[27] U U
[30] U U U U
[32,33] U U U
is administered to any casualty. As such, we note that it is reason-able to assume that the proposed model can be initialized after this triage operation has been completed and will therefore have access to all relevant information including the number of casualties and their health, stability and need or otherwise of extrication.
A solution to the casualty processing problem must include an ordered list of tasks to be allocated to each responder, as is the case with the basic FJSP, together with an assignment of each casualty to a hospital. Specifically, a solution can be defined by a mapping s:T ! R N HSf0g, so that every taskti;j2 T has an
associ-ated responder tr
i;j2 R, priority level t p
i;j2N and hospital
th i;j2 H
S
f0g, where h= 0 for all tasks other than transportation tasks.
2.3. Translating solutions to schedules
In order to evaluate the casualty processing of a solution as de-fined above we must first combine the solution information with knowledge of the problem environment in order to create a sche-dule; that is, to predict when each task will start and finish. As illustrated in Fig. 4the tasks within our model are distributed across a geographical area and as such we must account for the time needed for responder units to travel from the end location of one to the start location of the other. By applying Djikstra’s algorithm to the transport networkGwe can determine the route to be taken by responders on such journeys. The distance traveled on this route,dkilometers, can then be fed into the model
de-scribed in[36]to generate a median transportation time. The mod-el is of the form
^
mðdÞ ¼ 2:42
ffiffiffi d p
;d64:13 kilometers
2:46þ0:596d;d>4:13 kilometers
(
where the time is given in minutes. The model was fitted to data describing the travel times of the ambulance service in Calgary, Canada. In the absence of emergency service travel time data for the UK, this was taken to be a sufficient approximation. The times given are then built into the scheduling process, transforming our basic FJSP into a FJSP withsequence dependent setup time[37]. This same method is employed when calculating the duration of trans-portation tasks, which varies according to which hospital the casu-alty in question has been allocated to. All other task durations are supplied as problem input. Using all task duration and travel time information, a solution of the form given in Section2.2can be trans-lated into a work schedule specifying the start and finish times of each task by using the standard left-shift method, where tasks begin as soon as possible in a manner which respects both dependency relations and priority level.
2.4. Evaluating schedules
The standard FJSP objective function of makespan is not an appropriate measure of quality for the casualty processing prob-lem, where the time taken to finish a response operation is incidental when compared with the resulting number of fatalities and the level of suffering endured by survivors. We propose a mul-ti-objective approach to evaluating solutions, considering the following five objectives:
f1(s) = the expected number of fatalities,
f2(s) = measure of how quickly casualties are delivered to
hospital,
f3(s) = measure of how appropriate the hospital allocation
choice is,
Table 3
The tasks and responders considered in the model.
Name Description
Tasks
Transport All casualties require transportation to a hospital Pre-transport
treatment
Those casualties whose condition is unstable require a period of treatment/stabilization to be carried out to ensure their safe transportation
Rescue Casualties may be trapped by debris at the disaster site, in which case a Rescue task must be completed to ensure their extrication Pre-rescue
treatment
Of those casualties who are trapped, some may require a period of treatment/stabilization before the Rescue operation commences in order to ensure their safety
Responders
Ambulance An Ambulance unit includes a paramedic team, and can both administer treatment at a CCS and transport casualties to hospital MERIT A Medical Emergency Response Incident Team is a mobile team of clinicians who can travel to any mass casualty incident and administer
treatment to the wounded at the CCS
HART A Hazardous Area Response Team consists of paramedics equipped with the necessary equipment and training to allow them to administer stabilizing care to casualties in high risk environments, i.e. those who are trapped
SAR A Search And Rescue team can rescue trapped casualties from disaster sites and deliver them to the associated CCS
transport pre-transport
stabalizing treatment pre-rescue
stabalizing treatment
rescue casualties
Ambulance MERIT
HART SAR
[image:5.595.31.552.87.230.2]trapped unstable
[image:5.595.56.261.265.414.2]Fig. 3.The relationships between casualties, tasks and resources.
Table 4
Triage levels assigned to casualties.
Category Description Explanation
T1 Immediate Require immediate life-saving procedure T2 Urgent Require surgical or medical intervention within 2–
4 hours
T3 Delayed Less serious cases whose treatment can safely be delayed beyond 4 hours
f4(s) = the total time spent idle by responders,
f5(s) = the latest time at which a casualty arrives at a hospital,
i.e. the makespan.
We group the above objectives into three classes:fatalities, con-sisting off1alone;suffering, consisting off2andf3; and finally
effi-ciency, consisting of the final two objectives. In what follows we will describe eachfiindividually, after which we will discuss how
to combine them in a multi-objective framework.
2.4.1. f1– fatalities
In order to predict the number of fatalities resulting from a re-sponse operations, we first note which casualtiesc2 Care in a dan-gerous environment at any point. As illustrated inFig. 2, a casualty can be in one of four environments during a response operation: trapped at the disaster site; at a Casualty Clearing Station; in an ambulance; or at a hospital. We assume that the latter three envi-ronments are of a relatively stable nature and casualties will not deteriorate in health over the course of the operation when in them. For casualties trapped at the scene, however, we acknowledge the risk of further injury and the deterioration of health.
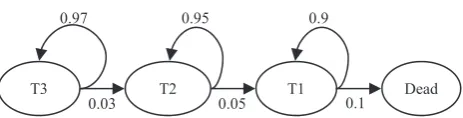
Given the discrete nature of triage classification we propose a discrete state Markov chain model of casualty health in a similar fashion as in [38], with a state space L= {T1,T2,T3,D} denoting the four triage levels described inTable 4(whereDcorresponds todead). This approach allows the calculation of the probability that casualtyciwill be in stateT2Lat time
s
under the proposedsolution, which we shall denote bypT
ið
s
Þ. The parameters used inthe Markov chain are given inFig. 5.
Two health states are linked if it is possible to move from one to the other in any given time step, where a time step represents 1 minute. As can be see fromFig. 5, only negative health progres-sion is possible when a casualty is trapped at the scene. This meth-odology is attractive since it can provide not only an estimated probability that any trapped casualty will be deceased before they reach a Casualty Clearing Station, but also the probabilities of the casualty being in all other health states at any time which in turn leads to more accuracy when prioritizing casualties according to their health. However, a limitation of this approach is the neces-sary assumption of the Markovian property, which states that the stochastic process must be memoryless. In the context of our prob-lem, this translates to assuming that the probability of a casualty’s health deteriorating from one level to the next is dependent only on their current state, not on how long they have occupied it. With-out sufficient data it is difficult to determine whether or not this assumption holds. Further discussion of this limitation is provided in Section5.1.
Denoting by
s
Ci the time at which casualtyciarrives at a
Casu-alty Clearing Station (possibly after being extricated), the Markov chain model is used to calculatepD
ið
s
CiÞfor each casualty. We cantherefore define the fatality component of the objective function to be
f1ðsÞ ¼
Xnc
i¼1
pD i
s
C
i : ð1Þ
2.4.2. f2– hospital arrival time
Firstly, we note that the prioritization of casualties in a way which respects their triage level is essential to a high-quality response, by the very definition of triage. This can be achieved through the use of a weighted total flowtime measure. Here, we sum the completion times of each casualty’s processing, i.e. the time at which they are delivered to a hospital, denoted
s
Hi for casualtyci.
Each time is weighted by the parameter wT, where T2L=
{T1,T2,T3,D}. This defines the second objective function component,
f2ðsÞ ¼
X
T2L
wT X
nc
i¼1
pT i
s
Hi!
: ð2Þ
The weights used have been set in accordance with the descrip-tion of triage levels given inTable 4, where we set a 24 hour delay in the treatment of aT3 casualty to be equivalent to a 4 hour delay in the treatment of aT2 casualty. This in turn is set to be equivalent to a 15 minute delay in the treatment of a T1 casualty. That is, taking wT3= 1, we calculate wT2¼244wT3¼6 and wT1¼0:425
wT2¼96. The weight corresponding to the dead is set atwD= 0.1
in order to ensure the model places only limited value on the prompt transportation of fatalities to hospital in comparison to the transportation of injured survivors.
2.4.3. f3– hospital allocation
[image:6.595.75.533.64.238.2]In order to quantify how well casualties have been allocated to hospitals, we must consider two factors: the dynamic capacity of
Fig. 4.The work schedule and associated travel path of an ambulance.
[image:6.595.322.554.273.332.2]each hospital and the effect of oversubscription; and the pairing of specific injuries of individual casualties to the corresponding spe-cialist treatment facilities. An initial treatment of this problem can be found in[39], which we build upon in this paper.
Hospital capacity. We consider two factors which will result in a dynamic variation of a hospital’s available capacity. Firstly, the effect of a hospital enacting its major incident plan. Secondly, the effect of casualties autonomously leaving the disaster scene and transporting themselves to self-present at a hospital of their choosing.
The result of a hospital’s major incident plan being enacted is a steady increase in its capacity. We characterize this process using the following parameters:
hxl: Initial free capacity hyl: Maximum capacity
hhl: Constant rate at which hospitalhlcan increase capacity
untilhyl is reached
Given these values, the capacity of the hospital in question is modeled as increasing at the constant rate ofhh
l from time
s
= 0to time
s
¼ hylh x l
=hhl.
In order to forecast the effects of self-presentation we must estimate the number of casualties at each disaster site who will self-present, which hospitals they will choose, and how long they will wait before leaving the scene. We recognize that the severity of casualty injury plays an important role in determining whether or not self-presentation is an option. Accordingly, our model allows self-presentation only for casualtiescisuch thatcpi ¼T3. Under this
assumption, the following parameters are required:
spp: Probability of a T3 casualty self-presenting spa: Parameter describing how the attractiveness of a
hospital varies with distance
spw: Length of the interval over which self-presenters’
waiting times will be uniformly distributed
To determine a measure of the attractiveness of a given hospital hto a self-presenting casualty at sitedwe compute the measure g(d,hl) = exp(spad(d,hl)) whered(d,hl) is the estimated travel time
from sitedto hospitalhl. This measure is computed for eachhl,
after which all values are normalized to give the proportion of self presenting casualties at sitedexpected to travel to each hospitalh, denotedN(d,hl). These values are then used to create arrival
distri-butions for each casualty-hospital pair, where casualties begin to arrive at time d(d,hl) and continue arriving at the constant rate
N(d,hl)/spwuntil time
s
=d(d,hl) +spw.For each hospital considered part of the model, we now have: a list of scheduled arrival times of casualties of each triage level; a list of anticipated arrival times of T3 casualties self-presenting; and an anticipated rise in capacity due to major incident plans. This information is combined to predict the total waiting time of casu-alties of each triage level at the hospital. In order to do so, we make the following assumptions:
(i) a casualty arriving at a hospital with free capacity is imme-diately admitted to a bed, thus consuming a capacity unit, regardless of their triage level;
(ii) once a casualty has been admitted, they will occupy it for the duration of the response operation;
(iii) when there is a queue of casualties at a hospital awaiting admittance, they will be allocated in an order which reflects
their triage level irrespective of their time of arrival at the hospital.
While assumptions (i) and (iii) are not controversial, assumption (ii) may not be realistic for casualties with light injuries when the re-sponse operation continues for several hours. This assumption could be easily rectified given data regarding the length of stay of such lightly injured casualties. In the absence of such data, we restrict our attention to MCIs where the response operation is anticipated to take 1–3 hours, thereby reducing the impact of this assumption.
An illustration of a hospital finding itself over-subscribed is given inFig. 6, where the cumulative casualty arrivals exceeds the available capacity over a period of time. The shaded areas de-note the proportion of those waiting for treatment of each triage level. The information we take from this are the areasQT1, QT2
andQT3, representing the total untreated waiting time of casualties as grouped by triage level. For a specific hospitalhlwe denote these
values asQTl forT2L.
Hospital capability. Given a specific injury type (e.g. severe burns or spinal injury) denotedI, we wish to include in the model suffi-cient detail to ensure an allocation matching injury types to treat-ment facilities is preferred. In order to do so, we define a set of penalty termspenaltyI,T. Each value can be interpreted as ‘the
max-imum delay in the treatment of a casualty with injuryIand health stateTwhich could be tolerated in order to ensure they are treated at an appropriate specialist facility’. This interpretation ensures the practitioner using the model as an aid in decision making will have a clear understanding of the parameters involved. Given this set of terms, we calculate for each casualtycithe valuebi, wherebi=
-penaltyI,Tif casualtycihas injury of typeIand triage levelTbut is
not taken to a hospital with the corresponding treatment facilities, and 0 otherwise.
Combining the above terms gives a total measure of how well casualties have been allocated to hospitals, accounting for both dynamic capacity levels and heterogeneous treatment facilities:
f3ðsÞ ¼
X
T2L Xnh
l¼1
wTQTl !
þ X
nc
i¼1
bi !
: ð3Þ
2.4.4. f4– idleness
We wish to include a measure of how much time is spent by responders in an idle state, neither completing a task nor traveling to their next location. In addition to an expected correlation be-tween idleness and the other objectives (that is, a solution where all responders are constantly busy is likely to be of high quality in other respects), we also note that any perceived idleness can have a negative impact on the public’s impression of the quality of the response operation. Total idleness can be calculated easily from any given schedule by summing all intervals between the end of one task and the time where the responder either leaves to travel to the site of their next task (or, if the next task is at the same location, begins work on this task).
2.4.5. f5– makespan
2.5. The casualty processing model
As previously mentioned, the five objectives considered in our model can be partitioned into three categories:
1. fatalities–f1,
2. suffering–f2,f3,
3. efficiency–f4,f5.
We view the optimization of these three categories in a lexico-graphic[40]sense, assuming that the minimization of fatalities is infinitely more important to the emergency response decision ma-ker than the minimization of suffering, which in turn is infinitely more important than the minimization of (inverse) efficiency. This approach takes advantage of the clear natural ordering of the objective classes, although we note that in practice it may lead to the efficiency measures being overlooked, particularly when only a short period of time is available in which to search for solutions. Within each category we employ a method of weighted metrics
[41] to convert the multi-objective sub-problem into a single objective one. Specifically, for any set of objectivesK, our problem takes the form
min
s2S gKðsÞ ¼
X
i2K
wijfiðsÞ z
ij
2
!1=2
; ð4Þ
the method of least squares.1In order to employ this method we
must set the utopia point z⁄, an infeasible point in the objective
space used to provide guidance to the search. For objectivesf1,f2
andf4we simply setzi ¼0. For objectivef2, hospital arrival time,
we obtain an infeasible lower bound by supposing each casualty arrives at hospital at the earliest possible time (i.e. all relevant tasks must be completed) and at the same triage state as at time
s
= 0. For objectivef5, the makespan, we use the latest of such idealizedhospi-tal arrival times. As described in[42]the use of a weighted metric method to aggregate separate objective measures will only be capa-ble of finding points in all parts of the corresponding Pareto set when the Pareto curve is convex, which may not always be the case in our model. However, due to the limited time available in which to search
for high quality solutions we note that this shortcoming will rarely be felt.
In addition to defining the utopia point, we must also set the relevant weights wi. In the case of suffering, we set w2= 1 and
w3= 0.5, corresponding to a belief that a fixed time spent waiting
at a hospital is twice as preferable as that same time spent waiting at a disaster scene. All other weightswihave been set as 1.
The full multi-objective model can now be defined as
min
s2S gf1gðsÞ;gf2;3gðsÞ;gf4;5gðsÞ: ð5Þ
Regarding model fitting, we note that the lexicographic ap-proach employed helps to minimize the need for setting weights. What weights are required by our model have been estimated through a mixture of common sense and ad hoc experimental evaluation. Clearly there is a need to consult with appropriate practitioners and seek relevant data in order to refine and validate the choice of parameters if the model is to be considered for prac-tical use. However, the goal of this paper is to take the first step in evaluating the potential of the proposed model, and so this is left to future work. We will return to this point in Section5.1.
3. Solution methodology
In order to evaluate the utility of the casualty processing model described in Section2, we must implement a solution methodol-ogy in order to solve it. For the purpose of this paper, a variant of the popular Variable Neighborhood Search (VNS) procedure, Vari-able Neighborhood Descent (VND), will be used. The metaheuristic VNS[43]has been shown to perform well over a range of combina-torial optimization problems including vehicle routing[44], timet-abling[45]and scheduling[46]. Moreover, it can be implemented quickly and easily. We note that the proposed routine is designed purely for the purpose of enabling model evaluation – the design and implementation of a more detailed, powerful solution method-ology will be the focus of future work. We also note that a VNS was implemented on a FJSP in[46]with results comparable to any oth-ers published. In addition to the VND algorithm, we also describe a constructive heuristicU. This will be used both to provide the VND algorithm with an initial solution, and to allow for comparison between the proposed model and a non-temporal decision making methodology.
3.1. Constructive heuristic
The proposed constructive heuristic Uhas been designed to give an approximation of decision making in casualty processing in practice. Whereas the model described in this paper makes use of the temporal nature of the problem, forecasting over the whole of the response operation in order to better ‘plan ahead’, this is not achievable to any great extent under the current decision making structure. Rather, each decision is made in a ‘greedy’ fash-ion, selecting the option which gives the maximum benefit at that point in time.
Decision making occurs at two points, when a responder fin-ishes a task and when a transportation task is issued. In the former case, we must decide which task the responder in question should next complete, whereas in the latter we decide to which hospital the casualty in question should be taken to.
3.1.1. Selecting a task
Given a set ofncriteria which can be applied to any taskt,gi(t),
[image:8.595.56.284.65.234.2]i= 1,. . .,n, we apply an evaluation process based on a lexico-graphic[40]approach and described inAlgorithm 1. This approach allows for several criteria to be considered and requires only an ordering of these criteria, as opposed to a weighting. Lexicographic
Fig. 6.An illustration of casualty arrivals exceeding hospital capacity over a period of time. The shaded areas denote the proportion of ‘excess’ casualties of each triage level T1, T2 and T3.
1
approaches to multi-criteria decision making are common [47], and can be considered appropriate in this situation due to their ease of interpretation. We will return to discuss the potential shortcomings of this approach in Section5.1.
Algorithm 1. Constructive heuristicU
1: set measure functionsg1,. . .,n
2: set initial taskbest 3: for alltaskst2 T do
4: ifrcan dot& all taskstdepends on are issuedthen
5: done false,i 1
6: whiledone = false andi<n+ 1do
7: ifgi(t) >gi(best)then
8: done true
9: else ifgi(t) =gi(best)then
10: i++
11: else
12: best t
13: done true 14: end if
15: end while
16: end if
17: end for
18: issue taskbesttor
In order to employ the general approach, we must first specify a set of criteria which can be applied. These are:
1. Priority – corresponding to the triage level of the casualty; 2. Time – how soon the task can start;
3. Dependancy – the number of other tasks dependent on the completion of this one;
4. Location – the distance from the responders current location to the start location of the task.
Criteria P, D and L all take a naturally discrete form. We impose a discrete form on T by categorizing each time
s
as one off {s
= 0, 0 <s
60.5, 0.5 <s
61, 1 <s
62, 2 <s
65, 5 <s
}, wherethe units are in minutes. By assigning an order to each of the mea-sures, i.e. mapping eachgito one of P, T, D or L, the algorithm is
fully specified. Rather than pre-specifying the preference order of the proposed measures, we will empirically analyze the perfor-mance of each possible ordering in Section4in order to determine the optimal configuration.
3.1.2. Selecting a hospital
The selection of a hospital is carried out in the same manner as the selection of a task. In this case, there are three measures used in making the choice: the distance of the hospital from the current location; the capacity level of the hospital; and the presence of treatment facilities appropriate to a casualty’s injury profile. The decision is made by first restricting the choice of hospitals to those with the correct treatment facilities. Following this, if there are hospitals with free capacity then the closest of these is chosen. If not, the hospital least over capacity is chosen.
3.2. Local search framework
As discussed in Section2, a solution to our model can be defined by an associations:T !RN HSf0g, so that every taskt2 T
has an associated responderr2 R, priority levelp2Nand hospital h2HS{0}, where h= 0 for all tasks other than transportation tasks. Four neighborhood structures were implemented.
3.2.1. Priority neighborhood, P
Given a solution s, the operationpt,b(s) switches the priority
values of tasktwith the task preceding it (in the caseb= 0) or suc-ceeding it (in the caseb= 1). The neighborhood ofsunderPcan therefore be defined byPðsÞ ¼ fpt;bðsÞjt2 T;b2 f0;1gg.
3.2.2. Responder neighborhood, R
Given a solutions, the operationrt,m(s) reassigns tasktfrom its
current responder to responderm. As a result of this operation, all tasks which were succeedingtin its original responder schedule have their position parameter decreased, while all those with pPtpin the new schedule will have their position parameter
in-creased. We therefore define the neighborhood RðsÞ ¼ frt;mðsÞ
jt2 T;m2 Rg.
3.2.3. Hospital neighborhood, H
Similarly, define the operationht,h(s) as one which changes the
allocation of hospital of task t to h. Then HðsÞ ¼ fht;hðsÞj
t2Transport;h2 Hg.
3.2.4. Swap neighborhood, SW
Finally, we define the operationswt1;t2ðsÞas one which
inter-changes the responder allocation and priority values of tasks t1
andt2. ThenSWðsÞ ¼ fswt1;t2ðsÞjt1;t22 T g.
3.3. Variable neighborhood descent
Each of the neighborhood structures listed above can be gener-alized to capture a notion of size in an intuitive manner. Namely, a neighborhood of sizei= 1 consists of 100 random samples from the neighborhood structure as defined above. We limit ourselves to a finite sample due to the potentially large size of these combinato-rial neighborhoods. To generate a neighborhood of sizei= 2, we first generate a neighborhood of sizei= 1 before generating a fur-ther 100 neighbors of size 2 by selecting random pairs of size 1 neighbors and composing them in the natural way. Similarly, for a neighborhood of sizei= 3 a further stage is carried out, where 100 random triples of size 1 neighbors are composed. This routine can be carried out for any desired neighborhood sizei.
The VND algorithm is given inAlgorithm 2, and is an adapted version of the VNS presented in[46]. Specifically, the ‘shaking’ pro-cedure of the VNS is not carried out.
Algorithm 2. VND
1: generate initial solutions 2: definenbrhds {P,R,H,Sw} 3: leti 0
4: whiletime < 5 minutesdo
5: letN nbrhds[i] 6: setk 0 7: whilek< 50do
8: computes⁄ arg minN(s)
9: iff(s⁄
) <f(s)then
10: s s⁄
11: Nsize 1
12: ++k
13: else
14: Nsize++
15: i (i+ 1) mod 4 16: end if
17: end while
The algorithm continues to use a neighborhood structure until that same structure fails to return an improving solution (i.e. we reach a local minimum) ork= 50 successful iterations are per-formed, at which point the next neighborhood structure in the list nbrhdsis selected. In the case where a local minimum was found, the size of the neighborhood structure used to find it is increased for when it is returned to later. The termination criteria used is that of a real-time threshold. This is a practical measure for the problem domain in question, since emergency response decision makers will only wait a short time for decision support.
4. Application and evaluation
In order to gain a better understanding of the proposed model, in this section we apply the model to a range of problems and ana-lyze the resulting performance of the solution methodologies given above and the solutions they produce.
4.1. Problem instance generation
We vary three problem characteristics. The total number of casualties are kept the same, and the topography, in terms of hospitals and potential disaster sites, is shared. Casualties are dis-tributed over one (S1), two (S2) or three (S3) sites. We also vary the ‘dependency’ of the problem across three levels, by varying the proportion of casualties who are trapped (the ‘crush proportion’) and the proportion who require pre-transportation stabilizing treatment (the ‘treatment proportion’):
High (D3) results in a 0.5 crush proportion and 0.9 treatment proportion;
Medium (D2) gives a 0.25 crush proportion and 0.6 treatment proportion;
Low (D1) gives a 0.1 crush proportion and 0.3 treatment proportion.
HART treatment is set to be required by 0.5 of the crushed vic-tims. Varying responder levels is again done over a discrete set of low, medium and high levels, with the corresponding values R1 = 12, R2 = 24 and R3 = 36 responders.
Given these three characteristics, each of which can take three values, we are left with a total of 33= 27 distinct problem types.
For each problem type, an instance is randomly generated by determining through random sampling which casualties require which tasks.
4.2. Performance evaluation
In addition to evaluating the improvement resulting from our model when compared to the constructive heuristicU, we also wish to determine to what extent the components of our model are required in order to achieve such improvements. In particular, we are interested in answering the following questions -.
1. Is it beneficial to include hospital allocation decisions within the local search framework, as opposed to leaving them to be decided viaU?
2. Is it beneficial to include the hospital allocation term,f3, in the
objective function?
3. Is it beneficial to include task sequencing decisions within the local search framework, as opposed to leaving them to be decided viaU?
In order to answer these questions, a series of modified models were constructed. Letting M4 denote the full model described in
this paper, in M3 we remove the hospital allocation neighborhood from the VND algorithm. Decisions regarding to which hospital each casualty are to be sent are instead made using the hospital selection rule of the constructive heuristicU.
Model M2 is identical to M3 except in the objective function, where the term associated with hospital allocation,f3is omitted.
Finally, in model M1 we remove one further element, namely the neighborhood used to alter tasks sequencing. Instead, the VND pro-cedure only has control over allocating tasks to responders – the sequencing of each responder’s set of assigned tasks is decided via the constructorU.
For each problem type, the best performing heuristic configura-tion forUwas found empirically by applying each option to the problem 25 times and selecting the configuration which delivered best average performance. Using the appropriateUconfiguration to give initial solutions, the models M1, M2 M3 and M4 were em-ployed under the VND algorithm to generate a solution.
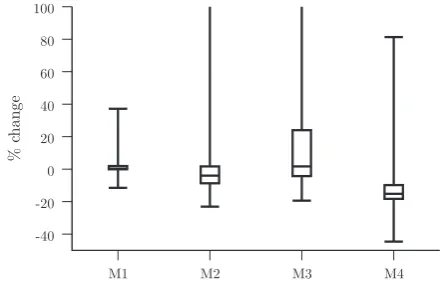
In analyzing the results of these experiments, we first compare the distributions of each objective category (fatalities, suffering and efficiency) obtained by each of the four models. These distribu-tions are summarized inFigs. 7–9.
Several interesting points can be taken from these results. Regarding the fatalities objective, we see that models 2, 3 and 4 all produce comparable results with median values 12.3%,
13.0% and 11.8% respectively. Model 1, on the other hand, shows markedly worse performance with a median value of
0.9%. Moreover, this difference in performance is statistically sig-nificant in all cases (that is, when compared to M2, M3 and M4) with apvalue of less than 2.21016
[image:10.595.326.549.399.541.2]in all cases returned under a Wilcoxon test for equal medians. We conclude that, in terms of
Fig. 7.Distribution of the change in the fatality objective category over 5 minute optimization runs for each model.
[image:10.595.325.549.588.729.2]reducing the number of fatalities in our model, it is of benefit to in-clude task sequencing within the optimization framework while the addition of hospital allocation details provides no significant value. This is to be expected, since a reduction in fatalities can be achieved primarily through improved casualty processing of those in a ‘trapped’ environment (seeFig. 2), where hospital allocation decisions have little influence.
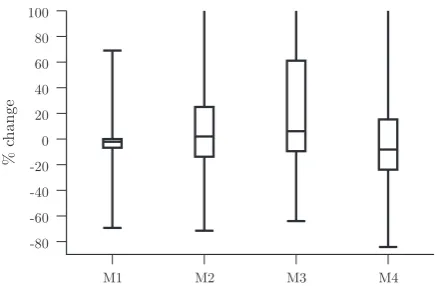
In terms of the suffering objective category,Fig. 8shows that Model M4 attains generally favorable performance in comparison to the other models. Specifically, the median % change in the case of M4 is 15.2%, a statistically significant improvement when compared with 1.7% (M3), 4.0% (M2) and 0.3% (M1) (p< 2.2
1016in all cases). Finally, it is clear fromFig. 9that performance
in the efficiency objective category is erratic and largely similar for each of the models, indicating that the lexicographic approach described in Section 2.4 has resulted in this objective category receiving little attention during the search process.
Taken together, these results support our hypothesis that a de-tailed scheduling model accounting for the temporal nature of the problem can deliver improvement in efficiency when compared with sequential decision making processes. In addition, they help answer the questions posed at the start of this section, confirming that each of the modeling features described does indeed contrib-ute to improved performance.
We now focus on how the performance of model M4 varies according to characteristics of the problem type being solved.
Tables 5–7provide the average % change in each objective category across the various levels of resources, dependency and the number of disaster sites respectively. It is clear that differences in each fac-tor have an effect on the performance of the model in at least one of the objective categories. Moreover, a Wilcoxon test of equal medians returned a significant result (p< 0.05) in all comparisons within each table except for when comparing S1 fatalities and S2 fatalities, S2 fatalities and S3 fatalities, S1 efficiency and S2 efficiency, and R2 efficiency and R3 efficiency. For example, the average % change in the suffering category differs by 13.2% when
we compare problems based at one site (18.3%) with problems based at three (5.1%) (p< 2.21016). This suggests that a
great-er spatial distribution of the MCI leads to less scope for improvement.
4.3. Detailed solution comparison
In order to further our understanding of the improvements made by VND to the heuristic starting solution, a comparison of one run on a problem of type [R2, D3, S3] is given inFig. 10.
Comparing these two solutions leads to a number of observa-tions. Firstly, we note that the makespan ofU’s solution is less than that of VND’s, with a corresponding higher level of responder uti-lization. However, the associated distribution of casualty arrival times seems intuitively sub-optimal, with a period of time from around 30–60 minute where no transportation tasks are com-pleted. In contrast, the arrival time distributions obtained by VND are smoother, progressing at a steady rate from start to finish and resulting in an increase in the total number of arrivals during the first hour of the response. Moreover, the final predicted triage level distribution is slightly favorable in the case of VND, where 38% of all casualties are expected to reach hospital in a T1 state compared with 53% in the case ofU.
Considering the networks shown in Fig. 10, we see that the solution proposed by VND results in many more transfers of responders from one site to another, either directly (black lines) or indirectly via a hospital (gray lines). This suggests an increase in the inter-site coordination of responders during a multi-site MCI can lead to improved performance.
4.4. Objective trajectory
[image:11.595.49.268.64.207.2]The final component of our analysis of the model proposed in this paper focusses on the trajectory of the three objective catego-ries (fatalities, suffering and efficiency) over the course of an opti-mization run. The variation in each of these categories over the course of a single run is illustrated inFig. 11. The lexicographic nat-ure of the formulation ensnat-ures a monotonic decrease in the fatali-ties objective, which occurs at a steady rate over the course of the search. In contrast, fluctuations in the suffering category can be seen throughout, with particularly large increases observed at the early stages. In terms of efficiency, behavior is largely erratic with no discernable pattern.
[image:11.595.301.554.88.155.2]Fig. 9.Distribution of the change in the efficiency objective category over 5 minute optimization runs for each model.
Table 5
Change in objective values (%) for model M4 across resources levels.
Fatalities Suffering Efficiency
Mean Med. Std.
dev.
Mean Med. Std.
dev.
Mean Med. Std. dev.
R1 17.8 20.0 5.7 7.3 10.2 18.2 5.1 45.9 82.9
R2 13.8 13.7 3.5 14.2 15.4 6.2 14.3 5.5 44.9
R3 9.0 9.0 2.3 15.4 16.0 4.3 0.7 4.9 17.0
Table 6
Change in objective values (%) for model M4 across dependency levels.
Fatalities Suffering Efficiency
Mean Med. Std.
dev.
Mean Med. Std. dev.
Mean Med. Std.
dev.
D1 17.6 17.6 5.0 12.2 10.9 3.6 25.6 17.2 20.0
D2 14.2 13.7 4.7 13.3 15.6 9.1 20.1 11.4 26.3
D3 8.9 9.4 1.9 11.4 17.8 18.2 55.6 34.8 64.4
Table 7
Change in objective values (%) for model M4 across the number of sites.
Fatalities Suffering Efficiency
Mean Med. Std.
dev.
Mean Med. Std.
dev.
Mean Med. Std. dev.
S1 13.0 11.6 4.9 18.3 18.3 4.1 7.7 11.2 58.5
S2 13.7 11.8 5.5 13.6 13.7 5.7 9.3 7.2 63.1
[image:11.595.304.553.204.270.2] [image:11.595.33.284.286.353.2]From this analysis we can conclude that the lexicographic approach can lead to a significant level of uncertainty in perfor-mance in the suffering and efficiency categories. While an infinite preference of fatalities over suffering has a strong practical basis, it may be beneficial to relax this constraint for the purposes of per-forming optimization, specifying an acceptable trade-off ratio which would prevent situations where a large increase in suffering in exchange for a small decrease in fatalities is deemed acceptable. All experiments reported in this paper used a real-time stop-ping criterion, set to 5 minutes. This limit was extended to 10 min-utes in order to observe the resulting gains in each objective category. The improvement observed in the fatalities objective progressed from12.3% at 5 minutes to14.7% at ten. For suffer-ing, the corresponding values were47.0% and54.1%, while for efficiency they were6.4% and19.2%. This suggests the optimi-zation problem is far from being solved under the current time constraints, with solutions of significantly higher quality being left unfound.
5. Conclusion
This paper has detailed a novel approach to delivering decision support to the emergency services during mass casualty incidents. The specific problem of resource allocation in casualty processing has not been previously addressed by the OR community. A combi-natorial multi-objective optimization model of this problem has been proposed, accounting for several key problem features includ-ing the uncertain health levels of casualties, the spatial nature of the problem and the importance of appropriate choice of hospital for any casualty. The model is of a temporal nature, using estimates
of task durations and travel times to build a predicted schedule covering the course of the response operation, thus avoiding the myopic decision making which could result from the use of a sequential, heuristic decision making process.
5.1. Future work
[image:12.595.63.541.69.357.2]Firstly, we note that the parameters of the model used in this paper should be adjusted over a sensitivity analysis. These param-eters include weights for triage levels, task duration estimates and health progression probabilities. The issues noted in Section 4.4, where the lexicographic approach was shown to lead to large
Fig. 10.A comparison of solutions generated by two methodologies for a problem instance of type [R2, D3, S3]. From top to bottom the figure shows: values of each objective category; cumulative casualty arrivals at each hospital, together with their dynamic capacities; the number of transfers of responders from one site to another via each route; the cumulative arrivals of T1 (red), T2 (orange) and T3 (green) casualties across all hospitals, together with the proportion of responders not idle (filled blue area). (For interpretation of the references to colour in this figure legend, the reader is referred to the web version of this article.)
[image:12.595.328.547.435.574.2]losses in suffering being accepted in exchange for very small gains in fatalities, could be addressed through relaxing the priority levels employed when separating the objective classes in a manner sim-ilar to that described in[48].
Given the temporal nature of the model, its performance will be dependent on the accuracy of any predicted values. In the current model, these include task durations, travel times, casualty health and autonomous casualty actions. As noted in Section 2.2, our model assumes that a full triage operation has been completed and as a result all information required to build the model is known with certainty upon initialization. In reality, it may be difficult to obtain such accurate values of these quantities, many of which may change as the response operation proceeds. A poten-tial solution to this problem is to modify the model to be of a dy-namic nature, receiving information from the problem environment in real time and updating the necessary variables. The task of effectively processing information in a disaster re-sponse environment is, however, a challenging one, and it would be wrong to assume that a supply of regular and accurate informa-tion would be available. Some potential difficulties arising from the quality and quantity of information available are discussed in[49]. In addition to a dynamic model mitigating the effect of poor parameter setting, it would also facilitate the application to inci-dents whose problem structure is of a dynamic nature. This would be the case when, for example, a further MCI occurs locally while the response to an initial MCI is ongoing, resulting in a new set of casualties which must be considered. Were such a model to be implemented in conjunction with a Monte Carlo simulation of the uncertainties present in MCI response, it would enable analysis of the value of regular information updates, a finding which could be useful to emergency response practitioners. Some preliminary work in this direction has been reported in[50].
Finally, the algorithm employed in this paper is open to further improvements both in the underlying heuristics (i.e. new neigh-borhood structures) and in the metaheuristic which controls their use (e.g. tabu search or genetic algorithms). Noting the variation in performance of both the constructive heuristic Uand the VND algorithm over the range of problems considered in this paper, we also suggest examining the application of hyper-heuristics
[51], a methodology designed to provide more robust and adaptive performance over a range of potential scenarios.
Acknowledgements
The authors gratefully acknowledge the funding provided under the UKs EPSRC Grant EP/G057516/1. Furthermore, the authors thank practitioners from Cleveland EPU, Tyne & Wear EPU, Co. Durham & Darlington CCU and Government Office for the North East. We would also like to thank Co. Durham & Darlington Fire and Rescue Service, Cleveland Fire and Rescue Service, North East Ambulance Service, Northumbria Police, and Tyne & Wear Fire and Rescue Service.
References
[1] D.P. Coppola, Introduction to International Disaster Management, Elsevier Science & Technology, 2011. <http://lib.myilibrary.com?ID=297664> (retrieved 16.07.12).
[2] N. Altaya, W.G. Green, OR/MS research in disaster operations management, European Journal of Operational Research 175 (1) (2006) 475–493,http:// dx.doi.org/10.1016/j.ejor.2005.05.016.
[3] N. Simpson, P. Hancock, Fifty years of operational research and emergency response, Journal of the Operational Research Society 60 (2009) SI26–SI39,
http://dx.doi.org/10.1057/jors.2009.3.
[4]F. TurTgano-Fuentes, D. PTrez-Dfaz, M. Sanz-Snchez, J.O. Alonso, Overall assessment of the response to terrorist bombings in trains, Madrid 11 March 2004, European Journal of Trauma and Emergency Surgery 34 (2008) 433–441. [5] London Assembly, Report of the 7 July Review Committee, 2006.
[6]B.G. Carr, J.M. Caplan, J.P. Pryor, C.C. Branas, A meta-analysis of prehospital care times for trauma, Prehospital Emergency Care 10 (2006) 198–206.
[7] Cabinet Office, Responding to emergencies: the UK central government response, Concept of Operations, 2010. <http://www.cabinetoffice.gov.uk/ sites/default/files/resources/conops-2010.pdf> (retrieved 11.02.13). [8]G. Brown, A. Vassiliou, Optimizing disaster relief: Real-time operational and
tactical decision support, Navel Research Logistics 40 (1993) 1–23. [9]F. Fiedrich, F. Gehbauer, U. Rickers, Optimized resource allocation for
emergency response after earthquake disasters, Safety Science 35 (2000) 41– 57.
[10] E. Rolland, R.A. Patterson, K. Ward, B. Dodin, Decision support for disaster management, Operations Management Research 3 (2010) 68–79, http:// dx.doi.org/10.1007/s12063-010-0028-0.
[11] F. Wex, G. Schryen, D. Neumann, Intelligent decision support for centralized coordination during emergency response, in: Proceedings of the 8th International ISCRAM Conference, 2011.
[12] F. Wex, G. Schryen, D. Neumann, Operational emergency response under informational uncertainty: a fuzzy optimization model for scheduling and allocating rescue units, in: Proceedings of the 9th International ISCRAM Conference, 2012.
[13]A. Haghani, C. Oh, Formulation and solution of a commodity, multi-modal network flow model for disaster relief operations, Transportation Research, Part A 30 (3) (1996) 231–250.
[14] G. Barbarosoglu, Y. Arda, A two-stage stochastic programming framework for transportation planning in disaster response, Journal of the Operational Research Society 55 (1) (2004) 43–53, http://dx.doi.org/10.1057/ palgrave.jors.2601652.
[15]L. Ozdamar, E. Ekinci, B. Kucukyazici, Emergency logistics planning in natural disasters, Annals of Operations Research 129 (2004) 217–245.
[16] M.-S. Chang, Y.-L. Tseng, J.-W. Chen, A scenario planning approach for the flood emergency logistics preparation problem under uncertainty, Transportation Research Part E: Logistics and Transportation Review 43 (6) (2007) 737–754,
http://dx.doi.org/10.1016/j.tre.2006.10.013.
[17] G.-H. Tzeng, H.-J. Cheng, T.D. Huang, Multi-objective optimal planning for designing relief delivery systems, Transportation Research Part E: Logistics and Transportation Review 43 (2007) 673–686, http://dx.doi.org/10.1016/ j.tre.2006.10.012.
[18] J.-B. Sheu, An emergency logistics distribution approach for quick response to urgent relief demand in disasters, Transportation Research Part E: Logistics and Transportation Review 43 (2007) 687–709, http://dx.doi.org/10.1016/ j.tre.2006.04.004.
[19] H.O. Mete, Z.B. Zabinsky, Stochastic optimization of medical supply location and distribution in disaster management, International Journal of Production Economics 126 (2010) 76–84,http://dx.doi.org/10.1016/j.ijpe.2009.10.004. [20] A. Bozorgi-Amiri, M. Jabalameli, M. Alinaghian, M. Heydari, A modified particle
swarm optimization for disaster relief logistics under uncertain environment, International Journal of Advanced Manufacturing Technology 60 (2012) 357– 371,http://dx.doi.org/10.1007/s00170-011-3596-8.
[21]Y.-H. Lin, R. Batta, P.A. Rogerson, A. Blatt, M. Flanigan, A logistics model for emergency supply of critical items in the aftermath of a disaster, Socio-Economic Planning Sciences 45 (2011) 132–145.
[22]C.G. Rawls, M.A. Turnquist, Pre-positioning and dynamic delivery planning for short-term response following a natural disaster, Socio-Economic Planning Sciences 46 (2012) 46–54.
[23]J.-H. Zhang, J. Li, Z.-P. Liu, Multiple-resource and multiple-depot emergency response problem considering secondary disasters, Expert Systems with Applications 39 (2012) 11066–11071.
[24] W. Yi, L. Ozdamar, A dynamic logistics coordination model for evacuation and support in disaster response activities, European Journal of Operational Research 179 (2007) 1177–1193,http://dx.doi.org/10.1016/j.ejor.2005.03.077. [25] W. Yi, A. Kumar, Ant colony optimization for disaster relief operations, Transportation Research Part E: Logistics and Transportation Review 43 (2007) 660–672,http://dx.doi.org/10.1016/j.tre.2006.05.004.
[26] L. Ozdamar, Planning helicopter logistics in disaster relief, OR Spectrum 33 (2011) 655–672,http://dx.doi.org/10.1007/s00291-011-0259-y.
[27] G. Barbarosoglu, L. Ozdamar, A. Cevik, An interactive approach for hierarchical analysis of helicopter logistics in disaster relief operations, European Journal of Operational Research 140 (2002) 118–133, http://dx.doi.org/10.1016/S0377-2217(01)00222-3.
[28] Y.-C. Chiu, H. Zheng, Real-time mobilization decisions for multi-priority emergency response resources and evacuation groups: Model formulation and solution, Transportation Research Part E: Logistics and Transportation Review 43 (6) (2007) 710–736,http://dx.doi.org/10.1016/j.tre.2006.11.006. [29] Q. Gong, R. Batta, Allocation and reallocation of ambulances to casualty
clusters in a disaster relief operation, IIE Transactions 39 (1) (2007) 27–39,
http://dx.doi.org/10.1080/07408170600743938.
[30] A. Jotshi, Q. Gong, R. Batta, Dispatching and routing of emergency vehicles in disaster mitigation using data fusion, Socio-Economic Planning Sciences 43 (2009) 1–24,http://dx.doi.org/10.1016/j.seps.2008.02.005.
[31]S. Creemers, J. Belidn, M. Lambrecht, The optimal allocation of server time slots over different classes of patients, European Journal of Operational Research 219 (2012) 508–521.
[33] C. Cotta, Effective patient prioritization in mass casualty incidents using hyperheuristics and the pilot method, OR Spectrum 33 (2011) 699–720,http:// dx.doi.org/10.1007/s00291-011-0238-3.
[34]P. Brandimarte, Routing and scheduling in a flexible job shop by tabu search, Annals of Operations Research 41 (1993) 157–183.
[35]A.L.S. Group, Major Incident Medical Management and Support: The Practical Approach at the Scene, third ed., Wiley-Blackwell, 2011.
[36] S. Budge, A. Ingolfsson, D. Zerom, Empirical analysis of ambulance travel times: the case of Calgary emergency medical services, Management Science 56 (2010) 716–723,http://dx.doi.org/10.1287/mnsc.1090.1142.
[37]M. Saidi-Mehrabad, P. Fattahi, Flexible job shop scheduling with tabu search algorithms, The International Journal of Advanced Manufacturing Technology 32 (2007) 563–570.
[38]N.B.-B. Saoud, T.B. Mena, J. Dugdale, B. Pavard, M.B. Ahmed, Assessing large-scale emergency rescue plans: an agent-based approach, The International Journal of Intelligent Control and Systems 11 (2006) 260–271.
[39] D.T. Wilson, G.I. Hawe, G. Coates, R.S. Crouch, Effective allocation of casualties to hospitals in mass casualty incidents, in: Proceedings of the 3rd IEEE International Conference on Emergency Management and Management Sciences (ICEMMS), 2012.
[40]P.C. Fishburn, Axioms for lexicographic preferences, The Review of Economic Studies 42 (1975) 415–419.
[41]K. Miettinen, Nonlinear Mulitiobjective Optimization, Kluwer Academic Publishers, 1999.
[42]I. Das, J.E. Dennis, A closer look at drawbacks of minimizing weighted sums of objectives for pareto set generation in multicriteria optimization problems, Structural Optimization 14 (1997) 63–69.
[43]P. Hansen, N. Mladenovi?, Variable neighborhood search: principles and applications, European Journal of Operational Research 130 (2001) 449–467. [44]K. Fleszar, I.H. Osman, K.S. Hindi, A variable neighbourhood search algorithm
for the open vehicle routing problem, European Journal of Operational Research 195 (2009) 803–809.
[45]E. Burke, A. Eckersley, B. McCollum, S. Petrovic, R. Qua, Hybrid variable neighbourhood approaches to university exam timetabling, European Journal of Operational Research 206 (2010) 46–53.
[46]M. Amiri, M. Zandieh, M. Yazdani, A. Bagheri, A variable neighbourhood search algorithm for the flexible job-shop scheduling problem, International Journal of Production Research 48 (2010) 5671–5689.
[47]D.F. Jones, M. Tamiz, Goal programming in the period 1990–2000, in: M. Ehrgott, X. Gandibleux (Eds.), Multiple Criteria Optimization: State of the Art Annotated Bibliographic Surveys, International Series in Operations Research and Management Science, vol. 52, Springer, US, 2003, pp. 129–170. [48]O. Akz, D. Petrovic, A fuzzy goal programming method with imprecise goal
hierarchy, European Journal of Operational Research 181 (2007) 1427–1433. [49]G. Preece, D. Shaw, H. Hayashi, Using the viable system model (VSM) to
structure information processing complexity in disaster response, European Journal of Operational Research 224 (2013) 209–218.
[50] D.T. Wilson, G.I. Hawe, G. Coates, R.S. Crouch, Estimating the value of casualty health information to optimization-based decision support in response to major incidents, in: Proceedings of the 9th International ISCRAM Conference, 2012.


![Fig. 10. A comparison of solutions generated by two methodologies for a problem instance of type [R2,D3,S3]](https://thumb-us.123doks.com/thumbv2/123dok_us/1560308.108650/12.595.328.547.435.574/fig-comparison-solutions-generated-methodologies-problem-instance-type.webp)