Rochester Institute of Technology
RIT Scholar Works
Theses
Thesis/Dissertation Collections
2012
SLA-based risk analysis in cloud computing
environments
Mohammed Almathami
Follow this and additional works at:
http://scholarworks.rit.edu/theses
This Thesis is brought to you for free and open access by the Thesis/Dissertation Collections at RIT Scholar Works. It has been accepted for inclusion in Theses by an authorized administrator of RIT Scholar Works. For more information, please [email protected].
Recommended Citation
SERVICE LEVEL AGREEMENT
(SLA)-‐
BASED
R
ISK
A
NALYSIS IN
C
LOUD
C
OMPUTING
E
NVIRONMENTS
By
Mohammed Almathami
Committee Members
Dr. Kaiqi Xiong (Chair)
Dr. Sumita Mishra
Dr. Yin Pan
A Thesis Submitted in Partial Fulfillment of the Requirements for the Degree of
Master of Science in Computing Security and Information Assurance
Rochester Institute of Technology
Department of Computing Security
B. Thomas Golisano College of Computing and Information Sciences
Rochester Institute of Technology
B. Thomas Golisano College Of Computing and Information Sciences
Master of Science in
Computing Security and Information Assurance
Thesis Approval Form
Student Name
: Mohammed Almathami
Thesis Title
: SLA-based Risk Analysis in Cloud Computing Environments
Thesis Committee
Name
Signature
Date
______________________________________________________________________________
Dr. Kaiqi Xiong
Primary Advisor – R.I.T. Department of Computing Security
______________________________________________________________________________
Dr. Yin Pan
Secondary Advisor – R.I.T. Department of Computing Security
______________________________________________________________________________
Dr. Sumita Mishra
Thesis Release Permission Form
Rochester Institute of Technology
B. Thomas Golisano College of Computing and Information Sciences
Title: SLA-based Risk Analysis in Cloud Computing Environments
I, Mohammed Almathami, hereby grant permission to the Wallace Memorial Library to
reproduce this thesis in whole or part.
___________________________________
Mohammed Almathami
___________________________________
Abstract
The cloud computing has been evolved in recent years which led many customers to
utilize the cloud computing technologies. The research work in this area has spread due to many
issues that have coincided with the vast growth of the cloud computing technologies.
On the otherhand, the cloud security concern has become one of the important issues that cloud computing introduces.
One of the main components of cloud services is the service level agreement (SLA) that works as a
contractual document between the cloud providers and their customers and states some metrics and
parameters that must be enforced by the cloud providers or consumers. Despite various issues of the SLA
in cloud computing, there is one issue that has not been discussed frequently in cloud computing security,
which is the SLA in term of risk management. This research tends to perform SLA-based risk analysis in
cloud computing environments. Moreover, it evaluates different SLA parameters such the risk factor, the
response time factor, and the service cost factor. This paper also designates the importance of considering
risk management as an SLA parameter in the negotiation stage between the provider and the consumer.
However, it looks for the relation between those SLA metrics and risk factor associated with the cloud
Table of Contents
ABSTRACT ... IV
DEDICATION ... VII
ACKNOWLEDGEMENT ... VIII
1. INTRODUCTION ... 1
2. LITERATURE REVIEW ... 3
3. METHODOLOGY ... 7
4. DATA COLLECTION AND ANALYSIS ... 10
4.1. RESPONSE TIME FACTOR ANALYSIS ... 10
4.1.1. Response time test within the same VPC subnet ... 10
4.1.2. Response time test from different Amazon availability zone ... 11
4.1.3. Response time test from RIT network ... 13
4.1.4. End-‐to-‐end response time delay between the VMs: ... 15
4.2. COST FACTOR ANALYSIS ... 18
4.3. RISK FACTOR ANALYSIS ... 19
4.3.1. Information Security Risk Management Program (PLAN) ... 20
4.3.1.1. Select the critical areas ... 20
4.3.1.2. Strategy and planning ... 21
4.3.2. Implementation (Do) ... 22
4.3.2.1. Risk analysis ... 22
4.3.2.1.1. Assets Identification and Evaluation ... 22
4.3.2.1.1.1. Data ... 22
4.3.2.1.1.2. Application, functions, and processes (virtual resources) ... 24
4.3.2.1.2. Threat Identification ... 25
4.3.2.1.3. Vulnerability Identification ... 29
4.3.2.2. Risk assessment ... 33
4.3.2.2.1. Likelihood Determination (L) ... 33
4.3.2.2.2. Impact analysis (I) ... 34
4.3.2.2.3. Risk Determination (R) ... 36
5. EXPERIMENTAL RESULTS ... 60
6. RECOMMENDATIONS ... 71
7. FUTURE WORK ... 72
8. CONCLUSION ... 73
APPENDIX ... 78
LIST OF TABLES ... 78
LIST OF FIGURES ... 79
Dedication
I would like to dedicate this work to my beloved parents, Abdulaziz and Shahera
Almathami. I would not reach this level of education without your caring support and
influential help. For your sacrifices for me the whole time, I dedicate this work for you. I
would like to dedicate this work to my brothers and sisters who keep encouraging me and
always be
happy about my achievements more than me. To my best friend Abraham, thank
you for your influential help and your significant support.
Acknowledgement
I would like to give special thanks to my committee chair, Dr. Kaiqi Xiong, for his
assistance and supervision through the thesis process. Thank you for your helpful
suggestions and significant directions all the time. Also, I would like to thank my committee
members Dr. Sumita Mishra and Dr. Yin Pan for your helpful suggestions and comments
through the thesis process.
1.
Introduction
Cloud computing has been one of the major emerging technologies in recent years. Cloud computing
is based on delivering different services and resources through what is called the cloud or the Internet.
These services differ from providing infrastructure resources to software services. Cloud computing
depends on complex architectures that allow providers to deploy different models and deliver different
services. One of the vast features that cause the spread of these technologies is the flexibility since these
services and resources can be offered on-demand and the customer only pays according to usage. Also,
they offer good scalable and elastic features to scale the existing resources to obtain extra resources and
services on demand. Cloud computing consumers will not need to think about maintenance fees or
software licenses since those operations will be taken care of by the cloud providers. Moreover,
significant benefits of cloud computing such as cost effectiveness, portability, usability, and availability
draw the attention of many consumers to use cloud services. Cloud computing services can be delivered
in different models such as software-as-a-service (SaaS), which allows cloud customers to process and
use licensed software on the cloud providers’ resources only. For instance, the cloud consumers rent
software such as human resources management system (HRMS) and run it in the cloud on the providers’
resources. The cloud services can also be provided as platform-as-a-service (PaaS) which lets the
consumers to rent only a platform that gives more control to the consumer to configure it as needed. The
last model is infrastructure-as-a-service (IaaS), which provides the consumers with a complete
infrastructure where they deploy different machines and storage resources. The cloud services can be
deployed in different ways such as public cloud that allows all the consumers to share the same resources,
private cloud that provides the consumers with detected resources, community cloud that allows two or
more trusted consumers to share same resources, and hybrid clouds which allow consumer to combine the
public and private clouds.
become one of the important issues that cloud computing introduces. Many IT leaders are afraid of
moving to the cloud because of the security issues that arise from cloud computing technologies. One of
the main components of using cloud services is the service level agreement (SLA) that works as a
contractual document between the cloud providers and their customers. Cloud SLA states some metrics
and parameters that must be enforced by the cloud providers or consumers. If any contractual party fails
to meet any SLA requirements, that party commits a violation and is obligated to pay some penalties
according to the SLA. Nonetheless, there are different areas in cloud computing that introduce new risks
to both the cloud providers and customers. One of the issues that have not been discussed frequently in
cloud computing security is the SLA in term of risk management. This research tends to perform
SLA-based risk analysis in cloud computing environments. One of the strengths of this topic is that research
evaluates different SLA parameters such the risk factor, the response time factor, and the service cost
factor. The significance of the work conducted is to study the relationship between the risk management
parameter and other SLA parameters such as response time and the cost. Also, since many SLAs lack
security and risk management requirements, this research designates the importance of considering risk
management as an SLA parameter in the negotiation stage between the provider and the consumer. The
expectation consequences of this research are comparison results of the risk analysis against different
SLA metrics such as stated response time and service cost. The research finds linkage between those
metrics and risk factors associated with the cloud services. This topic is very interesting because it
indicates some risk management issues with the current cloud SLAs. Furthermore, many IT leaders want
to move to cloud but they face trust problem with the current ways of establishing cloud services’ SLAs.
Thus, this research gives those leaders some insights into the importance of risk management and how
they should consider it while deciding the future cloud providers for them.
The remainder of this paper is constructed as follows. The next section provides background literature
that relates to the research topic. Next, section 3 summarizes the research methodology used in this
discusses the results of section 4 in depth. Some recommendations are provided in section 6 and the
future work is provided in section 7. Then, the final part contains the conclusions of this research.
2. Literature Review
Several researches have been done in the area of SLA and risk management in cloud computing
environments. Some of these researches tend to provide new SLA risk management models or
frameworks to overcome security issues associated with the SLA in the cloud. This research focuses on
an SLA-based risk analysis in cloud computing environments by examining three different SLA factors,
which are the risk factor associated with the service, the service cost factor, and the response time factor.
The related work in this area lacks research that concerns the SLA-based risk analysis and this may
happen because the cloud computing security area has been one of the emerging research areas recently.
The following parts discuss different research that has been done in the areas of SLA and risk
management in the cloud computing environments.
In term of SLA-based work in cloud computing, Alhamad et al [1] proposed various models in
this area such as an SLA-based trusted model for cloud computing. This model helps cloud consumers to
evaluate the cloud resources and decides, which resources are more reliable to use. Moreover, Alhamad et
al [2] also provided SLA framework for cloud computing. This framework provides good criteria that
helps to build a good SLA in cloud computing and it discusses negotiation strategies between the cloud
providers and other parties such as a cloud consumer, cloud broker, or SLA’s monitoring agent. Hammadi
and Hussain [3] proposed a monitoring framework for SLA. This framework helps third party providers
to monitor SLA in real time to ensure that all parties meet SLA specifications of all time. This framework
contains two modules: reputation assessment module and transactional risk assessment module and those
two modules provide real-time QoS assessment to allow consumers to make a good decision by continue
using the current service or moving to another service provider. Chi et al. [4] offered a data structure
query, which points out different queries profits for modifying response times for each query. Jahyun Goo
[5] proposed a framework for structuring SLA in IT outsourcing arrangements. This framework provides
detailed descriptions of SLA measurement development and accurate statistical validations. This
framework covers 11 SLA contractual factors and their relationships with three more sub-factors. This
paper produced a benchmarking tool for SLA structuring efforts. Hedwig et al [6] proposed an SLA
design for enterprise information systems. This design consists of different state-of-the-art concepts from
system management and balances the risk with the process cost. This design helps IT leaders to
understand the correlation between the process cost and the service quality. Bhoj et al [7] introduced
architecture for SLA management in federated environments. This architecture uses SLAs to share
selective information within different administrative boundaries. This helps federated clouds’ consumers
to share, measure, monitor, and ensuring the SLA specifications of the shared services. All those models
and frameworks include and describe different SLA factors and metrics. The research chooses two of the
most important factors: the response time and service cost. Those two factors have high impacts on
making the decision about choosing the cloud service providers.
In term of risk management in the cloud computing environments, similarly, many papers
proposed different frameworks in this area. Zhang et al [8] presented an information security risk
management framework in cloud environments. This framework presents good insights in understanding
the critical areas in cloud environments. It helps to identify threats and vulnerabilities and their impacts in
the cloud environments. Furthermore, this framework discusses the possible actions needed to mitigate
the risks. Yuqin and Helgesson [9] offered a modified risk management model by integrating the SLA to
a pre-existing risk management model. This model clarifies the required responsibilities by various parties
involved in the risk management process. Additionally, this paper presents a method to identify the
relationship between risks and services and between services and actions. Morin et al [10] presented
several issues and challenges of SLA and risk management in cloud computing. In this research, a risk
management framework such as this framework [8] is used to identify and quantify risks in cloud
In term of SLA-based risk assessment and analysis in cloud computing environments, the European
Network and information Security Agency [11] presented a thorough report about risk assessment in
cloud environments indicating that the SLAs force better risk management in cloud computing
environments. Likewise, the Cloud Security Alliance (CSA) [12] indicates in its cloud security guide that
cloud consumers should engage security departments in the establishment of the SLA so they can enforce
some security requirements in the SLA. Research has been done in risk analysis in the area of cloud
computing and SLA, in general. Yeo and Buyya [13] analyzed the resource management policing while
accomplishing obligated objectives such as, meeting SLA, reliability and profit. This research uses two
different methods for risk analysis: separate and integrated to identify the effectiveness of resource
management policies in accomplishing the required objectives. Similarly, Waldman and Mello [14]
discussed a framework for risk analysis of non-compliance with SLA requirements. This analytical
framework discusses two different SLA issues: downtime and the number of failure occurrences.
Moreover, Battré et al [15] presented a risk management process that can be used by grid providers to
support SLA provisioning. The risk management process in this paper uses FERMA standard [16]. Also,
risk analysis has been done to examine the relationship between the network availability and availability
SLA specification [17] and this paper provides methods to control the risk and define availability SLA.
Yang et al [18] presented a patch management framework based on SLA-driven patch applicability
analysis, which allows automated analysis and risk assessment for business impact during the patch
process. Patel et al [19] provided a mechanism to manage SLAs in cloud computing environments using
Web Service Level Agreement (WSLA) framework to monitor and enforce the SLAs and they provided a
real world scenario to evaluate their proposal. Moreover, Hovestadt et al [20] offered a workflow for
selecting the best cloud resources according to the assessed risks and they provided some measurements
to calculate different factors to support this workflow. Previous research did not relate or analyze
information security risk against SLA metrics and specifications as this research intends to do. In term of
implement the risk management process. Furthermore, most of the risk analysis researches did not
implement the research scenarios and they did not even simulate them such as Hovestadt et al [20], which
presented risk analysis based on assumptions. Also, Yeo and Buyya [13] focus on the grid environments
and they have simulated their environment using GridSim [21] and for cloud environments, it would be
better to use CloudSim [22] to simulate cloud environments. Nonetheless, this research cannot use
CloudSim to simulate the test environment due to some limitations in this toolkit regarding response time
calculations and risk estimations. Correspondingly, Waldman and Mello [14] used the state of art model
and assumptions to evaluate the risk of non-compliance with SLA requirements. However, this research
does not match or relate the risk factor with other SLA factor such as the cost or response time. Yeo and
Buyya [13] claim that the work was able to determine the performance difference in resource
management policies against a single SLA object or combination of the objects. Moreover, this paper
presents decent workflow to select resource according to assessed risks and it provided good methods to
do the measurements and this could be used to calculate the risks and decide the best cloud resource.
Waldman and Mello [14] state that risk of lack of availability is an essential parameter for the elaboration
of SLAs.
In brief, most of those researches discuss the subject of SLA and risk management in general. For
example, some papers perform risk analysis for SLA as a general concept such as [20] but in grid
communication not cloud computing. Also, some papers discuss different SLA factor such as availability
in this paper [17]. Thus, to the best of our knowledge, there is no research has been published that
performs SLA-based risk analysis for the three SLA factors in cloud computing environments, which
states the significance of this work. Also, this research is considered a significant work because it
implements and analyzes SLA-based factors in a real test environment. Since this environment provides
us with real-time measurements, the research provides factual outcomes. Moreover, this research studies
the relationship between the SLA parameters: response time, cost and the risk factors. This research also
declares the importance of including risk factor as an additional SLA parameter in the negotiations
3. Methodology
This research studies three different factors: service response time factor, service cost factor, and risk
factor. To acquire the calculation of the three factors, a performance study is done to evaluate the
response time of different cloud resources. Then, the response time’s result is compared to other results
received from evaluating the service cost and associated risk with each cloud resource. Then, the risk
analysis results help us to produce different charts that depict the relation and correlation between the
three factors.
Before explaining how to calculate each factor, the research scenarios that are implemented to
achieve the research objectives are stated first. In this scenario, an external private cloud environment is
implemented in Amazon AWS. The cloud environment contains different virtual machines that build a
complete and isolated private cloud in Amazon Virtual Private Cloud (VPC) and the environment
topology is depicted the cloud setup later in this section. The scenario starts with one virtual machine
(VM) in this cloud. Next, different tests are performed to gather the results of the average response time,
service cost, and the associated risk. Then, the VMs are increased by one and same calculations are
performed against all existing cloud resources. The scenario has up to 10 VMs in total.
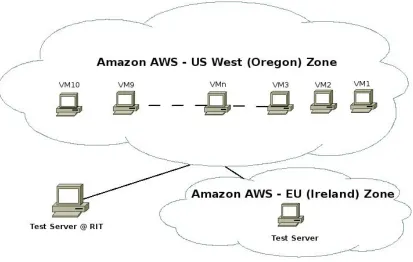
Figure 1 clearly depicts the network design and configuration of the experiment. To establish the
cloud environment, the virtual private cloud is created using Amazon VPC in the US West (Oregon)
availability zone [23]. This zone has all the VMs that the tests are run against. First, the first VM is
created and the calculation is done for all factors against one VM. Then, one VM is added and the
calculation is performed for each VM. In addition to test server runs from RIT, another VM is acquired in
Figure 1: Virtual private cloud topology
In the following sections, the three SLA factors are listed and how those factors are calculated:
Response Time:
The response time is the time period between initiating request and receiving the response. The
response time testing in cloud environment helps to provide better cloud resources provision process
where customers make sure that they receive decent services as declared in the service level agreement
(SLA). This test also assists to examine the availability of the cloud resources since cloud services should
be available 24/7 when needed. In this case, this helps to find the relationship between the response time
factor and risk factor in cloud environments. In cloud environments, when more cloud resources and
Amazon instances are being added, do the added resources or Amazon instances affect the risk factor?
This task aims to find clear answers using various test cases to verify whether the risk factor is essential
or not. Since the environment is built in Virtual Private Cloud (VPC) in Amazon AWS in the US West
Oregon availability zone, different tests are performed within the VPC and outside the cloud. Those tests
hand, the testing server initiates multiple TCP packets and sends them recursively to each VM. Then, the
code calculates the round trip time between the testing server and each VM. While adding more VMs, the
server keeps sending the packets to the new VM and calculates the average response time the VMs. For
each VM, the test server sends 100 packets and finds the average of the response time that it receives
from each VM. In this part, the response time is evaluated from three different physical locations: same
subnet, another Amazon availability zone, and from RIT campus.
On the other hand, end-to-end delay response time test is performed between all VMs. In this
case, this study assumes that a customer initiates a service request and that request passes all the cloud
resources. The response time needed to pass all the VMs is calculated. The first case is to assume that the
last cloud recourse executes the request while the second case requires the last cloud recourse to respond
to the customer with some feedback.
Service Cost:
In this metric, this research examines how the cost factor can be exaggerated in cloud
environments while utilizing more cloud resources. One of the main benefits of cloud environments is to
use less physical resources and utilize more virtual resources. In general, the cloud environments reduce
the IT expenses due to cutting the cost of physical resources, manpower, maintenance and operations.
Risk Factor:
In this part, the research uses the information security risk management framework [8] to calculate
different risks associated with each VM. This framework helps us to do risk assessment for this study
scenario by following some standards. This part aims to identify the level of risks associated with each
VM in cloud environment. After the risk analysis results are acquired, the charts are created to illustrate
the risk behavior in this study scenario. More detailed steps of the risk assessment and all formulas are
4. Data collection and analysis
4.1. Response time factor analysis
Amazon does not clearly state its average response time for Amazon EC2 instances to respond to a
network request. It only claims that any instances opened through console will respond in a high manner
[24]. To acquire the response time for each VM, this research performs three different test cases as the
following:
4.1.1. Response time test within the same VPC subnet
In this case, this study runs a response time test within the same subnet of the cloud
infrastructure. It launches a VM for testing in the same Amazon availability zone (US West Oregon).
Then, the test server performs a response time test and sends the TCP testing packets. In average, the test
server has sent about 100 packets per VM. Table 1 illustrates the average response time results while
increasing the VMs one after another:
VM# IP Average Response time
(Millisecond second)
1 10.10.10.50 0.446832
2 10.10.10.51 0.363171
3 10.10.10.52 0.282536
4 10.10.10.53 0.438948
5 10.10.10.54 0.429387
6 10.10.10.55 0.425957
7 10.10.10.56 0.371176
8 10.10.10.57 0.407007
9 10.10.10.58 0.429922
10 10.10.10.59 0.440493
Figure 2 shows the fluctuation of the response time factor. First, it has a minor drop at the beginning
of the test. Then, the response time goes up until it remains steady for a while. Then, the response time of
a VM within the subnet becomes constant, yet there is no clear reason for the first drop except the
[image:20.612.88.526.171.407.2]network connection delay.
Figure 2: Average response time within the subnet
4.1.2. Response time test from different Amazon availability zone
In this test, the test server performs a test within the Amazon datacenters. Another VM is set up in a
different availability zone, which is the Amazon Europe datacenter in Ireland. This test helps to find the
response time between two availability zones at Amazon AWS: the US West Oregon and EU Ireland.
Like the previous test, the test server sends multiple TCP packets and finds the average response time of
each VM. To access the VMs, a public IP is associated to each VM so it can be publicly accessed. Due to
the limitation of the VPC services at Amazon AWS, Amazon limits the cloud to use only five public IPs
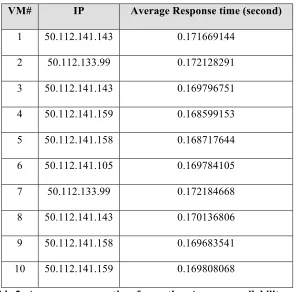
in each availability zone. Accordingly, the five IPs are kept switching between the 10 VMs. Table 2
illustrates the test results while increasing the VMs one after another: 0
0.00005 0.0001 0.00015 0.0002 0.00025 0.0003 0.00035 0.0004 0.00045 0.0005
1 2 3 4 5 6 7 8 9 10
R
esp
on
se
ti
m
e
(s)
Number of the VMs
VM# IP Average Response time (second)
1 50.112.141.143 0.171669144
2 50.112.133.99 0.172128291
3 50.112.141.143 0.169796751
4 50.112.141.159 0.168599153
5 50.112.141.158 0.168717644
6 50.112.141.105 0.169784105
7 50.112.133.99 0.172184668
8 50.112.141.143 0.170136806
9 50.112.141.158 0.169683541
[image:21.612.159.458.69.361.2]10 50.112.141.159 0.169808068
Table 2: Average response time from other Amazon availability zone
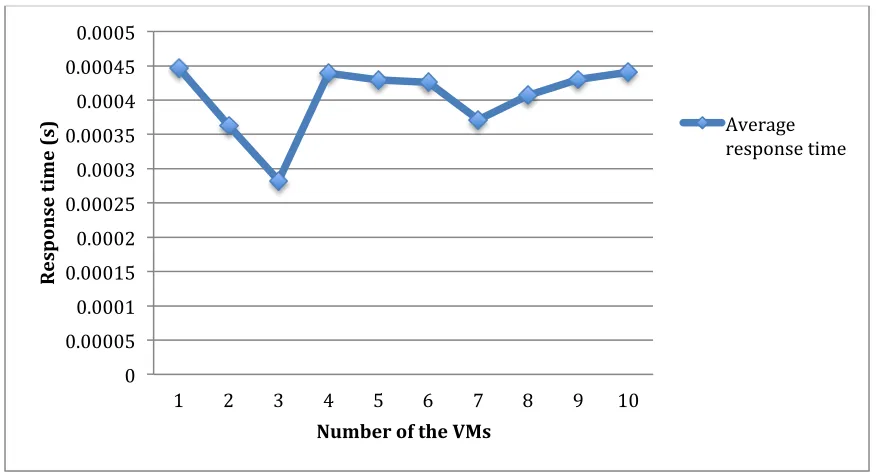
Figure 3 depicts the response time factor behavior when this study tests the private cloud from
another available zone at Amazon. It is clear from the chart that the response time factor has a dramatic
decrease at the beginning. Later, the response time has fluctuated for the remaining part of the test and
fluctuation is around average response time of 0.17 second. The possible reason for this behavior can be
Figure 3: Average response time from other Amazon availability zone
4.1.3. Response time test from RIT network
In this test case, the test server performs a test from RIT network in Rochester, New York. This
test helps to examine the response time between the customer network and the cloud resources over the
Internet. It shows how the connection performance is an important factor when a customer may decide to
move to cloud environments. Similar to the previous case, there are only five public IPs that can be
associated with the VMs. Thus, the five IPs are exchanged between the VMs to perform the test. Table 3
illustrates the test results while increasing the VMs one after another:
VM# IP Average Response time (second)
1 50.112.141.143 0.09251992799
2 50.112.141.105 0.09008345127
3 50.112.133.99 0.08998443381
4 50.112.141.159 0.09228640373
5 50.112.141.158 0.09050016762
6 50.112.141.105 0.08957309722
7 50.112.133.99 0.08996924911
8 50.112.141.143 0.09210723337 0.166
0.167 0.168 0.169 0.17 0.171 0.172 0.173
1 2 3 4 5 6 7 8 9 10
R
esp
on
se
ti
m
e
(s)
Number of the VMs
9 50.112.141.158 0.09455870107
[image:23.612.72.506.248.486.2]10 50.112.141.159 0.09595080172
Table 3: Average response time from RIT
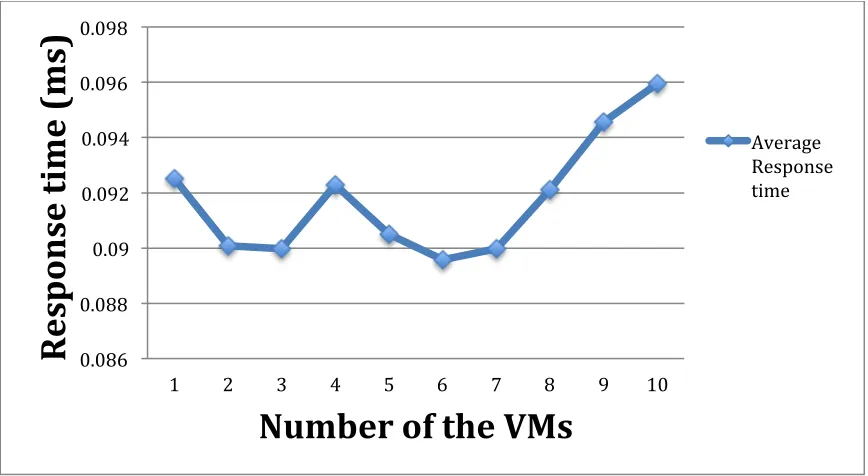
To illustrate the response time behavior while connected from RIT, Figure 4 indicates a
fluctuation in response time between 0.089 to 0.092 second. Then, the response time went up significantly
while adding more VMs. This behavior demonstrated that adding more VMs could affect the response
time factor based on the physical location of the new VMs.
Figure 4: Average response time from RIT
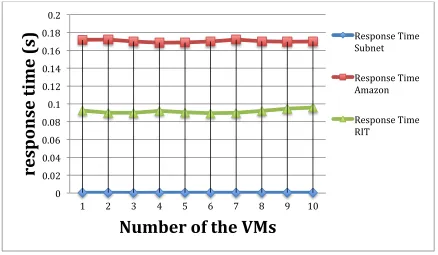
To compare between the test cases, Figure 5 shows the enormous difference between the subnet
case and other cases. Connecting within the subnet cannot compare to the connection outside the private
network. Thus, interactions between the cloud resources at the same subnet are considered very fast and
provide better cloud resources availability. On the other hand, the response time for the Amazon
availability zone and RIT test cases are slightly close and have the same fluctuation around 0.17 seconds
for the Amazon and 0.91 seconds for the RIT case. Moreover, the comparison illustrates that the
connection from a regular US network, such as RIT, is faster than the connection from Amazon
datacenter overseas (Ireland) to the VMs in US. Even though Amazon provides high-speed connection 0.086
0.088 0.09 0.092 0.094 0.096 0.098
1 2 3 4 5 6 7 8 9 10
R
esp
on
se
ti
m
e
(m
s)
Number of the VMs
between all its datacenters, the physical location of the datacenters play an important role since the other
datacenters help in term of data recovery, business continuity, and backup process. Beside the response
time factor effect, using multiple datacenters help to reduce the risk of data loss and cloud resources
availability. Figure 5 depicts the average response times of each case are almost constant with minor
fluctuations at some points. Thus, this chart declares that placing the VMs at the same physical machine
and same availability zone would provide a constant response time for each VM.
[image:24.612.70.508.248.503.2]
Figure 5: Comparison between the test cases
4.1.4.
End-to-end response time delay between the VMs:
In this test case, this study assumes that a customer issues a service request that goes through each
VM consecutively. The customer requests a service as illustrated in
Figure 6
, then, the request goes toVM #1. Next, the request is sent to VM #2 by VM#1 and so on until the request reaches the VM #10.
After the last VM executes the request, VM #10 either responds to the customer or exits the process. 0
0.02 0.04 0.06 0.08 0.1 0.12 0.14 0.16 0.18 0.2
1 2 3 4 5 6 7 8 9 10
re
sp
on
se
ti
m
e
(s)
Number of the VMs
Response Time Subnet
Response Time Amazon
Figure 6: End-to-end response time delay for a service request
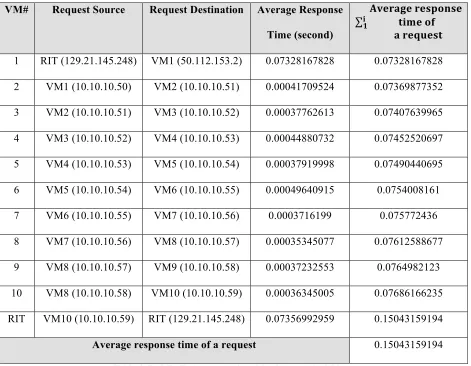
In this part, this study aims to calculate the response time that a request takes from the customer
network until it executes by the last cloud node i.e. VM #10 in this case. In this calculation, the study
assumes that the request has different process time at each VM. Thus, the response time between the
cloud nodes in this scenario is only calculated.
VM# Request Source Request Destination Average Response
Time (second)
!"#$%&# !"#$%&#"
!"#$ !"
! !"#$"%& !
!
1 RIT (129.21.145.248) VM1 (50.112.153.2) 0.07328167828 0.07328167828
2 VM1 (10.10.10.50) VM2 (10.10.10.51) 0.00041709524 0.07369877352
3 VM2 (10.10.10.51) VM3 (10.10.10.52) 0.00037762613 0.07407639965
4 VM3 (10.10.10.52) VM4 (10.10.10.53) 0.00044880732 0.07452520697
5 VM4 (10.10.10.53) VM5 (10.10.10.54) 0.00037919998 0.07490440695
6 VM5 (10.10.10.54) VM6 (10.10.10.55) 0.00049640915 0.0754008161
7 VM6 (10.10.10.55) VM7 (10.10.10.56) 0.0003716199 0.075772436
8 VM7 (10.10.10.56) VM8 (10.10.10.57) 0.00035345077 0.07612588677
9 VM8 (10.10.10.57) VM9 (10.10.10.58) 0.00037232553 0.0764982123
10 VM8 (10.10.10.58) VM10 (10.10.10.59) 0.00036345005 0.07686166235
RIT VM10 (10.10.10.59) RIT (129.21.145.248) 0.07356992959 0.15043159194
Average response time of a request 0.15043159194
Table 4: End-To-End response time delay between the VMs
To analyze the data in
Table 4
, the research assumes two different cases: the first case is toconsider the request needs to be sent by the customer to the cloud resources. The request passes each VM
until the VM # 10. Then, the VM #10 does not need to take any action and the research assumes the
request has been fulfilled.
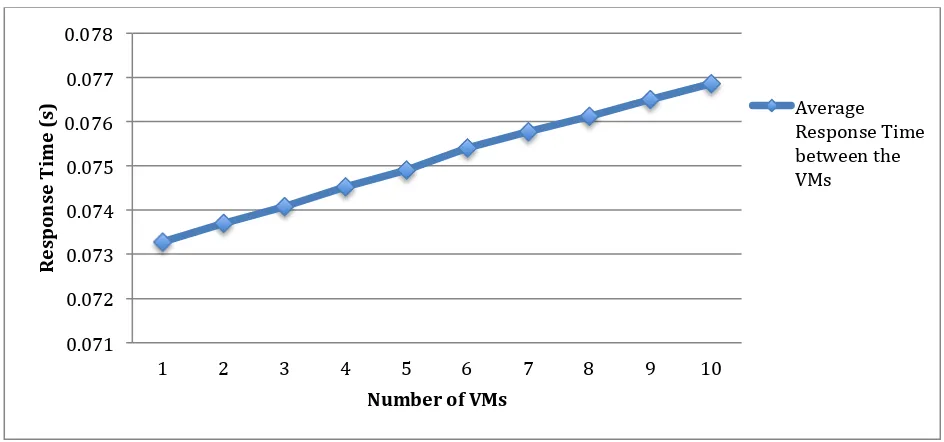
Figure 7
shows that response time of a request that finally fulfilled by VM [image:26.612.70.542.200.421.2]#10. The change in the response time is steady increasing while adding more VMs.
Figure 7: Average response time delay between the VMs
The second case is to assume that the last VM #10 responds to the customer. In this case, this
study calculates the response time between the last VM and the customer network.
Figure 8
clearlyillustrates the important effect in response time when the last VM responds to the customer request. A
sharp increase the response time after VM #10 indicates the enormous impact in the performance if the
service provider decides to respond to the customers. Thus, processing the request inside the cloud would
need minimal time besides adding final response time to the customer. Moreover, this behavior states the
importance of considering the response time between the external network and cloud network; this
includes the responses to the customers who are located in an external network. 0.071
0.072 0.073 0.074 0.075 0.076 0.077 0.078
1 2 3 4 5 6 7 8 9 10
R
esp
on
se
T
im
e
(s)
Number of VMs
Figure 8: Average response time delay between the VMs including RIT
4.2. Cost factor analysis
All the cloud resources costs in this analysis are acquired from the Amazon AWS pricing policy
[25]. There is no minimum fee required and the price depends only on the hourly usage. All the used
Amazon instances are on-demand instances, hence; the test is charged for the usage time only.
Additionally, all prices are based on the availability zone, which is the US West Oregon and all the VMs
are Small type. The following table shows how the cost factor keeps increasing while adding the VMs
successively:
VM# OS Price per Hour Subtotal price per Hour
1 Linux $0.080 $0.080
2 Linux $0.080 $0.160
3 Linux $0.080 $0.240
4 Win $0.115 $0.355
5 Linux $0.080 $0.435
6 Win $0.115 $0.550
7 Linux $0.080 $0.630
8 Win $0.115 $0.745
9 Win $0.115 $0.860
0 0.02 0.04 0.06 0.08 0.1 0.12 0.14 0.16
1 2 3 4 5 6 7 8 9 10 RIT
R
esp
on
se
T
im
e
(s)
Number of VMs
10 Win $0.115 $0.975
Table 5: Cost factor behavior
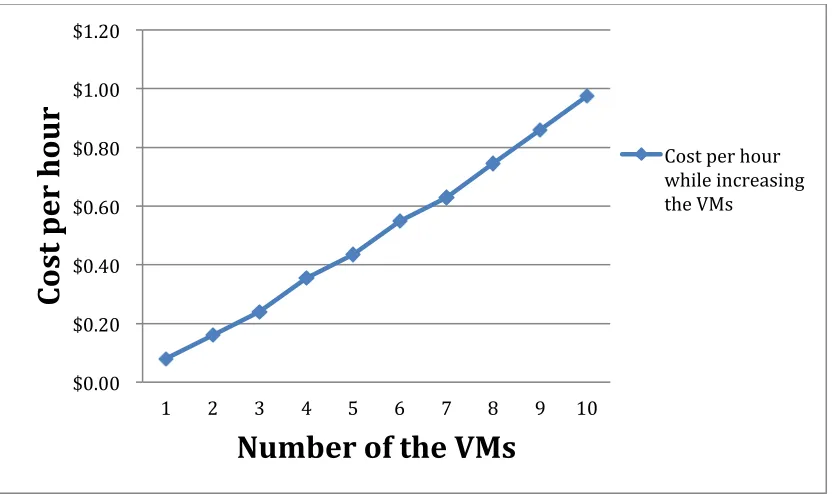
Figure 9 depicts the cost factor behavior. The cost factor rises gradually when while adding more
cloud resources. Nonetheless, the chart indicates how cloud environment can be incredibly cost effective.
For instance, the test cases contain 10 servers that run for an hour and the total cost for all test cases is
[image:28.612.73.491.246.493.2]almost one dollar.
Figure 9: Cost factor behavior
4.3. Risk factor analysis
After finishing the response time and cost analysis in previous part, here is the risk factor analysis
of the scenario. First of all, National Institute of Standards and Technology (NIST) defines the IT risk as
“the net mission impact considering (1) the probability that a particular threat-source will exercise
(accidentally trigger or intentionally exploit) particular information system vulnerability and (2) the
resulting impact if this should occur” [26]. This task is proposed in a standard quality cycle based on
ISO/IEC 27001 standards [27]. This cycle includes four main steps: Plan, Do, Check, and then Act. Next $0.00
$0.20 $0.40 $0.60 $0.80 $1.00 $1.20
1 2 3 4 5 6 7 8 9 10
Co
st
p
er
h
ou
r
Number of the VMs
4.3.1. Information Security Risk Management Program (PLAN)
4.3.1.1. Select the critical areas
In this part, this research uses list provided by the CSA on the critical areas of focus in cloud
computing environments [12]. The main critical areas in this study scenario would be:
-‐ Governance and Enterprise Risk Management:
This domain is considered one of the most discussed area in cloud computing. Since the cloud
computing tends to restore more administrative roles and permissions from the cloud customer, the cloud
providers have the responsibility to govern the cloud services and provide reliable and trustworthy
services to build the trust relationship between the cloud providers and their customers. Also, the cloud
providers are accountable to measure various risks introduced by cloud computing and how customer can
transfer this task to the cloud provider. For this study scenario, this area is very important since this study
tends to set up the private cloud in external and shared infrastructure i.e. Amazon cloud services. This
research examines how Amazon govern the cloud and perform risk management tasks and it gathers this
information from Amazon documents such as Amazon Web Services Risk and compliance document
[28].
-‐ Information Management and Data Security:
This area is also an important factor, since this study is using shared resources from a public cloud
provider such as Amazon. This research aims to ensure that a managing data process is being built in the
shared infrastructure to protect the data while using the cloud. Even if this study scenario is designed as a
private cloud, there is no physical control over the data since all the data is transferred to Amazon
datacenters. This research also aims to ensure that Amazon has designed good security controls to manage
the data. This process identifies who is accountable of the confidentiality, integrity, and availability of the
data and the VMs. This study measures the risks introduced to the study scenario by including this area.
-‐ Encryption and Key Management:
Since the private cloud is placed in Amazon, a remote access is required to access the VMs and
perform regular tasks. In the risk analysis, the research measures the risks associated with this factor. It
examines how the connection to the VM is well protected from any adversary. This is based on the
current encryption and key management controls provided by Amazon.
-‐ Virtualization:
Virtualization is considered one of the most risks associated with cloud computing. Since the first
time the cloud has been introduced, the virtualization remains the first security issue that introduces
various risks to cloud provider and customers. There are different factors that virtualization uses to
provide cloud services such as multi-tenancy, VM isolation and hypervisor vulnerabilities [12]. Also, this
study aims to examine how the virtualization risk concerns may affect the VMs in a shared environment.
4.3.1.2. Strategy and planning
The ultimate goal of this risk assessment is to define and determine the risks associated with
cloud computing and how the risk factor can be related to other service level agreement factors such as
the response time and the service cost. This helps to understand the risks associated with clouds and
provide information for decision makers to decide wither to move to cloud or not. This task aims to
analyze different critical areas in cloud so the cloud customer can ensure and understand the cloud risks
associated with other SLA factors such as the response time and cost. This also helps the cloud customers
to understand the surrounding issues with cloud so they can place security controls to resolve these risks
concerns. The main strategy of this task is to measure the risk associated with the VMs in the cloud. First
of all, this study calculates the risk associated with one VM. Then, it creates new VM and calculates the
associated risk with the two VMs until to the last VM is created. In this task, the total number of VMs that
the study creates is 10 VMs. The scope of this risk analysis is to determine the risks introduced while
4.3.2. Implementation (Do)
The implementation part contains the following processes: risk analysis, risk assessment, and risk
mitigation. Each process of this step is done separately as the following:
4.3.2.1. Risk analysis
For this part, this research uses the Operationally Critical Threat, Asset, and Vulnerability
Evaluation (OCTAVE) method as a general guide to perform the task. Since this method is being used in
large-scale organization processes [29], some parts of this method are ignored in this study. This part
tends to evaluate and identify the scenario assets, critical threats, and possible vulnerabilities. In addition
to the OCTAVE method, this research also uses the Cloud Security Alliance guide to complete this task
[12].
Risk analysis task contains the following processes:
4.3.2.1.1. Assets Identification and Evaluation
This research uses OCTAVE and Cloud Security Alliance (CSA) guide to identify the main assets
that are reliable to this study scenario. The first OCTAVE step is to build assets-based threat profiles by
identifying the important assets. Then, this research evaluates those assets to find the possible value of
each asset. In term of the study scenario, it identifies the assets that are important to this scenario and to
the cloud providers. In general, CSA declares that assets in cloud environments fall into two categories:
data or application, functions, and processes. In the study scenario, information and functions are moved
to cloud providers. Thus, this research uses the CSA guide to divide the assets to two different categories
as the following [12]:
4.3.2.1.1.1. Data
Data is considered is one of the main assets in cloud environments since in this case, all the data has been
moved to the cloud and there is no physical governance over the data anymore. This research recognizes
assess the confidentiality, integrity, and availability of the data. NIST defines confidentiality as “the
security goal that generates the requirement for protection from intentional or accidental attempts to
perform unauthorized data reads. Confidentiality covers data in storage, during processing, and in transit”,
integrity as “the security goal that generates the requirement for protection against either intentional or
accidental attempts to violate data integrity (the property that data has when it has not been altered in an
unauthorized manner) or system integrity (the quality that a system has when it performs its intended
function in an unimpaired manner, free from unauthorized manipulation)” and availability as “the security
goal that generates the requirement for protection against— • Intentional or accidental attempts to (1)
perform unauthorized deletion of data or (2) otherwise cause a denial of service or data • Unauthorized
use of system resources” [26]. Next, this research examines each one of these requirements using various
questions provided by the CSA guide [12]:
• Confidentiality:
How would we be harmed if the data became widely public and widely distributed?
For this study scenario, the data is set to be private and it’s only accessible by authorized user.
The VMs need credentials to access the data that resides in the cloud since there is no data is set to be
public. If any data breaches happen or the data has accessed by unintended users, the risk affecting the
data confidentiality increases dramatically. This would cause real harm to the data.
How would we be harmed if an employee of the cloud provider accessed the data?
As the data is set to be private, this research needs to ensure that no one can access the data
including the cloud provider unless the provider gets the permission. Thus, if the cloud provider accesses
the data without permission, this would cause harmful risk to the data privacy. Also, this research needs
to ensure the provider placed security controls to protect the data privacy.
• Integrity:
How would we be harmed if the information/data were unexpectedly changed?
affect the data integrity and introduce more risks to the cloud. Indeed, this would harm the trust
relationship between the cloud provider and the customer.
• Availability:
How would we be harmed if the data were unavailable for a period of time?
The data should be available as needed at any time. Any unavailability issue may cause negative
impact on the data and the scenario. This research should ensure how Amazons manages the data
availability and how the remote connection can affect the data availability.
4.3.2.1.1.2. Application, functions, and processes (virtual resources)
In this category, this research states that the vertical machines (VMs) in this scenario are the main assets
for this study. Thus, this research assesses the security requirements against this asset as the following:
• Confidentiality:
How would we be harmed if the VMs became widely public and widely distributed?
For this scenario, this research sets up the VMs in a virtual private cloud in Amazon AWS. The
VMs should be accessible by the authorized user only. If the VMs appear in the amazon public cloud, a
risk is introduced and it may affect the VMs confidentiality.
How would we be harmed if an employee of the cloud provider accessed the VMs?
The VMs should be accessible by the authorized user only. Any unauthorized access to the VMs
can cause harmful impact to the VMs confidentiality. This research needs to ensure that Amazon places
good access controls that protect the VMs access.
• Integrity:
How would we be harmed if an outsider manipulated a process or a function in the VMs?
Authorized user is the only one who can manipulate any process in the VMs. Any unauthorized
attempt to create, alter, or delete any process in the VMs would harm the VMs integrity. This research
should ensure that the only ones who can control the VMs’ processes, functions, and resources are the
• Availability:
How would we be harmed if the VMs were unavailable for a period of time?
All VMs should be up available to us as needed. Any down time to the VMs may introduce high
risks and affect the availability requirement. Thus, this research should ensure that Amazon could meet
the uptime requirements stated in its SLA. All cloud resources that provide access function to the VMs
should available all the time. These resources include internal networks, and virtual private cloud
resources such as IPs, security groups, and subnets.
From the asset identification and evaluation task, this study concludes that the main assets that are
very important in this study’s scenario are the data and the VMs. Thus, this study uses a cloud
deployment model that suits and meets this study’s security requirements. This chosen model is the
external private cloud in a shared infrastructure i.e. Amazon cloud services. Table 6 shows the assets
classification and their impacts when a violation happens:
Assets Data classification Impact classification
Amazon EC2 Instances
(VMs)
Private High
Data resides in each VM Private Medium
Table 6: Assets classification
4.3.2.1.2. Threat Identification
NIST defines a threat as “the potential for a threat-source to exercise (accidentally trigger or
intentionally exploit) a specific vulnerability” [26]. Additionally, NIST states that a threat source “either
(1) intent and method targeted at the intentional exploitation of a vulnerability or (2) a situation and
method that may accidentally trigger a vulnerability” [26]. In this part, the research uses different sources
that help us to provide combined list of different threats that are related to the study’s scenario. CSA
provide a list of the top threats to cloud computing [30]. Also, Whitman provides a general list of threats
Some cloud-specific threats provided by the Cloud Security Alliance [30]
Threat Malicious Insiders
Threat source • Inside adversaries.
• Cloud provider employees.
• Attackers
Motivation • Data disclosure or destruction
• Unauthorized data manipulation.
• Money gain.
Critical Area • Governance and Enterprise Risk Management
Threat Shared Technology Issues
Threat source • Attackers
• Cloud customers
• Lack of patching support from cloud provider.
Motivation • Impact on other cloud customers’ operation
• Unauthorized activity.
• Denial of service.
• Unauthorized access.
Critical Area • Virtualization
Threat Data Loss or Leakage
Threat source • Attackers.
• Untrained cloud customers.
• Weak encryption and key management by cloud provider.
Motivation • Data disclosure.
• Data manipulation or deletion.
• Money gain.
• Challenge
Critical Area • Encryption and Key Management
• Information Management and Data Security
Threat Account or Service Hijacking
Threat source • Attackers.
• Weak authentication controls.
• Weak monitoring techniques.
• Lack of understanding the cloud provider policies.
Motivation • Leverage the reputation of the cloud customer.
• Use the attacked services to launch new attacks.
• Compromise the availability of the service.
• Compromise the integrity of the account.
Critical Area •Governance and Enterprise Risk Management
Threat Unknown Risk Profile
Threat source • Cloud provider governance
• Using unsecure systems, codes, software, or hardware.
Motivation • Exploit unknown vulnerabilities.
• Launch unauthorized activity.
• Impersonate cloud customers to gain trust from cloud
provider.
Critical Area •Governance and Enterprise Risk Management
Some general threats to information security [31]
Threat Deliberate Software Attacks
Threat source • Viruses, worms, or malwares.
• Vulnerable software, code, or system.
• Weak patching management.
Motivation • Exploit known vulnerabilities.
• Denial of service
• Leverage the reputation of the cloud customers.
• Launch new attacks using gain services.
Critical Area • Governance and Enterprise Risk Management
• Virtualization
Threat Act of Human Error or Failure
Threat source • Cloud customers
• Insiders
Motivation • There is no motivation since the employee does unintentional
error.
Threat QoS Deviations from Service Providers
Threat source • Cloud/service provider
Motivation • There is no motivation since the employee should try to
provide high quality service.
Critical Area Governance and Enterprise Risk Management
Table 7: Cloud-Specific Threats
4.3.2.1.3. Vulnerability Identification
NIST defines the vulnerability as “A flaw or weakness in system security procedures, design,
implementation, or internal controls that could be exercised (accidentally triggered or intentionally
exploited) and result in a security breach or a violation of the system’s security policy” [26]. This part is
very essential in risk assessment to identify the known vulnerabilities to protect the data and VMs from
attacks caused by known vulnerabilities. Grobauer defines the vulnerability as “the probability that an
asset will be unable to resist the action of a threat agent” [32]. In this task, this research determines and
identifies cloud-specific vulnerabilities that could affect any cloud environment. Grobauer provides a list
of cloud-specific vulnerabilities that this study uses in the analysis [32]. Bamiah and Brohi also provide a
list of cloud-specific vulnerabilities that is used in the analysis too [33].
Cloud-specific vulnerabilities by Grobayer [32]
Vulnerability Vulnerable VM images provided by the cloud provider
Threat source Cloud/service providers
Threat action The cloud customer launches new VM using a pre-defined
vulnerable VM image.
Critical area Governance and Enterprise Risk Management
Vulnerability Collect detailed information about configuration, patch
Threat source Attackers
Threat action The attacker rents a VM and uses its administrative features
to collect important information such as cloud infrastructure,
patch management, and API code.
Critical area • Information Management and Data Security
• Governance and Enterprise Risk Management
Vulnerability Vulnerable VM images distributed in a virtual images store
Threat source Cloud customer
Threat action The cloud customer uses untrusted and vulnerable VM
image that is available in VM images store.
Critical area Governance and Enterprise Risk Management
Vulnerability Data leakage while cloning the VM
Threat source Cloud provider
Threat action When a provider clones a VM, data leakage happens during
the cloning since this process copies data and private key for
a host. Then, all the data in this VM go public when a VM
launches using the cloned image.
Critical area Information Management and Data Security
Vulnerability Weak random key generation and weak key management.
Threat source Cloud provider
Threat action Virtualization may introduce a problem between the
generation
Critical area • Encryption and Key Management
• Virtualization
Vulnerability Data recovery vulnerability
Threat source Cloud provider
Threat action This happens when a provider faces a problem in backing up
the VMs and this leads to VM loss.
Critical area Information Management and Data Security
Vulnerability Data destruction policies
Threat source Cloud provider
Threat action When a customer does not need the cloud service anymore,
the provider should remove all his data from the virtual
storage only. The provider can’t wipe the physical disk if it
is still used by other shared users.
Critical area •Governance and Enterprise Risk Management
•Information Management and Data Security
Cloud-specific vulnerabilities by Bamiah and Brohi [33]
Vulnerability Virtual Machine Escape
Threat source Attacker
Threat action There is more risk when the VM OS is same as cloud host
OS since they might share the same vulnerability. Also,
compromise the host.
Critical area Governance and Enterprise Risk Management
Vulnerability Insecure Cryptography
Threat source •Cloud provider
•Attacker
Threat action When cloud provider uses the virtualization to partition a
physical server to multiple VMs, this server may generate
weak random key due to the lack of sufficient entropy pool.
Thus, creating truly random key in cloud environment is
much harder than a detected PC desktop. This may allow the
attacker to decode cryptographic text easily.
Critical area • Encryption and Key Management
• Information Management and Data Security
• Virtualization
Vulnerability Internet Dependency
Threat source Cloud provider
Threat action Most of the cloud services depend totally on the Internet so
the user can reach and utilize those services. Any Internet
issue increases the risk of service availability since the
service is useless if it’s unavailable.
Critical area Governance and Enterprise Risk Management
4.3.2.2. Risk assessment
NIST states that risk assessment is “the process of identifying the risks to system security and
determining the probability of occurrence, the resulting impact, and additional safeguards that would
mitigate this impact” [26]. According to this framework [8], this part is divided into three different steps:
4.3.2.2.1. Likelihood Determination (L)
NIST states that the likelihood determination aims “to derive an overall likelihood rating that
indicates the probability that a potential vulnerability may be exercised within the construct of the
associated threat environment” [26]. This step tends to estimate the likelihood of a vulnerability to be
exploited or occurred. This part also uses the results from the vulnerability identification step in section
4.3.2.1.3. The vulnerability is evaluated and assigned a numeric value and likelihood level. The numeric
value ranges from 0.1 to 1.0. A value of 0.1 means the probability of a vulnerability being exploited is
very low while a value of 1.0 means the probability of a vulnerability being exploited is very high. The
vulnerability likelihood levels are high, medium, and low. Similarly, high level means the threat source
has high motivations or capabilities to exploit certain vulnerability while low level indicates the lack of
required skills and incentives to exploit given vulnerability. The following table identifies each
vulnerability and its likelihood level and rate.
Likelihood Estimation
Vulnerability Affected
Assets
Likelihood
Level
Likelihood
rate
Vulnerable VM images provided by
the cloud provider.
Amazon
VMs
Medium 0.5
Collecting detailed information about
configuration, patch management,
and code.
Amazon
VMs
a virtual images store VMs
Data leakage while cloning the VM Data Medium 0.5
Data destruction policies Data High 1.0
Data recovery vulnerability Data Low 0.1
Weak random key generation and
weak key management.
Amazon
VMs
Data
Medium 0.5
Virtual machine escape Amazon
VMs
Low 0.1
Insecure cryptography Data Low 0.1
Internet dependency Amazon
VMs
Low 0.2
Table 9: Likelihood identification
Next, this research needs to identify the likelihood of exploiting vulnerabilities on certain cloud
assets. This research uses the next formula to achieve this goal:
Likelihood of exploiting vulnerabilities on assets= total likelihood rate of an asset / the
number of caused vulnerabilities
Likelihood of exploiting vulnerabilities on (Amazon EC2 VMs) =
(0.5 + 1.0 + 0.5 + 0.5 + 0.1 + 0.1) / 6 = 2.7 / 6 = 0.45
Likelihood of exploiting vulnerabilities on (data) =
(0.5 + 1.0 + 0.1 + 0.5 + 0.2) / 5 = 2.3 / 5 = 0.46
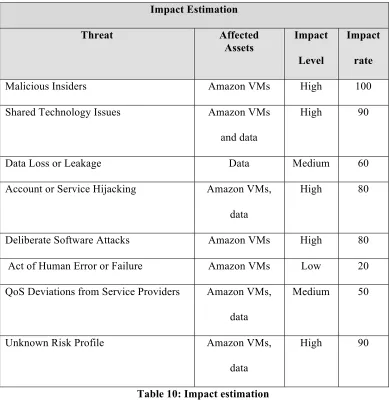
4.3.2.2.2. Impact analysis (I)
NIST states that impact analysis task aims “to determine the adverse impact resulting from a
successful threat exercise of vulnerability” [26]. In this step, this study assesses the loss impact of each
level represents high value asset that may cause high impact to the study’s scenario while low impact
level states the least value assets in the scenario. Each asset is given impact rete that ranges from 1 to 100:
Impact Estimation
Threat Affected
Assets
Impact
Level
Impact
rate
Malicious Insiders Amazon VMs High 100
Shared Technology Issues Amazon VMs
and data
High 90
Data Loss or Leakage Data Medium 60
Account or Service Hijacking Amazon VMs,
data
High 80
Deliberate Software Attacks Amazon VMs High 80
Act of Human Error or Failure Amazon VMs Low 20
QoS Deviations from Service Providers Amazon VMs,
data
Medium 50
Unknown Risk Profile Amazon VMs,
data
[image:44.612.103.492.121.521.2]High 90
Table 10: Impact estimation
From Table 10, this research estimates the asset value based on how a threat impacts given assets.
Then, it calculates the total value of each asset and finds the average as the following:
Impact value of an asset= total impact rate of an asset / the number of caused threats
Impact value of an Amazon EC2 VM =
(100 + 90 + 80 + 80 + 20 + 50 + 90) / 7 = 510 / 7 = 72.8
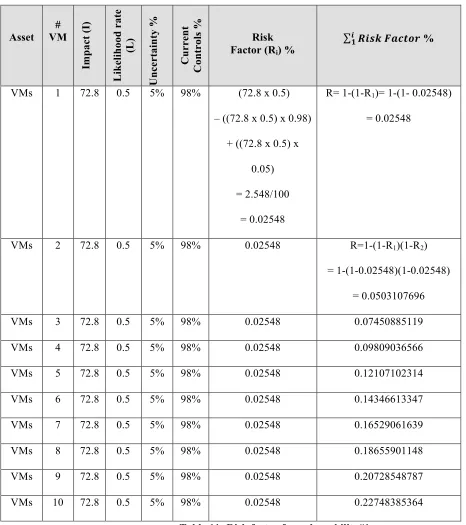
4.3.2.2.3. Risk Determination (R)
After this study determines vulnerabilities likelihoods, and the threats impacts, it uses the outputs to
evaluate and determine the risk level of each asset. NIST declares, “The purpose of this step is to assess
the level of risk to the IT system” [26]. To calculate the risk factor, this research uses the following
formula:
Risk (R) = (Likelihood (L) x Impact (I)) - (percentage of risk mitigated by current controls of given
Vulnerability (%CC) x Likelihood (L) x Impact (I)) + (Uncertainty of given Vulnerability (U) x
Likelihood (L) x Impact (I))
This formula is adapted from this original formula [34]:
Risk = Likelihood of vulnerability x impact – percentage risk already controlled + element of
uncertainly
This formula has four variables:
Likelihood (L):
Likelihood of exploiting vulnerabilities on (Amazon EC2 VMs) = 0.45
Likelihood of exploiting vulnerabilities on (data) = 0.44
Impact (I):
Impact value of an Amazon EC2 VM= 72.8
Impact value of data asset = 74
Percentage of risk mitigated by current controls (CC):
This variable states the current controls that are placed to mitigate risks that impact the assets. In this
study’s scenario, this research estimates the value based on what Amazon has developed to protect the
cloud assets.
Uncertainty (U):
Since it is not possible in risk management to know exactly everything about vulnerabilities, threats, and
used to substitute the unknown errors in the estimations. If the data is 80% accurate, the uncertainty factor
is 100 – 80 = 20%.
Next are calculation tables of risk factor for the vulnerabilities:
Vulnerability #1: Vulnerable VM images provided by the cloud provider.
Asset # VM Im p ac t (I) Li k el ih oo d r at e (L ) Un ce rt ai n ty % Cu rr en t Co n tr ol s % Risk Factor (Ri) %
!"#$ !"#$%&
!
! %
VMs 1 72.8 0.5 5% 98% (72.8 x 0.5)