City, University of London Institutional Repository
Citation
:
Rockenbach, A., Mikulich, V., Bruecker, C. & Schnakenberg, U. (2015). Fluid transport via pneumatically actuated waves on a ciliated wall. Journal of Micromechanics and Microengineering, 25(12), 125009.. doi: 10.1088/0960-1317/25/12/125009This is the accepted version of the paper.
This version of the publication may differ from the final published
version.
Permanent repository link:
http://openaccess.city.ac.uk/15771/Link to published version
:
http://dx.doi.org/10.1088/0960-1317/25/12/125009Copyright and reuse:
City Research Online aims to make research
outputs of City, University of London available to a wider audience.
Copyright and Moral Rights remain with the author(s) and/or copyright
holders. URLs from City Research Online may be freely distributed and
linked to.
FLUID TRANSPORT VIA PNEUMATICALLY ACTUATED WAVES ON A
CIL-IATED WALL
A Rockenbach1, V Mikulich², Ch Brücker2*, and U Schnakenberg1
1
Institute of Materials in Electrical Engineering 1, RWTH Aachen University,
Sommerfeldstraße 24, D-52074 Aachen, Germany
[email protected], phone: +49 241 80 27766
[email protected], phone: +49 241 80 27842
2
Institute of Mechanics and Fluid Dynamics, TU Bergakademie Freiberg,
Lampadiusstrasse 4, D-09595 Freiberg, Germany
[email protected], phone: +493731 39 4133
[email protected], phone: +49 3731 39 3833
*current address: City Univ. of London, email: [email protected]
Abstract
To manipulate fluids actively a pneumatically actuated micro membrane device is developed to generate a
di-rected transversal fluid transport in a liquid layer next to the wall. The biomimetic approach is based on the
prin-ciple of cilia-type arrays that generate a mean flow by travelling wave activation. Rows of long flaps, which
mim-ic the comb row of a ctenophore, are positioned off-centre along a row of cavities. Each cavity is covered by a
flexible membrane that supports the flaps. The membranes with the flaps on top are deflected by applying a
well-defined pressure profile to the cavities under the membranes such that an individual beat can be generated for
each flap. Flow visualization experiments were carried out under the conditions of travelling waves. The results
show a mean velocity profile that resembles that of a wall-jet. Mixing effects with increased retention times of the
1. Introduction
One of the challenges in microfluidic devices is to
propel fluids or particles through channels. A couple
of known transportation methods in closed channels
through physical forces, e.g. pressure driven flow [1],
electrophoresis [2], dielectrophoresis [3], or surface
acoustic wave devices, exist [4]. In some cases,
how-ever, particle transportation in open channels is
re-quired. Here, the methods mentioned above may fail,
because of the absence of a cover plate.
For applications, like automated cleaning of artificial
respiratory systems, damage-free blood cell transport
near surfaces or active antifouling, mechanisms of
transportation can be adopted from nature. Ciliated
surfaces, e.g. in the respiratory tract [5] or in the
Fal-lopian tube are known [6]. Cilia are also used as
pro-pelling mechanism for microorganisms, e.g.
Mesodin-ium rubrum, ParamecMesodin-ium, Volvox, Chlamydomonas
reinhardtii, Ctenophore or Pleurobrachia pileus [7, 8].
These cilia arrays often move in a synchronized
man-ner with a certain phase shift between the neighbour
cilia to optimize transportation of the medium close to
the cilia or to generate self-propulsion of the
microor-ganisms. The concrete actuation principle of the cilia
can vary with the different species.
In the biomimetic approach to mimic biological cilia,
different actuation principles of artificial cilia were
developed in the last decade, using electrostatic forces,
magnetic field, light-excitation, or mechanical forces
for example. As a short overview, significant
publica-tions are briefly reviewed: electrostatically actuated
cilia were fabricated using a bimorph approach of a
thin chromium layer under a thin polyimide layer [9,
10]. The activation of electric current through
underly-ing electrodes allows electrostatic actuation. The
dis-advantage of this approach is the application of high
electric fields to the fluid causing
electro-hydrodynamic and electrolysis effects. Thus, only
non-conducting fluid can be used. Likewise, artificial cilia
using the magnetic-actuated concept were fabricated
by dissolution of superparamagnetic nanoparticles in
polydimethylsiloxane (PDMS)-based cilia structures
[11–15]. However, large and expansive rotating
per-manent magnet arrangements are necessary to enable a
deflection of this cilia type. Furthermore, artificial cilia
made of an assembly of superparamagnetic colloidal
particles were developed, which are held together only
by magnetic forces. [16] To actuate these cilia six
electromagnets have been positioned around the chip,
which increased the complexity of the system.
Optically addressed artificial cilia based on
self-organizing liquid-crystal polymer network actuators
were published by Van Oosten et al. [17]. By using
different inks, mm-sized actuators with different
subu-nits were ink-jet printed, which can be selectively
ad-dressed by changing the wavelength of the light.
Hy-drogel-based cilia were fabricated by using a
soft-lithography approach, yielding a reversible
cilia-bending by pH-value change [18]. Recently, Sareh et
al. presented an artificial cilium based on electro active
polymers which are connected to a finite number of
flexible elements [19]. Sanchez et al. published an
ap-proach composed of oscillatory active multimeric
streptavidin, taxol-stabilized microtubules, and
molec-ular biotin-labelled kinesin motors, which
self-assemble into active bundles, thus exhibiting patterns
reminiscent of those found in eukaryotic cilia and
fla-gella [20]. Dayal et al. presented artificial cilia formed
Belousov-Zhabotinsky reaction, thus form autonomous
self-oscillation of periodic swelling and crescendo
[21].
However, the fabrication processes of all shown
ap-proaches suffer from high costs, complexity and
non-mainstream technologies, preventing a cost-effective
production. On the contrary, soft-lithography and
mi-cro-moulding of polydimethylsiloxane (PDMS) are
established techniques for the production of low-cost
microfluidic devices. Ideally they can be used for the
fabrication of flexible membranes and flaps. Several
papers presented pneumatically driven refreshable
Braille-type cell arrays as tactile display prototypes for
the blind and visually impaired by using pneumatically
actuated PDMS membranes [22–24]. Mechanical
acti-vation of PDMS-based cilia arrays on flexible
mem-branes using base-layer deformation with ball chains
or piston stamps were presented by Keissner and
Brücker [25, 26]. The latter were proven to generate
well-defined streaming patterns, however, the
mechan-ical principle used therein does not allow an individual
addressing of the beating cycle of each cilium; thus the
pattern of the wave-type excitation could only be
var-ied in frequency but not in spatial coordinates.
The objective of this paper is to design an artificial
comb row on flexible membranes using pneumatically
based actuation and the characterization of fluid
transport close to the comb row in uncapped channels.
The basic concept was already published in [27]. The
actuation principle is sketched in Figure 1. Rows of
cilia-like flaps are positioned on flexible membranes
out of the centre of regularly separated cavities. Each
flap can be deflected separately by an induced
pneu-matic pressure from the underside of the cavity, which
then leads to a bending of the supporting membrane.
Owing to the high aspect ratio of the flaps the
mem-brane deflection results in a considerably large
trans-versal motion of the flap tips. Furthermore, this motion
is only driven by the movement of the membranes, and
not by bending the flaps. In addition, as a reaction to
the pressure profile, the outward motion may differ in
the temporal profile from the inward motion of the
membrane, thus imposing an asymmetry in the
tem-poral motion cycle between the forward and backward
directed stroke. The bending cycle between adjacent
cavities can be controlled by addressing the individual
pressure tubes to produce a traveling wave.
Fig. 1: Concept of the pneumatically actuat-ed cilia array (cross-section, not to scale): rows of
flaps are located off-centre on flexible membranes. The pressures ∆p to deflect the membranes is indi-vidually applied to the underlying channels. Design details: the pressure channel (cavity) under the
175 µm thick membranes is 600 µm wide. In
combi-nation with the 400 µm wide supporting structure between two channels a pitch of 1000 µm is defined.
The flaps are 500 µm in height, 50 µm thick and 20
000 µm long in span, respectively. In difference to the upright version presented in [27], the flaps here are tilted by 45°. The forward stroke is generated by
2. Design Concept
The first design introduced in [27] is comprised of
non-continuous flaps on top of the membranes to study
the behaviour of span wise mixing. However, detailed
flow measurements of the flow profiles were
impossi-ble to obtain due to obstruction effects.
The present work is focused on continuous flaps and
their efficiency in generating homogeneous directional
transport. The new setup offers optical access from the
side and top to measure the velocity profiles. An
im-provement was introduced by tilting the flaps by 45° in
order to provoke further symmetry breakage in the
beating pattern. Layout details of the membrane and
the flap structure are shown in Figure 1. The width of
the supporting structure was set to 400 µm and the
width of the cavity to 600 µm, respectively. Typically,
500 µm high (
hflaps
) and 50 µm wide flaps were usedas artificial rows of flaps that extend into the fluid
from the flexible surface. The flaps extend over a large
span of 20 000 µm. These large dimensions were
cho-sen to enable a detailed high-resolution
characteriza-tion of fluid velocities between and above the rows of
flaps.
For all experiments deionized water was used as fluid.
The Reynolds-number of the beating flap is of order of
O(10), which corresponds to the flow regime, were
Ctenophora live in.
To move the fluid effectively at low
Reynolds-numbers an asymmetric movement is required, which
is realized by the following features:
First of all, the time responses of the two stroke phases
differ from another. This is due to the difference in
pressure in the cavity affected by the magnitude and
direction of the pressure pulse, the fluid impedance
and the resistance of the pressure tubes. The base level
of the membrane is defined when all cavities are
connected to the low pressure. A forward stroke is
generated when one valve switches the pressure level
from low to high pressure for a short period of time.
When the valve is retracted to its original position (low
pressure level) the motion is reversed and the flap tilts
backwards to its base level position. Figure 2 shows
the pressure profiles measured within one single
cavity. The discontinuous blue curve refers to the
valve position and reflects the switching behaviour of
the valve. The measured pressure change in the cavity
from low to high level is significantly fast. Here, a
pressure change from -0.6 bar to +0.6 bar lasts 36 ms,
which is referred to the power stroke. After switching
back from high to low pressure level at the valve, the
pressure in the cavity decreases until it reaches the
lower level. This drop follows an exponential decay
and takes a considerably longer time-span in contrast
to the high jump phase. A decrease from +0.6 bar to
-0.6 bar in the cavity lasts 66 ms. This means that the
forward stroke is roughly two times faster than the
backward stroke. Therefore we differ the forward directed “power“ stroke from the backward directed “recovery” stroke, thereby following the notation used
in biology. The timing order of the succession of
beating cycles along the surface is then a further
parameter to generate travelling waves, see Fig 3, in
which each individual flap is showing the same motion
pattern as given in Figure 4. A typical tip speed is then
the tip excursion (350µm) divided by the power stroke
period (36ms) which is roughly uTip10mm/s. The
Reynolds-number defined with the tip velocity and the
height of the flap is then Re5 while for the recovery
force for the power stroke is larger than that of the
recovery stroke, therefore a net flow is expected in the
[image:6.612.97.519.105.349.2]direction of the power stroke.
Fig. 2: Pressure profiles beneath two neighbouring membranes. The discontinuous blue line shows the
valve-position, and the light blue line corresponds to the measured pressure under the membrane. tdead marks
the dead time between the opened valve and the starting pressure rise, which is about 8 ms. tpower stroke is the time
used to switch from low to high pressure, which lasts 36 ms. trecovery stroke is the time used to switch from high
pressure back to low pressure, which lasts 66 ms. The repetition time trepetition varies between 200 ms and
1000 ms. Between two adjacent flaps a time shift ttime shift of 20 or 50 ms is applied, respectively.
The custom-made pneumatic triggering module in
combination with the valves (see chapter 3) is capable
of switching all valves completely independent from
each other. To create a travelling wave mechanism in
the flap array, pressure was switched from +0.6 bar to
-0.6 bar to all of the twenty membranes consecutively.
One wave can be made up of 20 flaps, 10 flaps or
5 flaps (nflaps per wave). The wavelength results in:
, 1
with lpitch being the distance between to flaps, which is
1000 µm.
In the present setup, the “on” time of the valve tvalve on
can be set to a minimum of 36 ms without reduction of
the applied pressure level, which corresponds to a
maximum frequency of 9.8 Hz. This limit is defined
by the length of recovery and power stroke. In general,
a much lower frequency is defined to keep the
move-ment well defined. The valves were switched on for
40 and 100 ms. A duty cycle D of 10 and 40% is
de-fined, with respect to the “off” time tvalve off:
The propagation velocity of the wave depends on the
pitch lpitch between two flaps and the applied time shift
tshift. The wave velocity vwave can be defined as:
3
The beating of a flap is defined by two parameters, the “on” time tvalve on and “off” time tvalve off of the valve.
From these parameters the beating frequency fbeating
( )
( )
4
[image:7.612.53.299.391.526.2]is derived.
Figure 3 shows a snapshot picture of a wave travelling
through the fluid channel (side view) with the applied
pressures to each membrane. A section of 8 flaps is
shown and one wave is visible in the middle. In the
experiments 1, 2 or 4 waves were applied to the whole
[image:7.612.325.552.393.586.2]device consisting of 20 membranes.
Fig. 3: Travelling wave chronology. The
traveling wave is applied from left to right, as the flaps are numbered. Effective stroke (high pressure)
is applied on flap 4 and 5. At flap 1 the membrane
deformation as well as the flap deflection corre-sponds to the application of the recovery stroke. The
vertical lines mark the pressure level at the
individ-ual position of each membrane-flap combination. Pressure changes with time. Between tn and tn+1 a
time increment of tphase shift was adjusted.
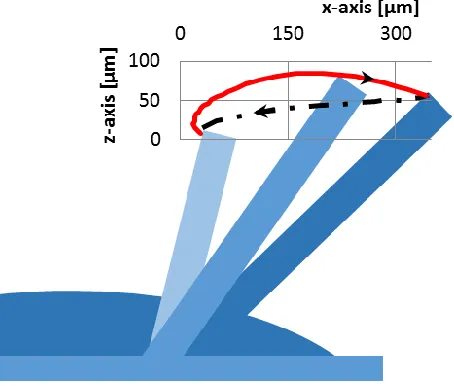
In addition, the path of the flap tip is asymmetric.
When a pressure change is applied to one single cavity
from low to high pressure, the resulting motion pattern
of the flap resembles a power stroke of the flap. Owing
the interaction of the cavity pressure with the support
structures and the material parameters of the
elasto-mer, the change in pressure back to low levels leads to
a slightly different path of the flap tip during
mem-brane relaxation and inversion. This is depicted in
Fig-ure 4 by means of the measFig-ured path of the tip in the
forward (red line) and backward (dashed black line)
motion phase. There is a clear indication of hysteresis:
in the forward stroke the flap tip reaches deeper into
the fluid, while in the retrace phase of the flap the tip
follows a path closer to the wall. The total height
dif-ference on the 342 µm long path was determined to be
85 µm, which corresponds to 17 % of the flap height.
Fig. 4: Schematic view of the flap movement with the measured path of a flaps tip. The upper
path represents the fast power stroke whereas the
lower path corresponds to the slow recovery stroke. In the upper path high-pressure whereas in the
low-er path low-pressure is applied. The data wlow-ere
under a pressure application of -0.6 bar to +0.6 bar.
Compared to natural cilia the achieved relative
deflec-tion normalized to the cilia height is smaller in this
artificial approach. In nature, the length of a typical
complete stroke is 1.6 to nearly double the height of
the cilium itself [28], whereas with our artificial cilia a
movement of 450 µm was realized, corresponding to a
ratio of 0.9. This is comparable to other artificial
sys-tems like those published by Den Toonder et al. [9, 10]
with a ratio of 0.4, and those reported by Shields et al.,
Fahrni et al. and Brennen et al. [12, 13, 29] with a ratio
of 0.9 to 1.24, as well as Pokroy et al. and Brennen et
al. [18, 30] with a ratio of about 1. Only Timonen et al.
achieved a higher ratio of about 2, but without further
report about the details of the induced flow [15].
Note, that a quantitative comparison of flow transport
effectiveness between the different artificial cilia
ap-proaches is difficult since they use different scales,
beating patterns and wave characteristics. The herein
presented concept is not designed to investigate the
flow in the very limit of the Stokes-regime but to
cov-er also the condition whcov-ere Ctenophore and
Pleurobra-chia pileus are generating transport. This is at
Reyn-olds-number of order of O(10) where inertia effects
already play a grave role. Part of the contributing
fac-tors for flow transport is therefore the difference in
speed of the power- and recovery stroke as explained
above. Another but probably only small contribution
might come from the hysteresis in the motion of the
flaps. In the power stroke the flaps extends farther in
the flow than in the recovery stroke. Therefore, the
effective area generating the momentum transfer is
larger in the power stroke than in the recovery phase.
3. Materials and methods
The foil was fabricated from PDMS (Sylgard 184,
Dow Corning, Midland, USA) using standard UV
li-thography and soft-lili-thography techniques in
combina-tion with SU-8 micro moulds. Two moulds are needed.
For the first one the process flow is schematically
shown in Figure 5. First, a 100 mm borosilicate glass
wafer was coated and structured with an evaporated
chromium layer serving as a mask [31] (Figure 5A).
Five 100 µm SU-8-layers (MicroChem, Newton,
USA) were consecutively spun onto the
chromium-side of the wafer (front chromium-side) using a RC-8 spin coater
with a Gyrset top frame (Süss MicroTec, Garching,
Germany). Soft-bakes were carried out after each
dep-osition step. The resulting 500 µm thick SU-8 layer
was exposed to a light density of 500 mJ/cm² from the
backside of the wafer using a Süss MicroTec MA6
mask aligner (Figure 5B). This ensures a high slew
rate of the SU-8 structures which is necessary to
peel-off the casted PDMS from the SU-8 moulds later on.
After a post-exposure bake (six hours at 50°C and six
hours at 65°C) a sixth 100 µm thick SU-8 layer was
spun on the front side of the wafer and exposed using a
mask followed by the post-exposure bake described
above. All six SU-8 layers were wet-chemically
de-veloped in a mr-dev 600 (MicroChem) in one step
(Figure 5C). The first five sublayers form the mould
for the flaps. The top sixth SU-8 layer forms spacers to
define the membrane thickness. Finally, the developed
wafers were coated with a 1 µm thick Parylene-C layer
(PDS 2010, SCS Specialty Coating Systems,
Indian-apolis, USA) serving as a non-sticking coating.
The second mould is needed to form the channels
be-neath the membranes. The fabrication process is
top layer defines self-alignment structures fit to the
first mould and align the two moulds to each other
(Figure 5D). Using this alignment method the
undesir-able rotation from one mould to the other was reduced
to +/- 0.05°.
Subsequently, PDMS was prepared according to the
manufacturer’s instructions by vacuum mixing and
casted on top of both wafers (Figure 5E). The casts
were evacuated for 15 minutes at 100 mbar to remove
bubbles in small cavities. The two moulds were moved
slowly towards each other starting at one side and
pushing the surplus silicone out on the other side
(Fig-ure 5F). The assembled parts were c(Fig-ured at 60°C for
one hour (Figure 5G).
The cured silicone was first peeled-off from the
mem-brane forming mould (Figure 5H) and then from the
cilia forming mould (Figure 5I). To carry out a
repro-ducible peeling process the membrane has to have a
minimum thickness of 100 µm.
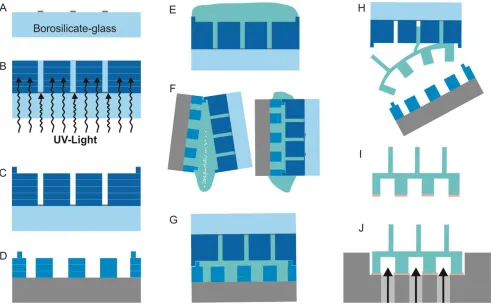
Fig. 5 Process flow for the fabrication of the biomimetic particle transporter chip. Two moulds are
needed. A) Glass wafer with chromium layer (front side). B) Consecutive deposition of several SU-8 layers, soft-bake and UV exposure from the back side. C) Deposition of an additional SU-8 layer defining the
mem-brane thickness in the first mould and serving as an adjustment structure for the assembly in the second mould
(D). E) Casting of PDMS on both moulds. F) Pushing the two moulds together. G) Curing. H) Peeling off the cured silicone from the two moulds. I) Silicone part with a thin film of silicone glue. J) Silicone part assembled
to the connector. For detailed description the reader is referred to the text.
The silicone foil is glued to an aluminium connector of
the macroscopic valve system containing
feed-throughs, so that each membrane can be addressed
[image:9.612.55.546.242.546.2]con-tact printing technology with MED1-4013 glue (Nusil
Technology, Sophia Antipolis, France) diluted 1:2 in
cyclohexane spun on the wafer (Figure 5J). After
bonding, the compound was finally cured twelve hours
in an oven at 60°C.
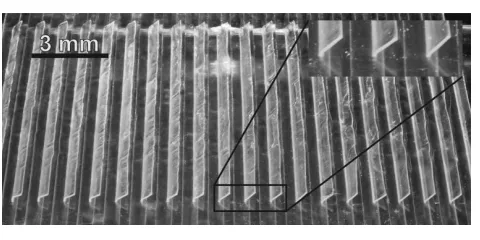
Figure 6 shows the complete silicone device.
Trans-parent 30 mm long membranes are arranged in 20
rows laterally with a pitch of 1 mm. On top of each
membrane a 20 mm long flap is arranged.
To tilt the flaps and reach an angle of 45° the flaps
were pushed to one side and pressed down completely
using a glass slide and a weight of 400 g. The PDMS
used must be bended directly after curing. To do that a
glass slide is positioned at one side of the foil and
pushed to the other side, so that all flaps are tilted one
by one. Then the slide was fixed and bended at 80°C
for 1.5 hours in an oven. The last step is to lift up the
[image:10.612.53.293.389.509.2]flaps from the foil, to prohibit further bending.
Fig. 6: Photograph of the artificial comb
row array. 20 rows of flaps are located on flexible
membranes (not shown while on the back side). Each channel is 30 000 µm long. On each
mem-brane a 20 000 µm long and tilted flap is located.
The pressure under the membranes was applied with
the aid of a custom-made valve system using
MHP1-M4H 3/2-way-valves (Festo, Esslingen, Germany)
having a switching time of about 4 ms. The valve
sys-tem was controlled by a NI cRio-9074 control unit
(National Instruments, Austin, USA). The valves
switch the pressure from +0.6 bar to -0.6 bar. The high
pressure and low pressure is applied from pressure
reservoirs. Phase shifts between two adjacent
mem-branes establish a travelling wave mechanism. If the
traveling wave is moving in the direction of the power stroke the wave is called “symplectic”, while it is named “antiplectic” when applied in the reverse
direc-tion. The transport behaviour was studied using the
method of particle tracing. Polystyrene particles with
an average size of about 50.7 µm +/- 0.7 µm
(Micro-particles, Berlin, Germany) were used.
4. Results and Discussion
Particle pathlines were visualized by superposition of a
series of pictures taken at the same phase within the
traveling wave cycle. Figure 7 shows a superposition
of 205 pictures with a time shift of 200 ms.
Differences in particle velocity can be calculated by
measuring the distances between two pictures of the
same particle. In the superposed image slow particles
were characterized by continuous lines and fast
particles by discontinuous lines. The overall particle
transport was always from left to right in the direction
of the power stroke, for comparison see Figure 1. The
lens focus was set to the centre of the channel such
that a larger number of particles above the flaps were
in focus. The upper interface from the liquid layer to
the surrounding air was set to a height of 12 times the
height of a flap within the channel. A typical measured
flow profile is shown in Figure 7 (parameter-set:
symplectic wave, frequency 5 Hz, duty cycle 25%,
wave velocity 100 mm/s and wave length 20 mm). The
red line characterizes the horizontal velocity
of the flow profile. A maximum particle velocity of
426 µm/s was calculated, whereas the mean velocity in
x-direction was 188 µm/s. The average sedimentation
[image:11.612.57.293.140.343.2]velocity in z-direction was determined to be 14 µm/s.
Fig. 7: Superposed phase-locked images (in
side view) of a membrane and flap arrangement. The focus is set to the first third of the flap row. The
images are superposed from a series of
205 individual pictures taken at the same phase within the wave cycle. Parameter-set: frequency
5 Hz, duty cycle 25%, wave velocity 100 mm/s and
wave length 20 mm. The white curve represents a fit curve of the flow profile (red curve).
The flow profile was fitted using a skewed Gaussian
approximating of a typical wall-jet profile [32]. The fit
shows the characteristics of a wall-induced transport
like a wall-jet. With the flaps tilted by 45°, the mean
transport velocity by our device was increased by a
factor of 8 in comparison to the vertical flap
arrange-ment [27].
In general, at a larger distance from the wall (> 2 hflap)
the recorded flow patterns illustrate a rather
homoge-nous transversal transport from left to right in direction
of the power stroke. In contrast, large vertical up- and
downwards motion is formed because of the cilia
beat-ing cycle near the flaps. The phase-averaged path lines
show a curved flow around the tips of the flaps, which
is similar for all rows of flaps.
The measurements were also repeated with the
travel-ling waves running in reverse direction (antiplectic)
while retaining other boundary conditions. The
ob-served transport was still in direction of the power
stroke. This implies that fluid transport direction is
mainly defined by the flap tilt. We rotated the device
by180° around the vertical axis and observed reverse
of flow direction, this let us conclude that there were
no external disturbances affecting the flow direction.
Finally, we tested the transport with synchronous
flap-ping while all other parameters were kept constant.
The results shown in Fig 8 clearly reveal that transport
is much worse than with travelling wave motion. A
possible explanation is that in case of synchronous
flapping there is no phase difference in the flaps
kine-matics. As consequence, there is no relative motion
between the neighbouring flaps. In contrast, for
run-ning waves the relative motion between neighbouring
flaps causes a considerable squeeze flow in the gaps as
seen in the particle trace visualizations between the
flaps in Figure 7. This is concluded to be the reason
for a much slower fluid propelling at synchronous
flapping. In addition, we observe the squeeze flow
an-gled against the wall-normal because of the tilt of the
flaps which guide the fluid out of the bottom layer.
Thus, direction of the squeeze flow is given by the tilt
of the flaps and contributes to the transversal flow
generated in the upper layer. In comparison, direction
of the travelling wave - either symplectic or antiplectic – therefore seemingly does not affect the direction of
the speed of the transversal fluid transport at
symplec-tic wave propagation was in any case higher than for
antiplectic propagation at otherwise unchanged
condi-tions. This is attributed to the potential effect known as
the waving plate mechanism, as described by Wu [33].
Though the flow in our case is at low
Reynolds-numbers, there is still considerable influence of inertia
that might explain the difference in mean transport
[image:12.612.55.295.238.509.2]speed at the different directions of wave vectors.
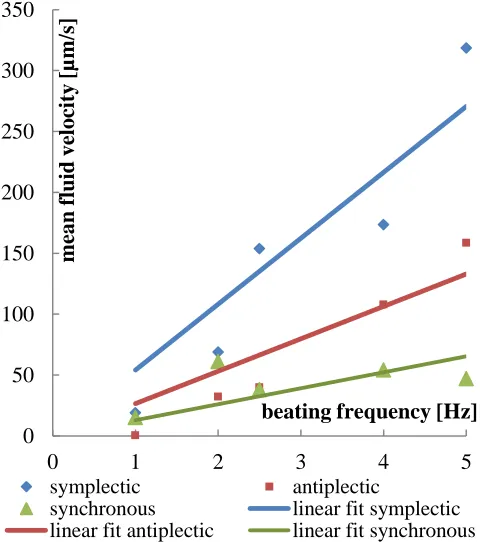
Fig. 8: Mean fluid velocity with respect to
beating frequency of the flaps, while the Reynolds number was constant. Exact values are given in
Ta-ble 1.
What else is seen in Figure 8 is the clear tendency of
increased transversal speed with increasing beating
frequency. Again, the Reynolds numbers for both
strokes are kept constant. The corresponding
parame-ter sets are listed in Table 1 in the Annex. A frequency
of 5 Hz is the highest beating frequency for which
rea-sonable results were achieved with the device.
This tendency agrees with the observations by
Dauptain et al. [28] regarding a simulated beating
comb row of the ctenophore Pleurobrachia pileus at
frequencies between 5 and 25 Hz. They reported a
peak velocity of about 70 mm/s for 2 mm long flaps at
25 Hz. Vilfan et al. (magnetic particles chains 31 µm
long [16]) reported a velocity of 3.3 µm/s in their
sys-tems. The device developed by Shields (magnetic
na-norods, 25 µm long) realized a transport velocity of
200 µm/s at 5 Hz, which is also propelled by magnetic
fields [13]. Toonder et al. reported, a peak velocity of
600 µm/s with their microparticle chains for their
100 µm long cilia [9]. However, these magnetically
driven devices were mainly used for mixing and not
for homogeneous transport. Again, note that a
quanti-tative comparison between the different artificial cilia
devices is difficult because of the largely differing flap
shapes, motion patterns, flow conditions and wave
parameters, if any waves are involved.
5. Conclusion
A travelling wave concept was introduced for
direc-tional fluid transport near a ciliated wall by pneumatic
actuation. With this approach a device was realized
which is able to generate a homogeneous fluid
transport with substantial flow velocities near the wall.
Silicone flaps mimicking a comb row of ctenophore
Pleurobrachia pileus were positioned on a flexible
membrane and actuated individually through
applica-tion of pneumatic pressure from the underside. The
repeated application of travelling waves along the
rows of cavities induced a continuous net flow above 0
50 100 150 200 250 300 350
0 1 2 3 4 5
m
ean
fl
uid
vel
oci
ty
[µm
/s]
beating frequency [Hz]
symplectic antiplectic
the flap tips in direction of the power stroke, for both
the symplectic and the antiplectic case. Another factor
of importance is the tilt of the flaps and its effect on
the directional guidance of the squeeze-flow that is
generated in the gap between neighbouring flaps. It is
assumed that this effect contributes to the observed net
flow directed always along the power stroke. As
ex-pected, flow speed increases with beating frequency,
too. For our device maximum velocities (flaps with
500 µm height) were observed at beating frequencies
of 5 Hz, which resulted in a mean velocity of
319 µm/s. In comparison to other concepts using
arti-ficial cilia, this device produces a homogeneous
transport and is more flexible in size and actuation. In
addition, during long-term experiments over one week
the device did not show any symptoms of fatigue.
De-tailed investigations of the flow profiles between and
above the comb rows provide guidelines for
down-scaling the device to relevant microfluidic geometries
making the concept attractive and promising for
un-capped system applications, where defined flow
pro-files or mixing with high retention times are needed.
For use in real microsystems the dimensions can easily
be reduced by redesign in combination with 3-D-
printing of the moulds.
6. Acknowledgements
Funding was granted by the German Federal Ministry
of Education and Research under grant #16SV5341
(PaTra) and German Research Foundation DFG, grant
# SCHN 587/15-1 and BR 1494/30-1 within the priori-ty program “Microswimmers”. We gratefully
acknowledge the funding and the cooperation with our
project partners P. Uhlmann, A. Rollberg, and M.
Kunder from Leibniz Institute of Polymer Research
Dresden e.V. - Dept. Physical Chemistry und Polymer
Physics, Dresden, Germany. Gerhard Bleidiessel from
microresist technology MRT, Berlin, Germany, is
gratefully acknowledged for his outstanding support
and discussions relating to SU-8 processing
challeng-es.
7. References
[1] Squires TM, “Microfluidics : Fluid physics at the nanoliter scale,” Rev. Mod. Phys., vol. 77, no. July, pp. 977–1016, 2005.
[2] Wu D et al., “Electrophoretic separations on microfluidic chips,” J. Chromatogr. A, vol. 1184, no. 1–2, pp. 542–59, Mar. 2008.
[3] Markx GH and Davey CL, “The dielectric properties of biological cells at radiofrequencies: applications in biotechnology,” Enzyme Microb. Technol., vol. 25, no. 3–5, pp. 161–171, Aug. 1999.
[4] Friend J and Yeo LY, “Microscale acoustofluidics: Microfluidics driven via acoustics and ultrasonics,” Rev. Mod. Phys., vol. 83, no. 2, pp. 647–704, Jun. 2011.
[5] Sleigh MA et al., “State of Art The Propulsion of Mucus by Cilia,” Am. Rev. Resipratory Dis., vol. 137, no. 3, pp. 726–41, 1988.
[6] Lyons RA et al., “The reproductive significance of human Fallopian tube cilia,” Hum. Reprod. Update, vol. 12, no. 4, pp. 363–372, 2006. [7] Guasto JS et al., “Fluid Mechanics of Planktonic
Microorganisms,” Annu. Rev. Fluid Mech., vol. 44, no. 1, pp. 373–400, Jan. 2012.
[8] Goldstein R et al., “Noise and Synchronization in Pairs of Beating Eukaryotic Flagella,” Phys. Rev. Lett., vol. 103, no. 16, p. 168103, Oct. 2009.
[9] Den Toonder JMJ and Onck PR, “Microfluidic manipulation with artificial/bioinspired cilia,”
Trends Biotechnol., vol. 31, no. 2, pp. 85–91, Feb. 2013.
[10] Den Toonder JM et al., “Artificial cilia for active micro-fluidic mixing,” Lab Chip, vol. 8, no. 4, pp. 533–541, Apr. 2008.
[12] Shields AR et al., “Biomimetic cilia arrays generate simultaneous pumping and mixing regimes,” Proc. Natl. Acad. Sci. U. S. A., vol. 107, no. 36, pp. 15670–5, Sep. 2010.
[13] Fahrni F et al., “Micro-fluidic actuation using magnetic artificial cilia,” Lab Chip, vol. 9, no. 23, pp. 3413–21, Dec. 2009.
[14] Den Toonder JMJ, “Artic Project,” 2014. [Online]. Available: www.artic-ptoject.eu. [15] Timonen JVI et al., “A facile template-free
approach to magnetodriven, multifunctional artificial cilia,” ACS Appl. Mater. Interfaces, vol. 2, no. 8, pp. 2226–30, Aug. 2010.
[16] Vilfan M et al., “Self-assembled artificial cilia,”
Proc. Natl. Acad. Sci. U. S. A., vol. 107, no. 5, pp. 1844–7, Feb. 2010.
[17] Van Oosten CL et al., “Printed artificial cilia from liquid-crystal network actuators modularly driven by light,” Nat. Mater., vol. 8, no. 8, pp. 677–682, Aug. 2009.
[18] Zarzar LD et al., “Bio-inspired design of submerged hydrogel-actuated polymer microstructures operating in response to pH,”
Adv. Mater., vol. 23, no. 12, pp. 1442–6, Mar. 2011.
[19] Sareh S et al., “Swimming like algae : biomimetic soft artificial cilia,” J. R. Soc. Interface, 2012.
[20] Sanchez T et al., “Cilia-like beating of active microtubule bundles,” Science, vol. 333, no. 6041, pp. 456–9, Jul. 2011.
[21] Dayal P et al., “Chemically-mediated communication in self-oscillating, biomimetic cilia,” J. Mater. Chem., vol. 22, no. 1, p. 241, 2012.
[22] Wu X et al., “A refreshable braille cell based on pneumatic microbubble actuators,” J. Microelectromechanical Syst., vol. 21, no. 4, pp. 908–916, 2012.
[23] Richard E. Fan, Adam M. Feinman, Christopher Wottawa, Chih-Hung King, Miguel L. Franco, Erik P. Dutson, Warren S. Grundfest MOC,
“Characterization of a Pneumatic Balloon Actuator for Use in Refreshable Braille Displays,” in Medicine Meets Virtual Reality 17, 2009, pp. 94 – 96.
[24] Pakazad SK et al., “A platform for manufacturable stretchable micro-electrode arrays,” Procedia Eng., vol. 47, pp. 817–820, 2012.
[25] Keißner A and Brücker C, “Directional fluid transport along artificial ciliary surfaces with base-layer actuation of counter-rotating orbital beating patterns,” Soft Matter, vol. 8, no. 19, p. 5342, 2012.
[26] Brücker C and Keissner A, “Streaming and mixing induced by a bundle of ciliary vibrating micro-pillars,” Exp. Fluids, vol. 49, no. 1, pp. 57–65, Nov. 2009.
[27] Rockenbach A et al., “Pneumatically Actuated Biomimetic Particle Transporter,” in 2014 IEEE 27th International Conference on Micro Electro Mechanical Systems (MEMS 2014), 2014, pp. 927–930.
[28] Dauptain A et al., “Hydrodynamics of ciliary propulsion,” J. Fluids Struct., vol. 24, no. 8, pp. 1156–1165, Nov. 2008.
[29] Brennen C and Winet H, “Fluid Mechanics of Propulsion by Cilia and Flagella,” Annu. Rev. Fluid Mech., vol. 9, pp. 339–98, 1977.
[30] Pokroy B et al., “Fabrication of Bioinspired Actuated Nanostructures with Arbitrary Geometry and Stiffness,” Adv. Mater., vol. 21, no. 4, pp. 463–469, Jan. 2009.
[31] Sato H et al., “An all SU-8 microfluidic chip with built-in 3D fine microstructures,” J. Micromechanics Microengineering, vol. 16, pp. 2318–2322, 2006.
[32] Hoskinson AR et al., “Force measurements of single and double barrier DBD plasma actuators in quiescent air,” J. Phys. D. Appl. Phys., vol. 41, p. 245209, 2008.
8. Appendix
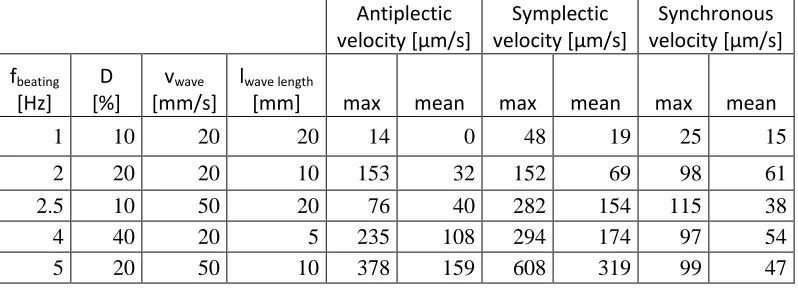
Table 1: Parameters for different beating frequencies and corresponding velocities for antiplectic, symplectic
and synchronous beating. For synchronous beating only the parameters “beating frequency” and “duty cycle” are applicable.
Antiplectic velocity [µm/s]
Symplectic velocity [µm/s]
Synchronous velocity [µm/s] fbeating
[Hz] D [%]
vwave
[mm/s]
lwave length
[mm] max mean max mean max mean
1 10 20 20 14 0 48 19 25 15