PENGESAHAN PENYELIA
“Saya akui bahawa saya telah membaca karya ini dan pada pandangan saya karya ini
adalah memadai dari skop dan kualiti untuk tujuan penganugerahan Ijazah Sarjana Muda Kejuruteraan Mekanikal (Rekabentuk & Inovasi)”
Tandatangan : ...
Nama Penyelia I : PN. ZAKIAH BINTI ABD HALIM
Tarikh : MEI 2009
Tandatangan : ...
Nama Penyelia II : PN. SITI HAJAR BT. SHEIKH MD. FADZULLAH
THE EFFECT OF PROBE TYPE IN ULTRASONIC TESTING
MUHAMAD FIRDAUZ BIN ABD. RASID
Laporan ini dikemukakan sebagai
memenuhi syarat sebahagian daripada syarat penganugerahan Ijazah Sarjana Muda Kejuruteraan Mekanikal (Design & Innovation)
Fakulti Kejuruteraan Mekanikal Universiti Teknikal Malaysia Melaka
“Saya akui laporan ini adalah hasil kerja saya sendiri kecuali ringkasan dan petikan yang tiap-tiap satunya saya telah jelaskan sumbernya.”
Tandatangan : ...
Nama penulis : MUHAMAD FIRDAUZ BIN ABD. RASID
ACKNOWLEDGEMENTS
First of all, I would like to give my utmost appreciation to Allah Almighty for His blessing, this project finally complete for submission to the Mechanical Engineering Faculty at Universiti Teknikal Malaysia Melaka (UTeM). Thanks to Allah Almighty to give me such a healthy body and clear mind to go through to finish this report.
I would like to express my highest gratitude to Mrs. Zakiah bt. Abd Halim as my supervisor, for her advice and guidance throughout this project. Not forgotten, to Mr. Saha, Mr. Shahrul, Mr. Syafiq and also Mr. Helmi from Advance Manufacturing Center (AMC) for their help to fabricate the test sample by using CNC 5-Axis Face Milling (DMG-DMU250) machine. I also would like to express my appreciation to Mr. Rizal from Non-Destructive Testing (NDT) laboratory for his help regarding to handle Krautkramer Ultrasonic Flaw Detector as a device to detect the defects.
ABSTRACT
ABSTRAK
LIST OF CONTENT
CHAPTER INDEX PAGE
ACKNOWLEDGEMENTS і
ABSTRACT іі
ABSTRAK ііі
LIST OF CONTENT іv
LIST OF TABLE vіii
LIST OF FIGURE ix
CHAPTER 1 INTRODUCTION 1
1.1 Background of project 1
1.2 Problem statement 2
1.3 Objective 3
1.4 Scope 3
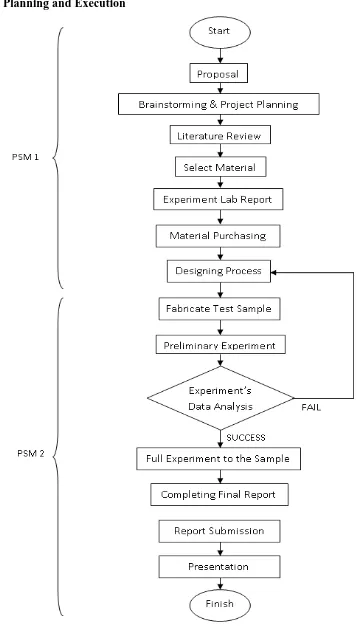
1.5 Planning and execution 4
CHAPTER 2 LITERATURE REVIEW 6
2.1 Basic Principle of Ultrasonic Testing 6
2.1.1 Probe 8
2.1.2 Selection of probe 9
2.1.3 Probe scanning 11
CHAPTER INDEX PAGE
CHAPTER 3 METHODOLOGY 17
3.1 Introduction 17
3.2 Material Selection 18
3.3 Research design 19
3.4 Designing Process 20
3.4.1 Sketch 1 21
3.4.2 Sketch 2 22
3.4.3 Sketch 3 24
3.4.4 Sketch 4 26
3.4.5 Drawing 28
3.5 Fabricate test sample 29
3.5.1 CNC 5-Axis Face Milling (DMG-DMU250) 29
3.5.2 Wirecut Machine 32
3.6 Experiment Procedure 36
3.6.1 Equipments 36
3.6.2 Procedures 40
3.6.2.1 Calibrating 40
3.6.2.2 Ultrasonic Testing Experiment 44
3.6.3 Record the Data 47
CHAPTER 4 RESULT AND DISCUSSION 48
4.1 Introduction 48
CHAPTER INDEX PAGE
4.3.2 Characteristic for Part D 55 4.3.2.1 Single Probe (4MHz) 55 4.3.2.2 Dual Probe (4MHz) 56 4.3.2.3 Comparison 57
4.3.3 Characteristic for Part B 58
4.3.3.1 Single Probe (4MHz) 58 4.3.3.2 Dual Probe (4MHz) 60 4.3.3.3 Comparison 62
4.3.4 Characteristic for Part F 64
4.3.4.1 Single Probe (4MHz) 64 4.3.4.2 Dual Probe (4MHz) 66 4.3.4.3 Comparison 68
4.3.5 Characteristic for Part C 70
4.3.5.1 Single Probe (4MHz) 70 4.3.5.2 Dual Probe (4MHz) 71 4.3.5.3 Comparison 72
4.3.6 Characteristic for Part A 73
4.3.6.1 Single Probe (4MHz) 73 4.3.6.2 Dual Probe (4MHz) 77 4.3.6.3 Comparison 80
4.3.7 Characteristic for Part E 82
4.3.7.1 Single Probe (4MHz) 82 4.3.7.2 Dual Probe (4MHz) 84 4.3.7.3 Comparison 86 4.4 Theoretical Data Analysis for Notch 88
4.4.1 Theoretical Calculation 89
4.5 Experimental Data Analysis for Notch 92 4.5.1 Characteristic for Sound Part 1 (Sa1) 92
CHAPTER INDEX PAGE
4.5.3 Characteristic for the Maximum Sound Part (Samax)
94
4.5.4 Characteristic for the Second Value of Sound Part 4 (Sa4)
95
4.5.5 Characteristic for Distance 1 (d1) 96
4.5.6 Characteristic for Distance 2 (d2) 97
4.5.7 Characteristic for the Notch Length 98
4.6 Theoretical Positioning 100
4.7 Experimental Pockets Scanned by Single Probe (4MHz)
103
4.8 Experimental Pockets Scanned by Dual Probe (4MHz)
107
4.9 Experimental Notch Scanned by 45° Angle Probe (4MHz)
111
4.10 Discussion 115
CHAPTER 5 CONCLUSION AND RECOMMENDATION
5.1 Conclusion 121
5.2 Recommendation 124
REFERENCES xv
APPENDIX A xvii
LIST OF TABLE
NUMBER TITLE PAGE
3.1 Material properties for mild steel [9] 18
3.2 Dimension for each parts 27
3.3 The CNC 5-Axis Face Milling (DMG-DMU250) technical specification [10]
30
3.4 Specification of the input data to initially set up the Ultrasonic Flaw Detector
40
4.1 Characteristic for all parts due to its actual Sound Part (Sa) 51 5.1 Calculated and obtained value from Single Probe (4MHz)
detection
115
5.2 Calculated and obtained value from Dual Probe (4MHz) detection
117
5.3 Calculated and obtained value of the Sound Part (Sa) from 45° Angle Probe (4MHz) detection
118
5.4 Calculated and obtained value from 45° Angle Probe (4MHz) detection
119
A1 Gantt chart for PSM 1 xviii
A2 Gantt chart for PSM 2 xviii
A3 Some part of the machine code of the CNC 5-Axiz Face Milling machine
LIST OF FIGURE
NUMBER TITLE PAGE
1.1 Planning and execution for PSM 4
2.1 Ultrasonic Processor [4] 8
2.2 Different type of probe 9
2.3 Probe scanning patterns 12
2.4 Research picture [5] 14
2.5 Crack tip recognition by phase angle evaluation [7] 15
2.6 Experiment schematic [8] 16
3.1 Research Methodology 17
3.2 Flow process for research design 19
3.3 Sketch 1 of test sample 21
3.4 Sketch 2 of test sample 22
3.5 Sketch 3 of test sample 24
3.6 Sketch 4 of test sample 26
3.7 Drawing of the final design of test sample by using Catia V5R16
28
3.8 CNC 5-Axis Face Milling (DMG-DMU250) [10] 29
3.9 Raw material of the test sample 31
3.10 Milling process on the test sample surface 31
3.11 Finish to fabricate test sample by using CNC 5-Axis Face Milling (DMG-DMU250)
32
NUMBER TITLE PAGE
3.13 Figure 3.13: Cutting concept operate by EDM Wirecut Machine [12]
33
3.14 Picture of the notch part at Sketch 4 34
3.15 Test sample condition before wire cutting process 34 3.16 Final condition of the test sample after wire cutting process
been done
35
3.17 Ultrasonic Flaw Detector (Krautkramer Model USM 250) 36
3.18 V1 Calibration Block 37
3.19 Test Sample (Mild steel) 37
3.20 Single probe (4MHz) 38
3.21 Dual probe (4MHz) 38
3.22 45° angle probe (4MHz) 39
3.23 Coupling gel 39
3.24 Dimensions VI Calibration block 41
3.25 Block Diagram of Ultrasonic Flaw Detector [1] 42
3.26 Angle Beam Probe defect detection [3] 43
3.27 Marked ‘A’ as an initial start point 44
3.28 Probe scanning route horizontally 44
3.29 Probe scanning route vertically 45
3.30 Backside view on the test sample 46
4.1 Characteristic for all parts due to its actual Sound Part (Sa) 50 4.2 Actual Sound Part (Sa) for test sample thickness 52 4.3 Experimental Sound Part (Sa) frequency of the test
sample thickness scanned by single probe (4MHz)
52
4.4 Experimental Sound Part (Sa) frequency of the test sample thickness detected by Dual Probe (4MHz)
53
4.5 The comparison of Sound Part (Sa) frequency of the test sample thickness
54
[image:13.612.114.522.66.710.2]NUMBER TITLE PAGE
4.7 Experimental Sound Part (Sa) frequency of the pocket D scanned single probe (4MHz)
55
4.8 Experimental Sound Part (Sa) frequency of the pocket D scanned by dual probe (4MHz)
56
4.9 The comparison of Sound Part (Sa) frequency of pocket D 57
4.10 Actual Sound Part (Sa) for pocket B 58
4.11 Experimental first Sound Part (Sa) frequency of the pocket B scanned by single probe (4MHz)
58
4.12 Experimental second Sound Part (Sa) frequency of the pocket B scanned by single probe (4MHz)
59
4.13 Experimental first Sound Part (Sa) frequency of the pocket B scanned by dual probe (4MHz)
60
4.14 Experimental second Sound Part (Sa) frequency of the pocket B scanned by dual probe (4MHz)
61
4.15 The comparison of first Sound Part (Sa) frequency of pocket B
62
4.16 The comparison of second Sound Part (Sa) frequency of pocket B
63
4.17 Actual Sound Part (Sa) for pocket F 64
4.18 Experimental first Sound Part (Sa) frequency of the pocket F scanned by single probe (4MHz)
64
4.19 Experimental second Sound Part (Sa) frequency of the pocket F scanned by single probe (4MHz)
65
4.20 Experimental first Sound Part (Sa) frequency of the pocket F scanned by dual probe (4MHz)
66
4.21 Experimental second Sound Part (Sa) frequency of the pocket F scanned by dual probe (4MHz)
NUMBER TITLE PAGE
4.22 The comparison of first Sound Part (Sa) frequency of pocket F
68
4.23 The comparison of second Sound Part (Sa) frequency of pocket F
69
4.24 Actual Sound Part (Sa) for pocket F 70
4.25 Experimental Sound Part (Sa) frequency of the pocket C scanned by single probe (4MHz)
70
4.26 Experimental Sound Part (Sa) frequency of the pocket C scanned by dual probe (4MHz)
71
4.27 The comparison of Sound Part (Sa) frequency of pocket C 72
4.28 Actual Sound Part (Sa) for pocket A 73
4.29 Experimental first Sound Part (Sa) frequency of the pocket A scanned by single probe (4MHz)
74
4.30 Experimental second Sound Part (Sa) frequency of the pocket A scanned by single probe (4MHz)
74
4.31 Experimental third Sound Part (Sa) frequency of the pocket A scanned by single probe (4MHz)
75
4.32 Experimental first Sound Part (Sa) frequency of the pocket A scanned by dual probe (4MHz)
77
4.33 Experimental second Sound Part (Sa) frequency of the pocket A scanned by dual probe (4MHz)
78
4.34 Experimental third Sound Part (Sa) frequency of the pocket A scanned by dual probe (4MHz)
78
4.35 The comparison of first Sound Part (Sa) frequency of pocket A
80
4.36 The comparison of second Sound Part (Sa) frequency of pocket A
NUMBER TITLE PAGE
4.37 The comparison of third Sound Part (Sa) frequency of pocket A
81
4.38 Actual Sound Part (Sa) for pocket A 82
4.39 Experimental first Sound Part (Sa) frequency of the pocket E scanned by single probe (4MHz)
82
4.40 Experimental second Sound Part (Sa) frequency of the pocket E scanned by single probe (4MHz)
83
4.41 Experimental first Sound Part (Sa) frequency of the pocket E scanned by dual probe (4MHz)
84
4.42 Experimental second Sound Part (Sa) frequency of the pocket E scanned by dual probe (4MHz)
85
4.43 The comparison of first Sound Part (Sa) frequency of pocket E
86
4.44 The comparison of second Sound Part (Sa) frequency of pocket E
87
4.45 Characteristics for the notch on the test 88
4.46 Variables and dimensions for the notch part on the test sample 89 4.47 Experimental Sound Part 1 (Sa1) frequency scanned by
45° angle probe (4MHz)
92
4.48 Experimental Sound Part 4 (Sa4) frequency scanned by
45° angle probe (4MHz)
93
4.49 Experimental maximum Sound Part (Samax) frequency
scanned by 45° angle probe (4MHz)
94
4.50 Experimental second value of Sound Part 4 (Sa4) frequency
scanned by 45° angle probe (4MHz)
95
4.51 Picture shows the distance 1 (d1) scanned by 45° angle
probe (4MHz)
96
4.52 Picture shows the distance 2 (d2) scanned by 45° angle
probe (4MHz)
NUMBER TITLE PAGE
4.53 Actual positioning of the pockets when transparently viewed from the backside of test sample
100
4.54 Actual positioning of the notch when transparently viewed from the backside of test sample
101
4.55 Position of the notch and dimensions around it 101 4.56 Points at the backside of test sample surface that been
marked during the scanned by using single probe (4MHz)
103
4.57 Transferred points on a plain paper 104
4.58 Interpreted view based on the points transferred 106 4.59 Points at the backside of test sample surface that been
marked during the scanned by using dual probe (4MHz)
107
4.60 Transferred points on a plain paper 108
4.61 Interpreted view based on the points transferred 110 4.62 Points at the backside of test sample surface that been
marked during the scanned by using 45° angle probe (4MHz)
111
4.63 Transferred points on a plain paper 112
4.64 Interpreted view based on the points transferred 113 A1 Application letter to use the CNC 5-Axiz Face Milling machine xix
A2 Theoretical calculation for the notch line xxii
B1 View of 5-Axis Face Milling Machine xxiv
B2 Monitor of 5-Axis Face Milling Machine xxiv
B3 Tools inside 5-Axis Face Milling Machine xxv
B4 Test sample as the specimen xxv
B5 Drawing by using Catia V5R16 xxvi
CHAPTER 1
INTRODUCTION
Non-Destructive Testing (NDT) is a versatile method of testing to detect the defect on the test sample without destroying it. There are so many types of defects can be detecting using NDT method. Defect or crack can be detected by using Ultrasonic Testing (UT) and it is required the correct selection of probe and the frequency. There are lots of Non-Destructive Testing (NDT) technique are applied in industries, such as Dye Penetrate Inspection, Magnetic Particle Inspection, Eddy Currents and Radiography. Most of those methods can only define several types of defect such as structural deformities, wall thinning and planar defects.
1.1 Background of the Project
sound waves are reflected at an interface between two materials such as steel and air to detect defects. A typical Ultrasonic Testing inspection system consists of several functional units, such as the pulser / receiver, probe, and display devices. A pulser / receiver are an electronic device that can produce high voltage electrical pulses. Driven by the pulser, the probe generates high frequency ultrasonic energy. The sound energy is introduced and propagates through the materials in the form of waves. When there is a discontinuity such as a crack in the wave path, part of the energy will be reflected back from the flaw surface [1]. The reflected wave signal is transformed into an electrical signal by the transducer and is displayed on a screen. The reflected signal strength is displayed versus the time from signal generation to when an echo was received. Signal travel time can be directly related to the distance that the signal traveled. From the signal, information about the reflector location, size, orientation and other features can be gained. Ultrasonic Testing results are greatly affected by probe type and probe frequency. There are three types of probe. Which are single crystal, dual crystal and angle beam probe. While frequency, the higher the probe frequency, the shorter the dead zone. By increasing the frequency, the solid angle of the beam will decrease.
1.2 Problem Statement
1.3 Objective
The main objective of this project is to investigate the effect of selection of Probe Type in Ultrasonic Testing. The suitability of different type of probe type in Ultrasonic Testing is specified. Hence it will lead to the effectiveness of using the correct selection of probes. Another objective is to fulfill the requirement final year student of Universiti Teknikal Malaysia Melaka (UTeM) to complete ‘Projek Sarjana Muda’ (PSM).
1.4 Scope
1.5 Planning and Execution
CHAPTER 2
LITERATURE REVIEW
2.1 Basic Principle of Ultrasonic Testing
Sound waves are simply vibrations of the particles making up a solid, liquid, or gas. As an energy form they are therefore an example of mechanical energy, and it follows that, since there must be something to vibrate, sound waves cannot exist in a vacuum. The only human sense that can detect sound waves is hearing, and that sense is restricted to a relatively narrow range of vibration frequencies called "the audible range". It follows that there will be vibration frequencies that are so low or so high that they cannot be detected by the human ear [1].
Ultrasonic waves are mechanical vibrations having the same characteristics as sound waves, but having a frequency so high that they cannot be detected by the human ear that is greater than about 20 kHz. For weld examination in metals the ultrasonic waves usually have a frequency in the range 500 kHz to 10 MHz, most applications using a frequency between 2 MHz and 5 MHz [3].
It is important to realize that ultrasonic waves are not electromagnetic radiation passing through the specimen, but are the result of induced particle vibration in the specimen, and are possible because of the elastic properties of the material of the specimen. For this reason, the wave velocity is different in different materials [3]. From the basic velocity law:
As the result, compressional waves the particles of the transmitting material move in the direction of waves can be transmitted in solid and liquids. The particle movement is very small, within the elastic limits of the material, so that there is no change in the specimen due to the ultrasonic energy.
Ultrasonic Processors consist of three major components that are an Ultrasonic Power Supply (generator), a Converter (transducer) and a Probe (horn). Additionally, a variety of accessories can be used to expand the capabilities of Ultrasonic Processors [4]. The ultrasonic processor can be observing in Figure 2.1 at the previous page.