SHORT REPORT
Report on the development of putative
functional SSR and SNP markers in passion fruits
Zirlane Portugal da Costa, Carla de Freitas Munhoz and Maria Lucia Carneiro Vieira
*Abstract
Background: Passionflowers Passiflora edulis and Passiflora alata are diploid, outcrossing and understudied fruit bearing species. In Brazil, passion fruit cultivation began relatively recently and has earned the country an outstanding position as the world’s top producer of passion fruit. The fruit’s main economic value lies in the production of juice, an essential exotic ingredient in juice blends. Currently, crop improvement strategies, including those for underexploited tropical species, tend to incorporate molecular genetic approaches. In this study, we examined a set of P. edulis tran‑ scripts expressed in response to infection by Xanthomonas axonopodis, (the passion fruit’s main bacterial pathogen that attacks the vines), aiming at the development of putative functional markers, i.e. SSRs (simple sequence repeats) and SNPs (single nucleotide polymorphisms).
Results: A total of 210 microsatellites were found in 998 sequences, and trinucleotide repeats were found to be the most frequent (31.4%). Of the sequences selected for designing primers, 80.9% could be used to develop SSR markers, and 60.6% SNP markers for P. alata. SNPs were all biallelic and found within 15 gene fragments of P. alata. Overall, gene fragments generated 10,003 bp. SNP frequency was estimated as one SNP every 294 bp. Polymorphism rates revealed by SSR and SNP loci were 29.4 and 53.6%, respectively.
Conclusions: Passiflora edulis transcripts were useful for the development of putative functional markers for P. alata, suggesting a certain level of sequence conservation between these cultivated species. The markers developed herein could be used for genetic mapping purposes and also in diversity studies.
Keywords: Passiflora, Passionflowers, Molecular polymorphism, Microsatellites, Single nucleotide polymorphisms, Pathogen induced transcripts
© The Author(s) 2017. This article is distributed under the terms of the Creative Commons Attribution 4.0 International License (http://creativecommons.org/licenses/by/4.0/), which permits unrestricted use, distribution, and reproduction in any medium, provided you give appropriate credit to the original author(s) and the source, provide a link to the Creative Commons license, and indicate if changes were made. The Creative Commons Public Domain Dedication waiver (http://creativecommons.org/ publicdomain/zero/1.0/) applies to the data made available in this article, unless otherwise stated.
Background
Several tropical fruit species are underexploited but have promising economic potential for both indus-trial processing and in natura consumption. In Brazil, passion fruit is widely cultivated and the most recent survey on agricultural production showed that approxi-mately 58,089 hectares were planted and 838,244 tons of fruit harvested [1]. Commercial plantations are almost exclusively based on a single species, the yellow pas-sion fruit (Passiflora edulis), which is cultivated in over 90% of orchards. It is grown for its edible and aromatic fruits used in juice concentrate blends that are consumed
worldwide. A second species, the sweet passion fruit (P. alata) is native to the Brazilian plateau and the eastern Amazonian region, but cultivated fairly widely only in the South and Southeast of Brazil, as reported in Cerqueira-Silva et al. [2]. It is fairly popular for its typical aroma and flavor characteristics, and therefore can fetch up to three times the price of the yellow passion fruit at local fresh fruit markets. Moreover, the vines of P. alata contain bioactive compounds [3] which have been widely used in a traditional medicine, and include a natural sedative, passiflorin.
Passiflora edulis and P. alata belong to the family Passi-floraceae, order Malpighiales. Both are self-incompatible [4, 5], diploid species (2n = 18) [6, 7] with perfect, insect-pollinated flowers. Despite the importance of P. edulis as a fruit crop, long-term breeding programs are still in the
Open Access
*Correspondence: mlcvieir@usp.br
early stages. On the other hand, the sweet passion fruit is gaining importance for its attractive flowers and exotic flavored fruits, but no commercial varieties are available to farmers. Furthermore, the incidence of diseases can inflict losses in plantations of both species. For instance, bacterial spot caused by Xanthomonas axonopodis pv. passiflorae (Xap) harms both leaves and fruits and has no effective chemical control [8]. It is therefore very difficult to manage.
Currently, plant research tends to incorporate molecu-lar marker-based approaches into conventional breed-ing programs, includbreed-ing programs for understudied tropical species. In particular, molecular markers derived from DNA sequences characterized as microsatellites or simple sequence repeats (SSRs), and single nucleotide polymorphism (SNPs) located in plant genes have been developed [9, 10] and used to reach the objectives [11, 12]. With this in mind, we used the transcripts from a subtractive library enriched for P. edulis genes expressed in response to Xap infection [13] to develop putative functional SSR and SNP markers for P. alata.
Methods
Origin of the DNA sequences
The aim of the study was to develop a set of functional markers for P. alata from P. edulis transcript sequences induced and repressed in response to Xap, based on two SSH (suppression subtractive hybridization) libraries previously constructed in our laboratory. The forward (F) library was enriched for cDNA fragments of genes whose expression level increased following bacterial inoculation. Conversely, in order to isolate cDNA fragments of genes whose expression level decreased following inoculation, a reverse subtraction (R) was carried out with cDNA from mock-inoculated plants used as ‘testers’ and cDNA from inoculated plants used as ‘drivers’ [14]. We were able to isolate 683 transcripts from the forward (F) library, 274 from the reverse (R) library, and 41 transcripts referred to contigs of sequences derived from both libraries [13], giving a total of 998 sequences that were used for devel-oping putative functional markers as described below.
Plant material and DNA isolation
Two accessions of P. alata and two of P. edulis were used to develop the SSR markers. These accessions were the respective parents of full-sib progenies used for map-ping purposes in our laboratory [15, 16]. P. alata acces-sion ‘2(12)’ belongs to a progeny of a wild ancestor that was collected in a locality between the Brazilian Amazon and Cerrado ecosystems [17]. P. alata accession ‘SV3’ is an indoor selection cultivated in the Southeast of Brazil. Both P. edulis accessions belong to the germplasm collec-tion of The Agronomic Institute of Parana State, Brazil.
‘IAPAR-123’ is a selection from the Brazilian commercial population used for industrialized juice production and ‘IAPAR-06’ was introduced from Morocco.
All plant genomic DNA was extracted from young leaf tissue using the cetyltrimethylammonium bromide method adapted from Murray and Thompson [18]. For DNA quantification, samples were electrophoresed in 1.2% agarose gels stained with SYBR SAFE® (Invitrogen, Carlsbad, CA, USA), with 1× TBE as the running buffer, and compared to known concentrations of λ phage DNA. The gels were visualized under UV light and photo doc-umented by a UVP MultiDoc-It digital imaging system. The original samples were diluted to 10 ng µ1−1.
After testing the ability of P. edulis SSR primer pairs to generate reproducible amplicons in P. alata, the loci that revealed polymorphisms between the ‘2(12)’ and ‘SV3’ accessions were used for genotyping 30 indi-viduals of the segregating progeny (F1). For developing
SNP markers, the same parental accessions of P. alata and two F1 genotypes (‘F1-67’ and ‘F1-100’) were used
for prospecting sequence polymorphisms as explained below.
Microsatellite prospection and development of SSR markers
MISA software [19] was used to search for microsatel-lites in both the F and R libraries cited above. The fol-lowing parameters were used to identify microsatellites: mono-, di-, tri-, tetra-, penta- and hexanucleotide repeats with a minimum of 10, 5, 3, 3, 3 and 3 subunits, respec-tively. SSRs were grouped according to motif, and each group included all the complementary and permuted sequences. SSR markers were developed from a set of genes selected from the F library [13].
Passiflora edulis selected transcripts containing SSRs were analyzed for primer designing. The PRIMER3 [20] and Gene Runner [21] computational programs were used. Next, amplification reactions were performed as follows: 30 ng genomic DNA, 1× PCR buffer, 0.25 mM dNTP, 0.3 µM of each primer, 2 mM MgCl2, and 1.2 U
For polymorphism evaluation, DNA samples were first denatured for 5 min at 95 °C and rapidly ice cooled. For each sample, 2.5 µl was loaded on a polyacrylamide gel (0.4 mm) and the products separated by denaturing electrophoresis. The electrophoresis was run in a verti-cal system (Sequi-Gen® GT Sequencing Cell, Bio-Rad, 38 × 50 cm gels). The gels contained 5% 19:1 acrylamide/ bisacrylamide, 7 M urea and 1× TBE, and were run at 80 W for 2 h 30 min at 45° C. The glass plate with the gel firmly adhered to it was rinsed thoroughly in order to stain the DNA bands with silver nitrate (0.2%). Ampli-cons were visualized after adding sodium carbonate according to Creste et al. [22]. The gels were then ana-lyzed under white light and digitized (Epson Expres-sion 10,000 XL). The genetic configuration at each SSR locus was analyzed as proposed by Wu et al. [23].
Development of SNP putative markers
A total of 122 transcript sequences from P. edulis were selected for designing the primers (Additional file 1: Table S2). Primer sequence designing, amplification reactions and cycling programs, as well as amplicon electrophore-sis were performed as described for SSR marker develop-ment. Amplifications using P. alata DNA that resulted in specific bands were purified using Illustra GFX 96 PCR Purification Kit® (GE Healthcare, Little Chalfont, BUX, UK). Concentrations of the purified products were esti-mated by spectrophotometry using a NanoDrop 2000® (Thermo Scientific, Waltham, MA, USA), and purifica-tion was checked by electrophoresis in 1.2% agarose gels stained with SYBR SAFE® (Invitrogen), with 1× TBE as the running buffer, and compared to phage λ DNA of known concentrations.
For sequencing reactions, the BigDye® Terminator v3.1 Cycle Sequencing Kit (Applied Biosystems, Carlsbad, CA, USA) was used. Each reaction contained 50 ng of purified PCR product, 2 µl of 5× buffer, 0.6 µl of BigDye Termina-tor v3.1, 1.0 µl of each primer (forward or reverse), and ultrapure water to make up to a total volume of 10 µl. The following cycling program was used: 1 min at 96 °C, fol-lowed by 25 cycles of 10 s at 96 °C, 5 s at 50 °C and 4 min at 60 °C. Capillary electrophoresis was run on an ABI 3730 DNA Analyzer® (Applied Biosytems).
We routinely sequenced the positive strand (forward) of each genotype DNA but occasionally the negative strand (reverse) was also sequenced. Sequence data were processed using the CodonCode Aligner® 3.7.1 (Codon-Code Corporation, Centerville, MA, USA), a base-call-ing software which assigns a quality phred-based score to each base [24]. Low quality bases (phred < 20) were trimmed. Sequences were then aligned with each other using the assemble function to identify polymorphisms. A single position in DNA sequences with a nucleotide variation was considered polymorphic. The parental genotypes and two F1 genotypes (F1-67 and F1-100) of P.
alata were compared.
Results and discussion
We identified 210 SSRs in 998 P. edulis transcript sequences (21.04%), including 22.4% mono-, 23.3% di-, and 31.4% trinucleotide repeats. The remaining 11.9, 4.8 and 6.2% were tetra-, penta- and hexanucleotides. The nucleotide composition of the repeat motifs showed that A/T (98%), AG/CT (67.3%) and AAG/CTT (25.7%) were the most abundant among the mono-, di- and tri-nucleotides (Fig. 1). In terms of microsatellites (SSRs),
Fig. 1 Percentage of mono‑, di‑, tri‑, tetra‑, penta‑ and hexanucleotides in the microsatellites found in transcribed sequences of Passiflora edulis
[image:3.595.55.537.518.698.2]95% were perfect, 2% interrupted, 3% imperfect and 1.5% compound.
These results are in line with other studies on Malpighi-ales species, such as Salix spp. and Ricinus communis, in which trinucleotide repeats were the most abundant class in expressed sequences [25, 26]. Some other studies have shown different results, such as those on Manihot escu-lenta [27]. The variation found in SSR frequency is plausi-ble based on the variation in sample size, search criteria, database size and tools used for the SSR development, as well as intrinsic differences between the species evalu-ated [28]. Trinucleotides and perfect microsatellites were expected to be predominant, since the SSRs examined were within coding sequences. In terms of nucleotide composition, our results are in line with those reported for Malpighiales, such as Populus euphratica [29] and Jatropha curcas [30].
In all, 41 out of 42 primer pairs designed from selected sequences of P. edulis resulted in amplification. Compared to P. alata, after optimizing PCR conditions, we were able to obtain good amplification patterns for most of the primer pairs (Fig. 2), revealing high transferability rates between P. edulis and P. alata of approximately 80.9% (34/42).
Silva et al. [31] investigated the transferability of 24 primer pairs developed for P. edulis and 7 for P. alata to wild species of Passiflora (P. cacao, P. cincinnata, P. glan-dulosa, P. gibertii, and P. mucronata). The interspecies cross-amplification rate varied, and the lowest was 14.4% between P. alata and P. cincinnata. Transferability from P. alata and P. edulis to P. cacao was the highest, at 28.5 and 62.5% respectively. In general, the transferability of SSR loci was successful.
Our study shows that genic SSR locus transferability between P. edulis and P. alata is high. In fact, P. edulis
and P. alata belong to the same subgenus (Passiflora), though to different botanical supersections (Passiflora and Laurifoliae respectively), and series (Passiflora and Quadrangulares, respectively). Interspecific hybrids of the two species are only 5% fertile [32].
As mentioned above, P. edulis and P. alata are self-incompatible species [4, 5] with an obligatory allogamous mode of reproduction, posing difficulties in the produc-tion of inbred lines, which are routinely used to generate hybrids that do not segregate. In the case of outcrossing species, which is enforced by self-incompatibility in P. edulis and P. alata, the F1 populations (or full-sib
prog-enies) do segregate [15, 16, 23]. Therefore, after testing the ability of P. edulis SSR primer pairs to generate repro-ducible amplicons in P. alata, the loci that revealed poly-morphisms between the parental accessions were used for genotyping individuals of the segregating progeny (F1)
as reported below.
Herein, the PCR fragments obtained using 34 primer pairs were separated in denaturing polyacrylamide gels and 10 fragments revealed 15 polymorphic loci in P. alata (Table 1). Loci Pa_F-P5B01, Pa_F + R-Contig114, Pa_F-Contig13 and Pa_F-P8E05 showed four alleles. According to Wu et al. [23], these are the most informative loci for generating a high-resolution map, which would require four alleles segregating in a 1:1:1:1 ratio in F1 (when both
parents are heterozygous for different alleles), and this configuration is possible only using SSR markers. For the remaining 6 loci, two alleles were identified (Table 1; Fig. 3).
It is worth noting that all SSRs developed herein are putative functional markers that can be deployed in future genetic studies. They are within gene sequences that encode for distinct proteins (Table 1) (Additional
[image:4.595.53.540.534.698.2]file 1: Tables S1, S3). This is the first report on the devel-opment of genic SSR markers for P. alata.
In terms of SNP prospection, 74 primer pairs com-plementary to sequences of P. edulis resulted in unique amplicons in P. alata after performing optimized PCR assays. As expected, a moderate transferability rate between the species was observed (~60%, 74/122).
We selected 37 out of the 74 transcripts to obtain the Sanger sequences of genotypes ‘2(12)’, ‘SV3’, ‘F1-67’ and
‘F1-100’. Comparing the nucleotides that were aligned
with each other, it was possible to detect at least one SNP in 15 gene sequences. SNPs were detected on the positive strand of 14 gene sequences in all genotypes, and only
one SNP was detected on the negative strand of the Pa_F-P5A12 gene sequence (Table 2). The absence of SNPs was observed in 13 gene sequences, but the remaining 9 gene sequences were of relatively low quality, ruling out any analysis.
Sequence lengths ranged from 332 to 872 bp, with an average of 625 bp. There were differences between the observed and expected lengths for all 15 gene sequences. Thirteen were longer than predicted and three shorter. We designed primer pairs based on P. edulis transcripts and used them to amplify P. alata genomic DNA.
A total of 34 SNPs were identified in the 15 putative gene sequences of P. alata. We then used BLASTN to Table 1 Genetic configuration of 10 SSR putative functional markers developed for Passiflora alata
a According to Wu et al. [22]
SSR marker code Primer sequences (5′–3′) Annealing
temperature (°C) Locus configurationa Observed segregation in the F 1 population (N = 30)a
Number of alleles
Pa_F‑P10A10 F:TGGAATGTGATTTGCATGG
R:TAGGTATTGCTGGCGAAG 55 1 (
oo×ao) 1:1 2
Pa_F‑P5B01 F:GCGATGAGTGTGCTAGAGG
R:TTCAGACAGCCGAGGAAG 55 1 (ab×cd) 1:1:1:1 4
Pa_F‑Contig77 F:AAGCCAAAGTCGGTGTTG
R:TAGCCCAGACAAGGAAGG 60 1 (2 (oooo××aoao)) 1:11:1 22 Pa_F + R‑Con‑
tig114 F:CTTGCCTCTCTCCCTCTCR:GGGTTTTGGGTTTGACAG 58 1 (a
o×bo) 1:1:1:1 4
Pa_F‑Contig13 F:CAGAAGGAAAACCAGCAAG
R:CCCCATCATCATCACTTTC 60 1 (ao×bo) 1:1:1:1 4
Pa_F‑Contig66 F:TCCCCCATTTTCTCTTCG
R:CGATTCCCGAACAAGTAAG 55 1 (ao×bo) 1:1 2
Pa_F‑P7E10 F:TTAATGCCACAGCCCAAC
R:TGACCCAAAATCAAACACC 55 1 (
oo×ao) 1:1 2
Pa_F‑P8E05 F:GGAAGCAAACACCAAAATC
R:TCGTCGTCATCGAACCTC 55 1 (ao×oo) 1:1:1:1 4
Pa_F + R‑Con‑
tig80 F:TGTTCAAGCCCATCTTCGR:GCTCTCGCTCTTGTCGTAG 55 1 (a2 (aoo××oooo)) 3 (oo×ao) 4 (oo×ao)
1:1 1:1 1:1 1:1
2 2 2 2 Pa_F‑P6H04 F:GAATAGGGTCAGCAGGAGG
R:GAGTGTGTCATCGGAGTCC 55 1 (
oo×ao)
2 (ao×oo) 1:11:1 22
Fig. 3 SSR locus (Pa_F‑P5B01) segregating in an F1 population of Passiflora alata (N = 30). Parental accessions [‘2(12)’ and ‘SV3’] are shown in the
[image:5.595.51.540.102.362.2] [image:5.595.60.540.567.688.2]compare our results with the cDNA sequences of P. edu-lis and identify the position of every SNP in the genes, and find out whether they were located within introns or exons (Table 2). The alignment results of the Pa_F-P8F01 gene sequence are shown in Fig. 4.
SNPs were evenly distributed over coding and noncod-ing regions (i.e. 50%). Of the 17 SNPs found in exons, 13 (76.4%, 13/17) led to a change in the amino acid encoded,
resulting in a 3.25:1 ratio (13/4) of non-silent to silent mutations. Five of the silent mutations were non-conservative, i.e. the nucleotide change resulted in the substitution of one amino acid for another with different properties that could impair protein function.
All nucleotide substitutions were biallelic. Transver-sions were slightly more common (53%, 18/34) than tran-sitions (47%, 16/34). Transition mutations are expected
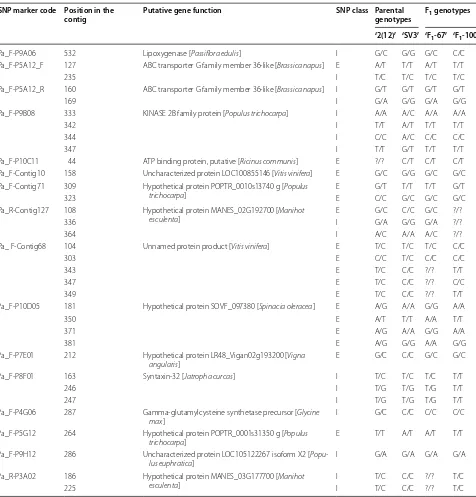
Table 2 SNPs found in Passiflora alata putative genes, their position in the contig, and the SNP class classified as intronic (I) and exonic (E)
SNP alleles were detected by evaluating the parental genotypes and two F1 genotypes
SNP marker code Position in the
contig Putative gene function SNP class Parental genotypes F1 genotypes
‘2(12)’ ‘SV3’ ‘F1-67’ ‘F1-100’
Pa_F‑P9A06 532 Lipoxygenase [Passiflora edulis] I G/C G/G G/C C/C Pa_F‑P5A12_F 127 ABC transporter G family member 36‑like [Brassica napus] E A/T T/T A/T T/T
235 I T/C T/C T/C T/C
Pa_F‑P5A12_R 160 ABC transporter G family member 36‑like [Brassica napus] I G/T G/T G/T G/T
169 I G/A G/G G/A G/G
Pa_F‑P9B08 333 KINASE 2B family protein [Populus trichocarpa] I A/A A/C A/A A/A
342 I T/T A/T T/T T/T
344 I C/C A/C C/C C/C
347 I T/T G/T T/T T/T
Pa_F‑P10C11 44 ATP binding protein, putative [Ricinus communis] E ?/? C/T C/T C/T Pa_F‑Contig10 158 Uncharacterized protein LOC100855146 [Vitis vinifera] E G/C G/G G/C G/C Pa_F‑Contig71 309 Hypothetical protein POPTR_0010s13740 g [Populus
trichocarpa] E G/T T/T T/T G/T
323 E C/C G/C G/C G/C
Pa_R‑Contig127 108 Hypothetical protein MANES_02G192700 [Manihot
esculenta] E G/C C/C G/C ?/?
336 I G/A G/G G/A ?/?
364 I A/C A/A A/C ?/?
Pa_ F‑Contig68 104 Unnamed protein product [Vitis vinifera] E T/C T/C T/C C/C
303 E C/C T/C C/C C/C
343 E T/C C/C ?/? T/T
347 E T/C C/C ?/? C/C
349 E T/C C/C ?/? T/T
Pa_F‑P10D05 181 Hypothetical protein SOVF_097380 [Spinacia oleracea] E A/G A/A G/G A/A
350 E A/T T/T A/A T/T
371 E A/G A/A G/G A/A
381 E A/G G/G A/A G/G
Pa_F‑P7E01 212 Hypothetical protein LR48_Vigan02g193200 [Vigna
angularis] E G/C C/C G/C G/C
Pa_F‑P8F01 163 Syntaxin‑32 [Jatropha curcas] I T/C T/C T/C T/T
246 I T/G T/G T/G T/T
247 I T/G T/G T/G T/T
Pa_F‑P4G06 287 Gamma‑glutamylcysteine synthetase precursor [Glycine
max] I G/C C/C C/C C/C
Pa_F‑P5G12 264 Hypothetical protein POPTR_0001s31350 g [Populus
trichocarpa] E T/T A/T A/T T/T
Pa_F‑P9H12 286 Uncharacterized protein LOC105122267 isoform X2 [
Popu-lus euphratica] I G/A G/A G/A G/A
Pa_R‑P3A02 186 Hypothetical protein MANES_03G177700 [Manihot
esculenta] I T/C C/C ?/? T/C
[image:6.595.60.536.219.716.2]to occur at higher frequencies than transversions. Fur-thermore, transitions are less likely to result in amino acid substitutions in protein sequences [33]. However, numbers can vary depending on sample size and selec-tive pressure on the genes under analysis. For exam-ple, in Manihot esculenta, 52.6% (26,030/49,429) of SNPs were found to occur in coding sequences, 51.4% (40,561/78,854) were transition mutations and 48.6% (39,293/78,854) transversions [34], while in Hevea bra-siliensis, 60% of SNPs (242,732/404,114) were transitions and 40% (161,382/404,114) transversions [35].
In P. alata, C/T and A/G transitions were predominant, with respective figures of 29.4% (10/34) and 17.6% (6/34).
G/C transversions were predominant, accounting for 17.6% (6/34) of total transversions. Similarly, other stud-ies have reported C/T or A/G as the most frequent tran-sition mutations [35, 36].
It was possible to assign a putative function to six gene sequences. The remaining sequences (9) were found to be similar to hypothetical proteins (Additional file 1: Table S3). It is worth noting that the Pa_F-P9A06 locus sequence matches that of a lipoxygenase family pro-tein (GenBank: ACS28586.1). Our group has recently reported that lipoxygenase 2 is highly implicated in P. edulis defense against X. axonopodis infection [13]. Simi-larly, the expression of the GhLOX2 gene was associated
[image:7.595.56.540.85.533.2]with the hypersensitivity response in cotton following inoculation with X. campestris pv. malvacearum [37]. It is therefore of interest to allocate the Pa_F-P9A06 locus to the linkage map of P. alata [16] as a beneficial com-plement to QTL (quantitative trait loci) mapping stud-ies already performed in the same population of P. alata [38].
Overall, the 16 gene fragments generated 10,003 bp, so SNP frequency was estimated as approximately one SNP for every 294 bp. This frequency is lower than that found in a previous study (one SNP for every 177 bp) analyzing 7 genes in ‘2(12)’ and ‘SV3’ P. alata accessions [16]. These differences can be ascribed to the distinct set of genes analyzed. However, the SNP frequencies found herein are low in comparison to other outcrossing species [39–41]. Interestingly, the frequency of SNPs in P. alata putative genes is closer to that found in coding regions of self-pol-linated species like Arabidopsis thaliana (1 SNP/336 bp) and rice (1 SNP/333 bp) [42, 43].
Finally, the polymorphism rates revealed by SSR and SNP loci were 29.4% (10/34) and 53.6% (15/28), respec-tively. The accessions did not contribute equally to poly-morphisms. The contribution of the wild ‘2(12)’ accession was greater than that of the selected ‘SV3’ accession. In general, the polymorphism rates revealed by SSR mark-ers were similar to those found in our previous studies using the same accessions of P. alata, with rates of 18% (308 AFLPs, amplified fragment length polymorphisms, and 20 SSR markers [44]), 20% (combination of 60 SSRs, 104 SNPs, 567 AFLPs, 12 TRAPs (target region amplifi-cation polymorphisms) and 23 RGAs (resistance gene analogs) [16]) and 35% (72 SSR markers [45]). Studying two distinct accessions of P. edulis, polymorphism rates were 26.4, 13.0 and 24.7% based on 113 RAPD (random amplified polymorphic DNA) [46], 174 AFLP [47] and 21 SSR loci [15], respectively. All these rates are considered low in view of the high levels of molecular polymorphism found in outcrossing species, like chicory (69,3%, based on 730 SSR markers [48]), cocoa (59%, based on 227 SSR markers [49]) and apple (50.5%, based on 338 SSR mark-ers [50]).
Conclusions
We were able to use gene sequences of Passiflora edulis to develop a set of genetic markers for P. alata, which can be used for genetic mapping purposes and also in diver-sity studies. A high to moderate level of transferability occurred between species (80.9% for SSR and 60.6% for SNP markers), providing tools for detecting polymor-phic loci. We have provided additional information on the abundance of SSRs and SNPs in gene sequences of P. alata, and also confirmed the occurrence of low levels of molecular polymorphism in this outcrossing species.
Abbreviations
AFLP: amplified fragment length polymorphism; QTL: quantitative trait loci; RAPD: random amplified polymorphic DNA; RGA: resistance gene analog; SNP: single nucleotide polymorphism; SSH: suppression subtractive hybridization; SSR: simple sequence repeats; TRAP: target region amplification polymor‑ phism; Xap: Xanthomonas axonopodis pv. passiflorae.
Authors’ contributions
ZPC carried out all laboratory assays and data analysis, and also drafted the manuscript. CFM participated in its design and provided experimental exper‑ tise related to molecular marker development. MLCV conceived the research idea and edited the final manuscript. All authors read and approved the final manuscript.
Acknowledgements
This work was supported by the following Brazilian institutions Fundação de Amparo à Pesquisa do Estado de São Paulo (FAPESP), and Conselho Nacional de Desenvolvimento Científico e Tecnológico (CNPq).
Competing interests
The authors declare that they have no competing interests.
Availability of data and materials
Sequence data supporting this report were submitted to GenBank (https:// www.ncbi.nlm.nih.gov/genbank/) and are available in the additional files with their corresponding GenBank accession numbers (Additional file 1).
Consent to publish Not applicable.
Ethics approval and consent to participate Not applicable.
Funding
ZPC and CFM received scholarships from CNPq (Conselho Nacional de Desen‑ volvimento Científico e Tecnológico, Brazil) and FAPESP (Fundação de Amparo à Pesquisado Estado de São Paulo, Brazil), respectively. This study is part of a research project granted by FAPESP.
Publisher’s Note
Springer Nature remains neutral with regard to jurisdictional claims in pub‑ lished maps and institutional affiliations.
Received: 10 December 2016 Accepted: 31 August 2017
References
1. IBGE. Produção Agrícola Municipal: culturas temporárias e permanentes. Rio de Janeiro; 2013.
2. Cerqueira‑Silva C, Jesus O, Santos E, Corrêa R, Souza A. Genetic breed‑ ing and diversity of the genus Passiflora: progress and perspectives in molecular and genetic studies. Int J Mol Sci. 2014;15:14122–52. 3. Ingale AG, Hivrale AU. Pharmacological studies of Passiflora spp. and their
bioactive compounds. African. J Plant Sci. 2010;4:417–26. 4. Bruckner CH, Casali VWD, de Moraes CF, Regazzi AJ, da Silva EAM.
Self‑incompatibility in passion fruit (Passiflora edulis Sims). Acta Hortic. 1993;69:45–58.
Additional file
5. do Rêgo MMR. Bruckner CH, da Silva EAM, Finger FL, de Siqueira DL, Fernandes AA. Self‑incompatibility in passion fruit: evidence of two locus genetic control. Theor Appl Genet. 1999;98:564–8.
6. Souza MM, Santana Pereira TN, Carneiro Vieira ML. Cytogenetic studies in some species of Passiflora L. (Passifloraceae): a review emphasizing Brazil‑ ian species. Braz Arch Biol Technol. 2008;51:247–58.
7. Melo NF, Cervi AC, Guerra M. Karyology and cytotaxonomy of the genus
Passiflora L. (Passifloraceae). Plant Syst Evol. 2001;226:69–84.
8. Amorim L, Rezende JAM, Filho AB, Camargo LEA. Manual de fitopatologia. Vol. 2. Doenças das plantas cultivadas. Agronômica Ceres. 2016. 9. Backiyarani S, Uma S, Varatharj P, Saraswathi MS. Mining of EST‑SSR mark‑
ers of Musa and their transferability studies among the members of order the Zingiberales. Appl Biochem Biotechnol. 2013;169:228–38.
10. Chagné D, Gasic K, Crowhurst RN, Han Y, Bassett HC, Bowatte DR, et al. Development of a set of SNP markers present in expressed genes of the apple. Genomics. 2008;92:353–8.
11. Goutam U, Kukreja S, Yadav R, Salaria N, Thakur K, Goyal AK. Recent trends and perspectives of molecular markers against fungal diseases in wheat. Front Microbiol. 2015;6:861.
12. Vieira MLC, Santini L, Diniz AL, de Munhoz C. Microsatellite markers: what they mean and why they are so useful. Genet Mol Biol. 2016;39:312–28. 13. Munhoz CF, Santos AA, Arenhart RA, Santini L, Monteiro‑Vitorello CB,
Vieira MLC. Analysis of plant gene expression during passion fruit‑ Xan-thomonas axonopodis interaction implicates lipoxygenase 2 in host defence. Ann Appl Biol. 2015;167:135–55.
14. Diatchenko L, Lau YF, Campbell AP, Chenchik A, Moqadam F, Huang B, et al. Suppression subtractive hybridization: a method for generating differentially regulated or tissue‑specific cDNA probes and libraries. Proc Natl Acad Sci. 1996;93:6025–30.
15. Oliveira EJ, Vieira MLC, Garcia AAF, Munhoz CF, Margarido GRA, Consoli L, et al. An integrated molecular map of yellow passion fruit based on simultaneous maximum‑likelihood estimation of linkage and linkage phases. J Am Soc Hortic Sci. 2008;133:35–41.
16. Pereira GS, Nunes ES, Laperuta LDC, Braga MF, Penha HA, Diniz L, et al. Molecular polymorphism and linkage analysis in sweet passion fruit, an outcrossing species. Ann Appl Biol. 2013;162:347–61.
17. Ferreira TG, Penha HA, Zucchi MI, Santos AA, Hanai LR, Junqueira N, et al. Outcrossing rate in sweet passion fruit based on molecular markers. Plant Breed. 2010;129:727–30.
18. Murray MG, Thompson WF. Rapid isolation of high molecular weight plant DNA. Nucleic Acids Res. 1980;8:4321–5.
19. Thiel T, Michalek W, Varshney RK, Graner A. Exploiting EST databases for the development and characterization of gene‑derived SSR‑markers in barley (Hordeum vulgare L.). Theor Appl Genet. 2003;106:411–22. 20. Rozen S, Skaletsky H. Primer3 on the WWW for general users and for
biologist programmers. Methods Mol Biol. 1999;132:365–86. 21. Spruyt M, Buquicchio F. Gene runner for windows. 1994. http://www.
generunner.net/. Accessed 17 Sept 2012.
22. Creste S, Neto AT, Figueira A. Detection of single sequence repeat polymorphisms in denaturing polyacrylamide sequencing gels by silver staining. Plant Mol Biol Rep. 2001;19:299–306.
23. Wu R, Ma C‑X, Painter I, Zeng Z‑B. Simultaneous maximum likelihood estimation of linkage and linkage phases in outcrossing species. Theor Popul Biol. 2002;61:349–63.
24. Ewing B, Hillier L, Wendl M, Green P. Base‑calling of automated sequencer traces using Phred. I. Accuracy assessment. Genome Res. 1998;8:175–85. 25. He X, Zheng J, Zhou J, He K. Characterization and comparison of EST‑SSRs
in Salix, Populus, and Eucalyptus. Tree Genet Genomes. 2015;11:820. 26. Qiu L, Yang C, Tian B, Yang J, Liu A. Exploiting EST databases for the devel‑
opment and characterization of EST‑SSR markers in castor bean (Ricinus communis L.). BMC Plant Biol. 2010;10:278.
27. Raji AAJ, Anderson JV, Kolade OA, Ugwu CD, Dixon AGO, Ingelbrecht IL. Gene‑based microsatellites for cassava (Manihot esculenta Crantz): prevalence, polymorphisms, and cross‑taxa utility. BMC Plant Biol. 2009;11:1–11.
28. Kumari K, Muthamilarasan M, Misra G, Gupta S, Subramanian A, Parida SK, et al. Development of eSSR‑Markers in Setaria italica and their applicability in studying genetic diversity, cross‑transferability and comparative mapping in millet and non‑millet species. PLoS ONE. 2013;8(6):e67742.
29. Du FK, Xu F, Qu H, Feng S, Tang J, Wu R. Exploiting the transcriptome of euphrates poplar, Populus euphratica (Salicaceae) to develop and char‑ acterize new EST‑SSR markers and construct an EST‑ SSR database. PLoS ONE. 2013;8(4):e61337.
30. Yadav HK, Ranjan A. EST‑derived SSR markers in Jatropha curcas L.: devel‑ opment, characterization, polymorphism, and transferability across the species/genera. Tree Genet Genomes. 2011;7:207–19.
31. Silva MAA, Souza MM, Silva GS, Melo CAF, Corrêa RX. Analysis of transferability of microsatellite primers (SSR) in wild Passiflora species and intraspecific genetic diversity in Passiflora alata. Genet Mol Res. 2014;13:5908–18.
32. Ocampo J, Arias JC, Urrea R. Interspecific hybridization between cultivated and wild species of genus Passiflora L. Euphytica. 2016;209:395–408.
33. Allegre M, Argout X, Boccara M, Fouet O, Roguet Y, Berard A, et al. Discov‑ ery and mapping of a new expressed sequence tag‑single nucleotide polymorphism and simple sequence repeat panel for large‑scale genetic studies and breeding of Theobroma cacao L. DNA Res. 2012;19:23–35. 34. Soto JC, Ortiz JF, Perlaza‑Jiménez L, Vásquez AX, Lopez‑lavalle LAB,
Mathew B, et al. A genetic map of cassava (Manihot esculenta Crantz) with integrated physical mapping of immunity‑related genes. BMC Genom. 2015;16:1397.
35. Mantello CC, Cardoso‑silva CB, Cristina C, Junior S, Gonc PDS, Vicentini R, et al. De novo assembly and transcriptome analysis of the rubber tree (Hevea brasiliensis) and SNP markers development for rubber biosynthesis pathways. PLoS ONE. 2014;9(7):e102665.
36. Pootakham W, Shearman JR, Ruang‑areerate P. Large‑scale SNP discovery through RNA sequencing and SNP genotyping by targeted enrich‑ ment sequencing in cassava (Manihot esculenta Crantz). PLoS ONE. 2014;9(12):e116028.
37. Sanier C, Sayegh‑Alhamdia M, Jalloul A, Clerivet A, Nicole M, Marmey P. A 13‑lipoxygenase is expressed early in the hypersensitive reaction of cot‑ ton plants to Xanthomonas campestris pv. malvacearum. J Phytopathol. 2012;160:286–93.
38. da Silva Pereira G, Di Cassia Laperuta L, Nunes ES, Chavarría L, Pastina MM, Gazaffi R, et al. The sweet passion fruit (Passiflora alata) crop: genetic and phenotypic parameter estimates and QTL mapping for fruit traits. Trop Plant Biol. 2017;10(1):18–29.
39. Ching A, Caldwell KS, Jung M, Dolan M, Smith OSH, Tingey S, et al. SNP frequency, haplotype structure and linkage disequilibrium in elite maize inbred lines. BMC Genet. 2002;3:19.
40. Hendre PS, Kamalakannan R, Varghese M. High‑throughput and parallel SNP discovery in selected candidate genes in Eucalyptus camaldulensis
using Illumina NGS platform. Plant Biotechnol J. 2012;10:646–56. 41. Schneider K, Kulosa D, Soerensen TR, Möhring S, Heine M, Durstewitz
G, et al. Analysis of DNA polymorphisms in sugar beet (Beta vulgaris L.) and development of an SNP‑based map of expressed genes. Theor Appl Genet. 2007;115:601–15.
42. Schmid KJ, Sörensen TR, Stracke R, Törjék O, Altmann T, Mitchell‑Olds T, et al. Large‑scale identification and analysis of genome‑wide single‑ nucleotide polymorphisms for mapping in Arabidopsis thaliana. Genome Res. 2003;13:1250–7.
43. Yu J, Wang J, Lin W, Li S, Li H, Zhou J, et al. The genomes of Oryza sativa: a history of duplications. PLoS Biol. 2005;3(2):e38.
44. Nunes ES. Caracterização fenotípica e molecular de uma população F1 de maracujá‑ doce visando à construção de mapas de ligação e identificação de QTL. Piracicaba: Esc. Super. Agric. “Luiz Queiroz”, Univ. São Paulo; 2010. 45. Penha HA, Pereira GS, Zucchi M, Diniz A, Vieira MLC. Development of
microsatellite markers in sweet passion fruit, and identification of length and conformation polymorphisms within repeat sequences. Plant Breed. 2013;132:731–5.
46. Carneiro MS, Camargo LEA, Coelho ASG, Vencovsky R, Rui PLJ, Stenzel NMC, et al. RAPD‑based genetic linkage maps of yellow passion fruit ( Pas-siflora edulis Sims. f. flavicarpa Deg.). Genome. 2002;45:670–8.
47. Lopes R, Lopes MTG, Carneiro MS, Matta FDP, Camargo LEA, Vieira MLC. Linkage and mapping of resistance genes to Xanthomonas axonopodis
pv. passiflorae in yellow passion fruit. Genome. 2006;49:17–29. 48. Cadalen T, Mörchen M, Blassiau C, Clabaut A, Scheer I, Hilbert J‑L, et al.
• We accept pre-submission inquiries
• Our selector tool helps you to find the most relevant journal • We provide round the clock customer support
• Convenient online submission • Thorough peer review
• Inclusion in PubMed and all major indexing services • Maximum visibility for your research
Submit your manuscript at www.biomedcentral.com/submit
Submit your next manuscript to BioMed Central
and we will help you at every step:
49. Pugh T, Fouet O, Risterucci AM, Brottier P, Abouladze M, Deletrez C, et al. A new cacao linkage map based on codominant markers: development and integration of 201 new microsatellite markers. Theor Appl Genet. 2004;108:1151–61.
50. Celton J‑M, Tustin DS, Chagné D, Gardiner SE. Construction of a dense genetic linkage map for apple rootstocks using SSRs developed from