Have We Even Solved the First 'Big Data Challenge?': Practical Issues Concerning Data Collection and Visual Representation for Social Media Analytics
Phillip Brooker (University of Bath), Julie Barnett (University of Bath), Timothy Cribbin (Brunel University) and Sanjay Sharma (Brunel University)
Abstract
The present chapter explores the technical and computational processes through which social media data is shaped into research findings. The authors make this argument by depicting the effects of two practical issues - API rate limiting in Twitter data collection and the use of spatial mapping algorithms in visualising those data - on resulting analyses. Such issues are not problematic to social media analytic research; rather, they can be used asresourcesfor helping to characterise and understand the data at hand. Hence, the authors work to demonstrate the value in incorporating these reflexive analyses of technical and computational processes into our accounts; to advocate thinking in assemblages as a requirement for making analytic claims with 'big' social media data.
Introduction
Thanks to an influx of data collection and analytic software, harvesting and visualising 'big' social media data is becoming increasingly feasible as a method for social science researchers. Yet whilst there is an emerging body of work utilising social media as a data resource, there are a number of computational issues affecting data collection. These issues may problematise any conclusions we draw from our research work, yet for the large part, they remain hidden from the researcher's view. We contribute towards the burgeoning literature which critically addresses various fundamental concerns with Big Data (see boyd and Crawford, 2012; Murthy, 2013; and Rogers, 2013). However, rather than focus on epistemological, political or theoretical issues – these areas are very ably accounted for by the authors listed above, and others – we engage with a different concern: how technical aspects of computational tools for capturing and handling social media data may impact our readings of it. This chapter outlines and explores two such technical issues as they occur for data taken from Twitter.
Throughout the chapter, we demonstrate a perspective consistent with Procter et al.'s (2013) view that social researchers wishing to make sense of 'big' social media data should have sufficient knowledge of the underlying concepts of the computational methods and tools they are using, so as to be able to decide when and where to appropriately apply them. Furthermore, we take heed of boyd and Crawford's suggestion that 'When researchers approach a data set, they need to understand – and publicly account for – not only the limits of the data set, but also the limits of which questions they can ask of a data set and what interpretations are appropriate' (2012: 669-70). To this end, we highlight how certain technical characteristics and constraints pertaining to the collection and processing of Twitter data can impact on research and how an understanding of these factors might lead to more robust accounts of such data.
understanding the effects that technical processes may have on our readings of data for all social scientists, not just for those with a background in computer science. Without this understanding it is impossible to make sense of the data at hand. Hence, we promote the idea of thinking of the investigative process as an 'assemblage' (Langlois, 2011; Sharma, 2013) that draws together various social and technical (and other) factors into a unified research process. Here, we refer to the ways in which the research process comes to feature not only conceptual theoretical knowledge and inductive empirical findings, but also how technical issues (such as API rate limiting and spatial mapping algorithms) contribute towards the production of knowledge in multifarious complex ways. How such an assemblage might operate will become clearer as we present our selected two technical issues, and in the discussion that follows.
Reviewing the Field
The State of Social Media Analytics
With the field of social media analytics still in relative infancy there are few methodological practices taken as standard. The tendency thus far has been to fit digital data to existing 'offline' ways of working. As O'Connoret al. note:
Often the online researcher has little in the way of research precedent to use as a guide to practice online research and, as a result, online researchers frequently turn to established offline practices (O'Connoret al., 2008: 276).
Working from this position, several authors characterise social media data as a special kind of 'offline' social science data. For example, Hine argues that a key concern of social media analytics is to avoid a loss of quality in data; 'Face-to-face interaction here becomes the gold standard against which the performance of computer-mediated interaction is judged' (Hine, 2006: 4). This quality problem of social media data is a concern shared by many, with comments being levelled at 'the lack of uniformity in how users fill in forms, fields, boxes and other text entry spaces' (Rogers, 2013: 205); the representativeness and validity of the data more generally (Tufekci, 2014); and the fact that the production of data is not controlled and led by researchers but appears untamed 'in the wild' (Kitchin, 2013). Kitchin notes:
The challenge of analysing Big Data is coping with abundance, exhaustivity and variety, timeliness and dynamism, messiness and uncertainty, high relationality, and the fact that much of what is generated has no specific question in mind or is a by-product of another activity (Kitchin, 2014: 2).
For many...the digital humanities is fostering weak, surface analysis, rather than deep, penetrating insight. It is overly reductionist and crude in its techniques, sacrificing complexity, specificity, context, depth and critique for scale, breadth, automation, descriptive patterns and the impression that interpretation does not require deep contextual knowledge. (Kitchin, 2014: 8)
Yet we do not believe this isnecessarilyhow social media analytics has to operate. On the contrary, we advocate a mode of reading data that allows computational methods to pick out areas of potential interest which then might be explored more intimately through closer readings. To do this requires an understanding of how social media data can be affected by technical processes as part of a wider assemblage. As Lewiset al.note, 'As scholars increasingly take up such datasets, they may be better served by interweaving computational and manual approaches throughout the overall process in order to maximise the precision of algorithms and the context-sensitive evaluations of human coders' (2013: 49). By outlining how this kind of research process works 'on the shop floor', we hope to foster a way of thinking about such technical issues which might facilitate the mainstream usage of digital research methods generally.
We take steps towards respecifying 'big' social media work in this way by concentrating on two issues. Firstly we demonstrate the effects of a data collection issue – the rate limiting of Twitter's Application Programming Interfaces (APIs), which is a built-in restriction on the flow of Twitter data that may interfere with analyses in significant ways. Secondly, we remark upon the ways in which computational models (and the visualisations that represent them) might shape our analytic readings of data. Those already working in the field are well aware of these concerns, yet they do not routinely feature in published accounts of relevant work. Consequently, such issues may stand as a barrier to entry by steepening an already steep learning curve. Hence, we openly discuss two such issues, not necessarily as problematic to social media analytics but as presenting an opportunity to make better use of new and powerful data resources.
Addressing the First 'Big Data Challenge'
But why is it important to render transparent what might be argued to be mundane computational issues? Doing social media analytics with Twitter data necessitates an interfacing with the mechanisms governing how users access Twitter data: the Twitter Application Programming Interfaces (APIs). These APIs allow users to request to access certain slices of Twitter data, according to various search strategies (i.e. by keyword, by bibliographic/demographic information, by random selection, and so on). Moreover, once investigators have personal copies of these data, they may then subject them to further algorithmic processes to make their 'Big Data' analysable, e.g. in the rendering of statistical information or in the production of visualisations and so on. In this way, computational processes come to feature as essential elements in the production and construction of our data and analyses. As Marres notes, this bringing together of different disciplinary ideas can be equally productive and constricting:
[Digital] social research isnoticeablymarked by informational practices and devices not of its own making, from the analytic measures built into online platforms (e.g. the number of links, number of mentionings, follower counts), to the visual forms embedded in visualization modules (the tag cloud). Online social research is visibly a distributed accomplishment (Marres, 2012: 160).
This intertwining of technical issues and research methods is foregrounded for the social sciences by Fielding and Lee, who argue that 'Social science has demonstrated how technology both shapes and is shaped by social action. Research methods are no exception' (2008: 505). As such, since there are computational processes governing data collection and analysis, we may find ourselves better-armed to undertake research in the area if we understand some of the finer points about how these tools and processes work.How exactlydo they restrict the data we can harvest? Andhow exactlydo they shape the statistics and visualisations and other analytic outputs which we use to understand that data?
To this end, we now turn to a more pointed examination of two such issues – the possible effects of API rate limiting on data collected through Twitter, and the possible effects of spatial mapping algorithms on data visualisations – as they occur through the usage of a bespoke social media analytics software suite, Chorus. This serves to demonstrate the kinds of issues investigators may find themselves contending with, as well as helping figure out ways of handling them methodologically. Our reflexive focus on the research process itself is very much a mainstream methodological practice of social scientists – we seek to take a self-critical view on the (opaque) process of undertaking research involving data collection through the Twitter APIs and data visualisation using spatial mapping algorithms. However, our approach sees such limitations not as obstaclesto research to be overcome. Rather, we discuss these issues as an exercise in learning the tools of the trade of social media analytics and understanding how they construct the data we analyse, so as to be better able to deal with them as part of our work.
Two Practical Issues
API Rate Limiting in Twitter Data Collection
data. This process of using Twitter's APIs to access data necessitates that users write requests as a RESTful statement to return responses in a data interchange format called JSON, or that users take advantage of a third-party client which facilitates the task for non-coders. However, though comprehensive collections of data are available for purchase through data archiving services such as Gnip or DataSift, the Twitter APIs are not completely openly available to users and developers. In fact, several restrictions on their usage are in place; ostensibly this is to prevent misuse of the service by individual users. One such restriction is Twitter's 'rate limiting' of an individual account's API usage, or the rate at which a user can poll the API with requests for data matching a search query. Each API has different rate limits and different software tools will handle those limits in different ways. Providing concrete and quantifiable definitions of these limits is, however, a hopeless task. The ‘Search API’ (that our example below draws upon) is fairly well-documented in terms of its limits, as we go on to discuss. However, the usage restrictions of all Twitter APIs are variably dependent on contextual information; chiefly the volume of data any queries will yield. Hence, for APIs other than Search, Twitter does not provide information as to the exact limits they will impose. All of this makes understanding and navigating through the Twitter APIs a labyrinthine process. We use data collected via the Search API – which handles data based on keywords appearing in tweets and is the most commonly-used Twitter API – to demonstrate how the API itself inevitably comes to feature in a burgeoning assemblage built up by the research as it is undertaken.
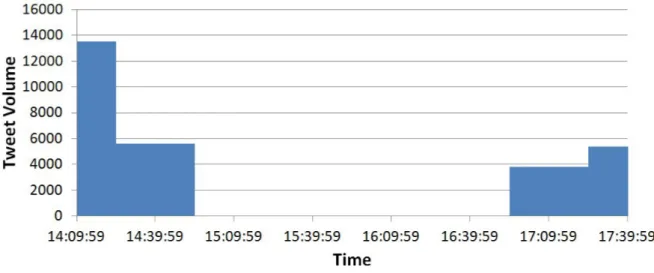
At the time of writing, Twitter's Search API allows Chorus' data collection programme, TweetCatcher Desktop (TCD), to make 450 requests every fifteen minutes. Each such request has the potential to capture a maximum of 100 tweets. The Search API allows users to retrieve historical data up to seven days prior to the initial request. On 23 July 2014, using TCD we ran a very general search query for all usages of the term 'black', as a way of exploring the topics and sub-topics of racialised tweet content. To capture the data, we refreshed the query at various points over an approximately four-hour period so as to ensure as comprehensive a dataset as the API would allow. This resulted in a dataset of 28,317 tweets featuring the term 'black'. Plotting the data over time in half-hour intervals within Chorus' visual analytic programme TweetVis, it was clear that there were gaps in the chronology of the conversation:
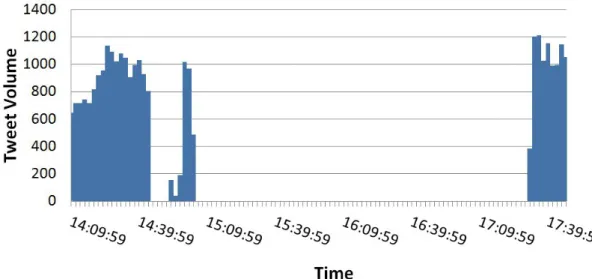
What we see in Figure 1 is a striking reminder that Twitter's APIs are restricted, and that this may have significant effects on the data we wish to capture through them. For high-volume queries it is easy to come up against Twitter's API rate limits, such as during searches for general terms like 'black', as well as for trending terms (e.g. 'Obama' in the run-up to the 2012 US presidential election). In this example, we were simply unable to keep up with the pace of peoples' tweets; we were able to capture an average 118 tweets-per-minute over the four hour period, whereas the actual conversation skipped along between 450-550 tweets per minute. Naturally, this left a sizeable chunk of data missing from our dataset (see Figure 1). However, what is less immediately obvious in this rendering of the data are the presence of other breaks in the flow of the conversation we captured, which become more apparent when viewing at a finer level of granularity:
Figure 2: Chart to show volume of tweets mentioning “black” across time (two minute intervals)
In Figure 2, we see the same data grouped into intervals of two minutes. Here we can identify the same gap in the data as in Figure 1, but also an earlier gap which was previously obscured when viewed with our earlier half-hour intervals. Hence, we now can detect a probable disruption to the flow of data between 14:44:59 and 14:58:59 where only a consistent chronology was visible (or at least presumed) before. It may simply be that people tweeted fewer times during these minutes, though it is equally possible that it is at this point we were reaching the limits of what the API would allow us to see. It is in fact impossible to figure out what has happened from the data or visualisations themselves.
What does this ambiguity mean for social media analytics and social research involving Twitter data? A key insight to draw from this demonstration is that comprehensive collections of Twitter data are not freely available to researchers. Even where we may assume we are capturing the entirety of a conversation, drilling down into finer levels of granularity may show us otherwise. Furthermore, failing to recognise when these rate limiting issues have occurred may be detrimental to the analyses we draw from our data. Without due care and attention, we may find ourselves using falsely-derived conceptualisations of data as chronologically consistent.
complete: incompleteness and unrepresentativeness are fundamental features purposefully built into the APIs to protect the primacy of Twitter's approved data providers. Recognising, understanding and accounting for this is a key step in acknowledging the research process as an unfurling assemblage of interconnected socio-technical entities (of which the API is one, alongside any software and hardware used in the undertaking of the work, the social media users whose posts make up the data, any social theories we use to interpret the resulting findings, and so on). However, the incompleteness and unrepresentativeness of social media data does not prevent us from accessing meaningful insights. It is worth questioning our fetishising of data in this respect – what do we need a chronologically complete datasetfor? And what can we do without one? Rather than bemoan the purposes for what our data cannot be used, it may be more productive to explore what it cando. Though the methodological and analytic possibilities are impossible to encapsulate fully in the present chapter (in that they will depend largely on the questions being addressed), one such approach is advanced in the following section. However, the salient point remains that perhaps the best way to make sense of data is to attain a deep understanding of how a dataset has been constructed, and use that understanding as a resource for designing appropriate analytic approaches with which it may be dealt.
Spatial Mapping Algorithms in Twitter Data Visualisation
Clearly there are issues concerning data collection of which researchers in social media analytics would do well to be aware. However, our endeavours in the field have also revealed similar technical issues in data visualization, where collected data is given an analytic relevance through algorithmic processing. There are already multitudinous tools for visualising social media data – Gephi, NodeXL and Chorus for instance. Some of these utilise spatial mapping algorithms – computational processes through which entities such as individual words or connected arrays of tweeters (or indeed any other kind of 'node') are located on a 2D visual plane in relation to each other. Though each software package operates uniquely, a unifying feature of these algorithms is their use of mathematical reasoning as a way of representing distinctions between nodes. For example, the Chorus visual analytic suite – TweetVis – features (amongst other visualisations) a topical 'cluster map' which uses a spatial mapping algorithm to plot individual words contained within tweets, in regards to the frequency of co-occurrences words have with other words in the dataset. In this map, words which commonly co-occur in tweets cluster together, thereby forming distinct topical clusters through which users can navigate and explore. Here, the algorithm is what constructs and constrains the map, and for users trying to read the visualisation, the constructions and constraints of the map become an integral part of the resulting analysis. We demonstrate the possible effects of this algorithmic constructing and constraining on analyses, showing how an understanding of the technical goings-on of a data visualisation is a necessary requirement for those wishing to view it sensibly through the lens of an assemblage.
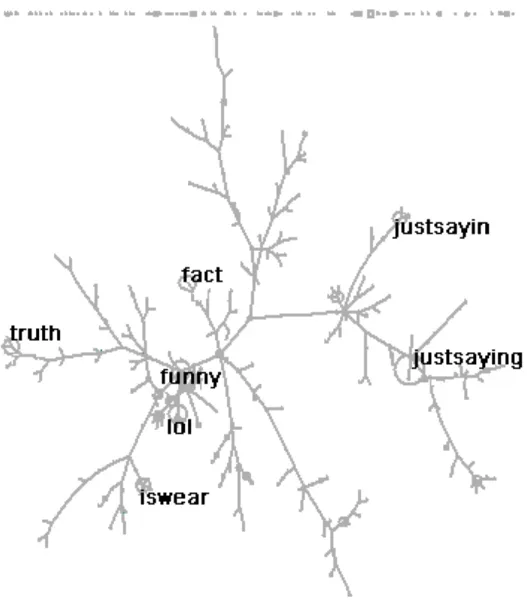
Figure 3 - hashtag map of#notracist(labels given to hashtags featuring in =>1% of tweets)
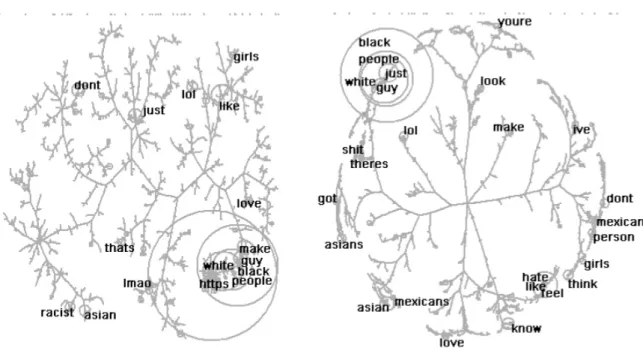
Figure 4 - 'Comedy' term map (left) and 'truth' term map (right) (labels given to terms featuring in =>4% of tweets)
It is clear that these two visualisations are very different from one another – the 'comedy' map is a messy aggregation of highly interconnected terms, whereas terms in the 'truth' map are densely populated around the outer fringes of connecting branches. In order to interpret what the two contrasting maps were telling us, we relied on an understanding of what the algorithm had done with the data points. For the 'comedy' map, the terms used in tweets were highly related to each other showing that#notracist comedy was a practice of tweeting done with lots of different terms and hashtags being used in similar ways (i.e. there are a number of 'stock' formats through which tweeters could accountably claim to be 'doing a joke'). However, for the 'truth' map, our understanding of what we could see in the visualisation relied upon an understanding of the functions of Chorus' spatial mapping algorithms. In this map, terms are chiefly located on the outer edges, as far apart from each other as the algorithm will allow. This is demonstrated by the tree-like appearances of topical branches, with virtually no connecting terms in the centre but a high density of terms pushed out towards the edges of the 2D plane. This visible pushing of the boundaries of the algorithm tells us a lot about the data we were working with. The terms used in the 'truth' tweets we identified are typically disconnected from each other and not used together, and we can begin to characterise #notracist 'truth' tweets as evidence of a topic that is not implicitly agreed-upon and which reflects a diverse array of strategies for justifying a#notracistclaim as a statement.
pushing the Chorus cluster map algorithm to its limits, and consequently use that information as a way of figuring out what the 'truth' conversation was about. Crucially, the fact of our data being processed through the algorithm in a certain way is precisely what helped us get to grips with what lay at the heart of that data. Without this we would have been lost. Consequently we reiterate that these intrusions of computational, technical and mathematical processes into our analyses is not something to be resisted. Rather, they are necessary and productive elements of social media analytics without which we would be unable to characterise the assemblage through which the analysis had been shaped, and ultimately, unable to make adequate sense of the data at hand.
Concluding Remarks
In this chapter, we have outlined how social media analytics incorporates data collection and analytic work in ways which are thoroughly reliant on computational and technical processes. Despite the provocative nature in which the question in the title of this piece was posed, we believe investigators in the field are in a position to sensibly account for their work in terms of these processes. Yet these issues are not something we have seen discussed explicitly in the accounts produced thus far. Hence, though our points may be frustratingly mundane to our peers (who may question why researchers would want to write about the inner workings of APIs and algorithms) we nonetheless think it valuable to discuss such things transparently as a means of promoting healthy and robust methodologies for the emerging field.
To that end, rather than depict software tools in general and in abstract, we have exemplified our ideas with reference to two specific issues arising out of the use of just one software package. This, we hope, gives a flavour of the kinds ofissues of which researchers must be aware when working with digital data and associated software tools. It is our hope that our accounts of two specific examples can demonstrate just how these kinds of issues intersect with research work in a very direct way. Working in this way, we have shown how technical and computational processes become a 'necessary evil' of the work. Only there is nothing 'evil' about them. Rather, these same processes can be used as resources for conducting (and figuring out how to conduct) analytic work in appropriate ways. However, the use of these processes as analytic resources relies on our having a deep understanding of what they are doing with our data, else we risk wrong-footing our analyses before we even begin. As Manovich notes:
...you must have the right background to make use of this data. The [analytic] software itself is free and readily available...but you need the right training...and prior practical experience to get meaningful results (Manovich, 2012: 472).
It is clear that it now becomes our job as researchers to equip ourselves with these understandings of the technical processes on which our work relies, however much this may take us outside of typical disciplinary boundaries.
Bibliography
boyd, d. and K. Crawford (2012) 'Critical Questions for Big Data', Information, Communication & Society, 15(5), 662-79.
Fielding, N. and R. Lee (2008) 'Qualitative e-Social Science/Cyber-Research' in N. Fielding, R. Lee and G. Blank (eds.)The Sage Handbook of Online Research Methods. London: Sage, pp. 491-506. Hine, C. (2006) 'Virtual Methods and the Sociology of Cyber-Social-Scientific Knowledge' in C. Hine
(ed.)Virtual Methods: Issues in Social Research on the Internet. Oxford: Berg, 1-13.
Keegan, B. (2013) 'C-Level Executives Cry Out for Data Scientists', ComputerWeekly.com, [ONLINE] Available at: http://www.computerweekly.com/news/2240205984/C-level-executives-cry-out-for-data-scientists [Accessed 13 November 2014].
Langlois, G. (2011) 'Meaning, Semiotechnologies and Participatory Media', Culture Machine, 12, 1-27.
Lewis, S. C., R. Zamith & A. Hermida (2013) 'Content Analysis in an Era of Big Data: A Hybrid Approach to Computational and Manual Methods', Journal of Broadcasting & Electronic Media, 57(1), 34-52.
Lynch, M. (2000) 'Against Reflexivity as an Academic Virtue and Source of Privileged Knowledge', Theory, Culture & Society, 17(3), 26-54.
Kitchin, R. (2014) 'Big Data, New Epistemologies and Paradigm Shifts',Big Data and Society, 1, 1-12. Manovich, L. (2012) 'Trending: The Promises and Challenges of Big Social Data', in M. K. Gold (ed.)
Debates in the Digital Humanities. London: University of Minnesota Press, 460-75.
Marres, N. (2012) 'The Redistribution of Methods: On Intervention in Digital Social Research, Broadly Conceived',The Sociological Review, 60(S1), 139-65.
Murthy, D. (2013)Twitter. Cambridge: Polity Press.
O'Connor, H., C. Madge, R. Shaw and J. Wellens (2008) 'Internet-Based Interviewing' in N. Fielding, R. Lee and G. Blank (eds.)The Sage Handbook of Online Research Methods. London: Sage, 271-89.
Procter, R., F. Vis and A. Voss (2013) 'Reading the Riots on Twitter: Methodological Innovation for the Analysis of Big Data', International Journal of Social Science Research Methodology, 16(3), 197-214.
Rogers, R. (2013)Digital Methods. London: The MIT Press.