EUROPEAN ORGANISATION FOR NUCLEAR RESEARCH (CERN)
Submitted to: JHEP CERN-EP-2018-171
7th August 2018
Search for new phenomena in events with
same-charge leptons and
√
b
-jets in
p p
collisions at
s
=
13 TeV with the ATLAS detector
The ATLAS Collaboration
A search for new phenomena in events with two same-charge leptons or three leptons and jets identified as originating fromb-quarks in a data sample of 36.1 fb−1 ofppcollisions at
√
s =13 TeV recorded by the ATLAS detector at the Large Hadron Collider is reported. No
significant excess is found and limits are set on vector-like quark, four-top-quark, and same-sign top-quark pair production. The observed (expected) 95% CL mass limits for a vector-like
T- and B-quark singlet aremT > 0.98(0.99) TeV andmB > 1.00(1.01)TeV respectively.
Limits on the production of the vector-likeT5/3-quark are also derived considering both pair and single production; in the former case the lower limit on the mass of theT5/3-quark is (expected to be) 1.19 (1.21) TeV. The Standard Model four-top-quark production cross-section upper limit is (expected to be) 69 (29) fb. Constraints are also set on exotic four-top-quark production models. Finally, limits are set on same-sign top-quark pair production. The upper limit onuu→ttproduction is (expected to be) 89 (59) fb for a mediator mass of 1 TeV, and a dark-matter interpretation is also derived, excluding a mediator of 3 TeV with a dark-sector coupling of 1.0 and a coupling to ordinary matter above 0.31.
1 Introduction
One of the primary goals of the ATLAS experiment at the CERN Large Hadron Collider (LHC) is to search for physics beyond the Standard Model (BSM). The existence of dark matter, the matter–antimatter asymmetry of the universe, and the high degree of fine tuning required to stabilise the Higgs boson mass at 125 GeV are among the motivations for BSM physics. In this analysis, events with two leptons of the same electric charge or three leptons and at least one jet identified as originating from a b-hadron are considered. This is a promising final state to search for new phenomena, since the backgrounds from known processes are small. In addition to the lepton requirements, kinematic criteria are imposed to select events containing objects with large transverse momenta to further suppress the background. After applying these criteria, the largest background sources arettW¯ ,tt Z¯ ,ttH¯ , and diboson production. There is also substantial background from events that appear to have the targeted final state only because one or more objects is misidentified. Three potential BSM sources of events in this final state are considered: production of vector-like quarks (VLQ), anomalous four-top-quark production (ttt¯t¯), and same-sign top-quark pair production (tt). Four-top-quark production in the context of the Standard Model (SM) is also studied, since this process has not yet been observed. Throughout this paper, ‘lepton’ is taken to mean electron or muon and is denoted by`in formulae and tables, and a particular set of electrons and muons in the final state is referred to as a ‘lepton flavour combination’.
This final state represents one of the most sensitive channels for VLQ searches with a top quark involved in the decay, especially for masses below 1 TeV, and is also one of the most sensitive channels for four-top-quark production. An earlier ATLAS analysis using this signature at
√
s =8 TeV [1] placed limits on the
models considered in this paper, includingmB >0.62 TeV andmT >0.59 TeV in the context of the singlet model of Ref. [2], where BandT indicate the VLQ with the same charges as the SM b- andt-quarks, respectively. That analysis also placed an upper limit of 70 fb on the cross-section of four-top-quark production with SM kinematics. Limits on same-sign top-quark pair production were also set; in the context of a flavour-changing neutral current (FCNC) model with a mediator similar to a Higgs boson of mass 125 GeV the cross-section foruu→ttwas found to be< 35 fb. In addition, there have been prior searches for BSM effects in similar final states at
√
s = 13 TeV: Ref. [3] reports an ATLAS search in
the context of supersymmetric (SUSY) models, and Ref. [4] reports a search by the CMS Collaboration where SUSY models and other BSM models are considered. The CMS Collaboration performed searches for pair production of the vector-likeT5/3 quark, which has charge 5/3, using events with either a single lepton or a same-charge lepton pair [5], resulting in limits ofmT5/3 >1.02 TeV (0.99 TeV) for right-handed
(left-handed) couplings. The CMS Collaboration reported on a search for SM four-top-quark production in Ref. [6], resulting in a measured cross-section of 16.9+−1311..84 fb and a limit on the Yukawa coupling between the top quark and the Higgs boson of less than 2.1 times its expected SM value.
2 Signals considered
2.1 Vector-likeT, B, andT5/3quarks
aforementioned B-,T-, andT5/3-quarks and the B−4/3-quark that has charge −4/3.1 They may appear as singlets, doublets, or triplets under SU(2). In many models, the VLQ couple predominantly to third-generation SM quarks in order to address the naturalness problem, mostly driven by the couplings between the top quark and the Higgs boson [2]. Therefore, in this paper it is assumed that couplings to first- and second-generation SM quarks are negligible. Several production and decay scenarios could lead to an enhanced rate of multilepton events [2,17,18]. TheB- andT-quarks could decay via both the charged and neutral current channels: B →Wt,Hb,Z b, andT →W b,Ht,Zt, with model-dependent branching ratios. The most likely scenarios resulting in same-charge lepton pair or trilepton production are
• BB¯ →W−tW+t¯→W−W+bW+W−b¯
• BB¯ →W−t Zb¯ →W−W+bZb¯
• TT¯ →Zt Zt¯→ZW+bZW−b¯
• TT¯ →ZtHt¯→ ZW+bHW−b¯
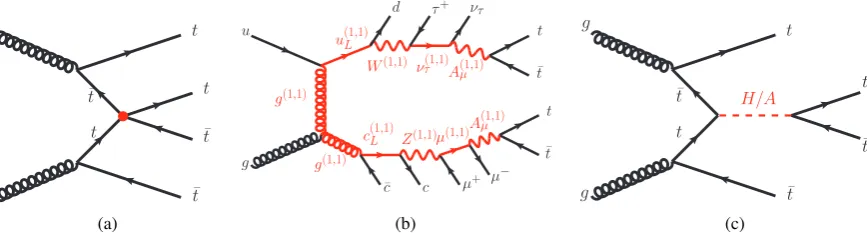
where two or more of the vector bosons decay leptonically. Results are given for the SU(2) singlet models of Ref. [2], as well as in a model-independent framework where all branching ratios are considered. The only decay mode of theT5/3 quark is intoW+t →W+W+b. If bothWbosons decay leptonically, then a same-charge lepton pair is produced from a singleT5/3decay. Therefore, results for theT5/3are presented for both pair and single production. The single production results depend on the assumed strength of the
T5/3tW coupling. Figure1 shows typical Feynman diagrams leading to the signature considered in this
paper.
T
¯
T W
−, H, Z
¯
b,t,¯¯t t
H
g g
(a)
T5/3
¯
T5/3
W−
¯
t t
W+
g g
(b)
ℓ+
¯
ν
t T5/3
¯
t t
W+
q q
′
g
W+
[image:3.595.82.524.408.516.2](c)
Figure 1: Three examples of VLQ production with (a) pair-producedT, (b) pair-produced T5/3, and (c) singly
producedT5/3.
2.2 Four-top-quark production
Four-top-quark production is expected to occur in the SM with a next-to-leading-order cross-section of 9.2 fb at
√
s=13 TeV [19] and leads to a same-charge lepton pair or a trilepton final state with a branching
ratio of 12.1%, including leptonically decayingτ-leptons. In addition, the four-top-quark production rate could be enhanced in several BSM scenarios. Three benchmarks are considered in this paper. The first is based on an effective field theory (EFT) approach where the BSM contribution is represented via a contact
1TheB−
4/3quark can only decay intoW b, and therefore pair-production of these quarks does not result in same-charge prompt
interaction (CI) independently of the details of the underlying theory:
L4t =
C4t
Λ2 (t¯Rγ
µt
R) t¯RγµtR
wheretR is the right handed top spinor, γµ are the Dirac matrices,C4t is a dimensionless constant and
Λis the new-physics energy scale. Only the contact interaction operator with right-handed top quarks
is considered as left-handed top operators are already strongly constrained by electroweak precision data [20]. The four-top-quark production mechanism in this model is shown in Figure2(a).
The second BSM four-top-quark production model is one with two universal extra dimensions (2UED) that are compactified in the real projective plane geometry (RPP), as described in Ref. [21]. The com-pactification of the two extra dimensions, characterised by the radiiR4andR5, leads to the discretisation of the momenta along these directions with the allowed values labelled by the integersi and j. Each momentum state appears as a particle called a Kaluza–Klein (KK) excitation with a massm, defined by
(i,j)values and later referenced as a ‘tier’. At leading order, the mass of a KK excitation of a particle with
a massm0is
m2 = i
2
R2 4
+ j2 R2 5
+m2
0. (1)
The additional mass differences within a given tier(i,j)are due to next-to-leading-order corrections and are small compared with the masses [21]. By using the notationsmKK = 1/R4 andξ = R4/R5, Eq. (1) reads as
m2 =m2
KK
i2+ j2ξ2+m2 0.
The four-top-quark signal of the model considered in this paper arises from pair-produced particles of tier(1,1), which then chain-decay into the lightest particle of this tier, the KK excitation of the photon,
A(1,1), by emitting SM particles [22], as shown in Figure2(b). This heavy photon A(1,1) decays into tt¯
with a branching ratio assumed to be 100%. Therefore, additional quarks and leptons are expected to be produced in association with the four-top-quark system, which makes this signature quite different from the other considered benchmarks, as shown in Figure2. In addition, cosmological observations constrain
mKKbetween 600 GeV and 1000 GeV [22,23], leading to typical resonance masses between 0.6 TeV and
2 TeV depending on the ratioξof the two compactification radii. This analysis probes different scenarios varying bothmKKandξ, where the four-top-quark signal arises from particles of tier(1,1)[22].
g g t t ¯ t ¯ t ¯ t t (a) u g g(1,1)
u(1L,1)
g(1,1)
¯
c c(1L,1)
c Z(1,1)
µ+ µ(1,1)A
(1,1)
µ
µ− W(1,1)
d τ+
[image:4.595.86.520.554.672.2]ντ(1,1)A(1µ,1) ντ t ¯ t t ¯ t (b) g g t t ¯ t ¯ t ¯ t t H/A (c)
The third BSM four-top-quark production model is one with two Higgs doublets Φ1 andΦ2 (2HDM), which spontaneously break the electroweak symmetry SU(2)L×U(1)Y[24]. In this model,Φ1 couples only to down-type quarks and leptons, andΦ2 couples only to up-type quarks and neutrinos [25]. The parameter space is constrained to avoid large FCNC at tree level, resulting in four different sets of Yukawa couplings between the Higgs doublets and SM fermions. Among these, the Type-II 2HDM is considered. Measurements of the properties of the SM Higgs boson constrain all 2HDM types to be in the so-called alignment limit [25], where the mass eigenstates are aligned with the gauge eigenstates in the new scalar sector. In this model, the ttt¯t¯final state arises from the production of heavy neutral Higgs bosons H (scalar) and A(pseudo-scalar) in association with att¯pair, with the H or Aboson decaying intott¯as shown in Figure2(c):
gg→ttH¯ /A→ttt¯t¯.
In the alignment limit, the scalar and the pseudo-scalar Higgs boson have the same massmH/Aand both contribute to the four-top-quark production with similar kinematics. The cross-section predicted by this model depends onmH/Aand the ratio tanβof vacuum expectation values of the two Higgs doublets. This benchmark is particularly interesting since the four-top-quark kinematics are rather soft compared with the CI signature, especially at low masses where the direct search forH/A→tt¯loses sensitivity due to interference effects with the SMtt¯production [26].
2.3 Same-sign top-quark pair production
Same-sign top-quark pair production (tt) is suppressed to a negligible level in the SM but allowed in BSM models. This signature is distinct from VLQ orttt¯t¯production, and is treated separately in the analysis. In particular, only positively charged lepton pairs are considered for this signal (sincettproduction has a cross-section higher by a typical factor 100 than ¯tt¯production at the LHC). The kinematic criteria also differ from those applied in the VLQ and four-top-quark searches. The considered benchmark is a generic dark-matter model relying on an effective theory invariant underSU(2)L×U(1)Y [27]. In this model, a top quark is produced in association with an FCNC mediatorV which could then decay into dark-matter
χor SM particlestu¯/tu¯ :
LDM = Lkin[χ,Vµ] + gSMVµt¯RγµuR + gDMVµ χγ¯
µχ
wheregSM andgDM represent the coupling strengths of the mediator to SM and dark-matter particles, respectively, andLkin[χ,Vµ] represents the kinetic term of the mediator and the dark-matter fields. The
ttfinal state could arise ifV couples to the top quark, in both thet- ands-channels, leading to the three
processes shown in Figure3, with a relative contribution which depends on the total width of the mediator.
The results are interpreted for each process in Figure3independently, allowing constraints to be placed on generic FCNC via the processuu→ttas well as specific resonances decaying intotu¯. The results are also interpreted for different values of the mass of the mediatormV,gSM, andgDM, taking into account width effects. This provides additional sensitivity to dark-matter mediators when its branching ratio into SM particles is sizeable,2where a direct search based on final states with missing transverse energy and a top quark [28] might lose sensitivity.
2This is a realistic scenario since the mediator must have visible partial width in order to be produced in proton–proton
u u
t gSM
gSM
t
V
(a)
u g
u
t
V
t
¯
u
gSM
gSM
(b)
u
g
t
V gSM
gSM t
¯ u u
[image:6.595.84.524.106.211.2](c)
Figure 3: Three examples of same-sign top quark pair signatures in the context of the dark-matter mediator model: (a) prompttt production, (b) via an on-shell mediator, (c) via an off-shell mediator. The mediator is denoted byV and its coupling to SM particles is denoted bygSM.
3 ATLAS detector
The ATLAS detector [29] at the LHC covers nearly the entire solid angle around the collision point.3 It consists of an inner tracking detector surrounded by a thin superconducting solenoid, electromagnetic and hadronic calorimeters, and a muon spectrometer incorporating three large superconducting toroidal magnets. The inner-detector system is immersed in a 2 T axial magnetic field and provides charged-particle tracking in the range|η| <2.5.
A high-granularity silicon pixel detector covers the vertex region and typically provides four three-dimensional measurements per track, the innermost being in the insertable B-layer [30]. It is followed by a silicon microstrip tracker, which provides four two-dimensional measurement points per track. These silicon detectors are complemented by a transition radiation tracker, which enables radially extended track reconstruction up to|η| =2.0. The transition radiation tracker also provides electron identification information based on the fraction of hits (typically 30 in total) above a higher energy-deposit threshold corresponding to transition radiation.
The calorimeter system covers the pseudorapidity range|η| < 4.9. Within the region |η| < 3.2, electro-magnetic calorimetry is provided by barrel and endcap high-granularity lead/liquid-argon (LAr) sampling calorimeters, with an additional thin LAr presampler covering|η| <1.8 to correct for energy loss in mater-ial upstream of the calorimeters. Hadronic calorimetry is provided by a steel/scintillator-tile calorimeter, segmented into three barrel structures within|η| <1.7, and two copper/LAr hadronic endcap calorimeters. The solid angle coverage is completed with forward copper/LAr and tungsten/LAr calorimeter modules optimised for electromagnetic and hadronic measurements, respectively.
The muon spectrometer comprises separate trigger and high-precision tracking chambers measuring the deflection of muons in a magnetic field generated by the superconducting air-core toroidal magnets. The field integral of the toroidal magnets ranges between 2.0 and 6.0 T m across most of the acceptance. A set of precision chambers covers the region|η| <2.7 with three layers of monitored drift tubes, complemented by cathode strip chambers in the forward region, where the background is highest. The muon trigger
3ATLAS uses a right-handed coordinate system with its origin at the nominal interaction point (IP) in the centre of the detector
and thez-axis along the beam pipe. The x-axis points from the IP to the centre of the LHC ring, and the y-axis points
system covers the range|η| <2.4 with resistive plate chambers in the barrel, and thin gap chambers in the endcap regions.
The ATLAS detector has a two-level trigger system to select events for offline analysis [31]. The first-level trigger is implemented in hardware and uses a subset of detector information to reduce the event rate to a design value of 100 kHz. This is followed by a software-based high-level trigger which reduces the event rate to about 1 kHz.
4 Data sample and trigger requirements
The data were recorded in LHC proton–proton (pp) collisions at
√
s = 13 TeV in 2015 and 2016, corresponding to an integrated luminosity of 36.1±0.8 fb−1. The luminosity and its uncertainty are derived, following a methodology similar to that detailed in Ref. [32], from a calibration of the luminosity scale usingx–ybeam-separation scans. In this dataset the average number of simultaneousppinteractions per bunch crossing in addition to the triggered hard-scatter interaction, pile-up, was approximately 24. Data-quality requirements were applied to ensure that events were selected only from periods where all subdetectors were operating at nominal conditions, and where the LHC beams were in stable-collision mode. The events used in the analysis were required to have at least one primary vertex formed from at least two charged-particle tracks with transverse momentum pT > 0.4 GeV, and to have been triggered either by two leptons or a single high-pT lepton. Only triggers with loose lepton quality and isolation requirements were used, since tight requirements at the trigger level would complicate the estimation of the background originating from fake or non-prompt leptons. The dilepton triggers provide sensitivity at low leptonpTvalues, and the single-lepton triggers provide additional efficiency for high-pT leptons. ThepTthresholds for the dilepton triggers varied from 8 to 24 GeV depending on the lepton flavours and the year in which the event was recorded. The single-muon trigger had apT threshold of 50 GeV; the corresponding single-electron trigger had apTthreshold of 24 GeV for data recorded in 2015 and 60 GeV for data recorded in 2016. The trigger efficiency depends on the lepton flavour combination, but in all cases is>95% for events of interest in this analysis.
5 Object selection criteria
This analysis makes use of reconstructed electrons, muons, jets, b-tagged jets, and missing transverse momentum. Their selection is described in this section and summarised in Table1.
Electrons are reconstructed from clusters of energy deposits in electromagnetic calorimeter cells with a matching inner detector track [33]. The candidate electrons are required to have pT > 28 GeV and be in the |η| < 2.47 region, excluding the transition region between the barrel and endcap calorimeters (1.37< |η| <1.52). For events with two electrons or one electron and one muon, electrons with|η| >1.37 are not considered since such events are subject to backgrounds from electron charge misidentification, which has a substantially higher probability of occurring for electrons at high|η|, as detailed in Section7. Muons are reconstructed from tracks in the muon spectrometer and inner detector [34]. They must have
pT> 28 GeV and|η| <2.5.
σd0is its uncertainty, and|z0sinθ|, wherez0is ther–φprojection of the impact point onto the beamline.
Electrons are required to satisfy|d0/σd0| <5 and|z0sinθ|< 0.5 mm, while muons are required to satisfy
|d0/σd0| <3 and|z0sinθ|< 0.5 mm.
All leptons are required to satisfy either relaxed or nominal identification criteria. The nominal sample, which is a subset of the relaxed sample, is used in the final analysis, and the relaxed sample is used to estimate one component of the reducible background as described in Section7. For electrons, the relaxed (nominal) selection requires that the electron satisfies the likelihood medium (tight) requirements defined in Ref. [33], while for muons both the relaxed and nominal selections require that the muon satisfies the medium criteria defined in Ref. [34]. Nominal leptons are required to be isolated from other activity in the detector: the scalar sum of thepT of tracks within a variable-size cone around the lepton (excluding its own track), must be less than 6% of the leptonpT. The track isolation cone size for electrons (muons)
∆R=p(∆η)2+(∆φ)2is given by the smaller of∆R=10 GeV/pTand∆R=0.2(0.3). In addition, in the
case of electrons the sum of the transverse energy of the calorimeter energy clusters in a cone of∆R=0.2 around the electron (excluding the energy from the electron itself) must be less than 6% of the electron
pT.
Jets are reconstructed from clusters of energy in the calorimeter using the anti-kt algorithm [35] with a radius parameter of 0.4. Jets are considered ifpT > 25 GeV and |η| < 2.5. Quality criteria are applied to jets to ensure that they are not reconstructed from detector noise, beam losses, or cosmic rays [36]. If any jet fails to satisfy these criteria, the event is vetoed. To reject jets from pile-up, an observable called the jet vertex tagger (JVT) is formed by combining variables that discriminate pile-up jets from hard-scattering jets [37]. Jets withpT < 60 GeV and|η| < 2.4 that have associated tracks are subject to a requirement on JVT that is 92% efficient for hard-scattering jets while rejecting 98% of pile-up jets. If such jets have no associated tracks they are removed. Jets containing ab-hadron are identified using a multivariate technique [38]. An operating point is defined by a threshold in the range of discriminant output values, and is chosen to provide specificb-,c-, and light-jet efficiencies in simulatedtt¯events. The operating point used in this analysis has a 77%b-jet efficiency with rejection factors of 6 and 134 forc -and light-jets, respectively.
The missing transverse momentum is calculated as the negative vectorial sum of the transverse momenta of reconstructed calibrated objects in the event. Its magnitude is denotedETmiss, and is computed using electrons, photons, hadronically decayingτ-leptons, jets and muons as well as a soft term calculated with tracks matched to the primary vertex which are not associated with any of these objects [39].
A set of requirements are applied to resolve overlaps between reconstructed objects. This procedure is applied to the leptons satisfying the relaxed selection criteria. In the first step, electrons which share a track with a muon are removed, to avoid cases where muon radiation would mimic an electron. Next, the jet closest to an electron within∆Ry ≡
p
(∆y)2+(∆φ)2= 0.2 is removed to avoid double counting. Then,
to reduce the contributions from non-prompt electrons originating from heavy-flavour decays, electrons within∆Ry = 0.4 of any remaining jets are removed. Finally, the overlap between muons and jets is considered: jets with less than three tracks and within∆Ry= 0.4 of a muon are removed. Muons are then removed if they are within∆Ry =0.04+10 GeV/pT,µof remaining jets.
is imposed on their charge or on the invariant mass of any pair. These events are called ‘trilepton’ events. Same-charge lepton and trilepton events are treated separately in the analysis.
Table 1: Summary of object identification and definition. ‘ID quality’ refers to the identification criteria used for each object type. For electrons, ‘mediumLH’ and ‘tightLH’ refer to the likelihood medium and tight requirements defined in Ref. [33]; for muons the criteria for ‘medium’ ID quality are defined in Ref. [34]. For jets, ‘cleaning’ means applying a procedure to reduce contamination from spurious jets [36], and ‘JVT’ means applying criteria to select jets that are consistent with being produced at the primary vertex rather than from pile-up [37]. Forb-jets, ‘MVA77’ refers to placing a requirement on the multivariate discriminant defined in Ref. [38] that is 77% efficient forb-jets in simulatedtt¯events.
Electrons Muons Jets b-jets relaxed nominal relaxed nominal
pT[GeV] >28 >28 >25 >25
|η| <1.37 or 1.52 – 2.47 <2.5 <2.5 <2.5
(<1.37 foreeandeµ)
ID quality mediumLH tightLH medium cleaning MVA77 + JVT
Isolation none track- and
calorimeter-based none track-based Track vertex :
− |d0/σd0| <5 <3
− |z0sinθ|[mm] <0.5 <0.5
6 Simulation
Monte Carlo (MC) simulation was used to model the signals and the irreducible backgrounds. Evt-Gen v1.2 [40] was used to model charm and bottom hadron decays for all samples, except those generated with Sherpa [41], and the A14 set of tuned parameters [42] was used for all samples unless stated otherwise.
The production ofTT¯,BB¯ andT5/3T¯5/3pairs was modelled by Protos v2.2 [2], with Pythia v8.186 [43] for showering and hadronisation,4using the NNPDF2.3LO set [45] of parton distribution functions (PDF). VLQ masses from 0.50 to 1.40 TeV were simulated. Standard Model production of four top quarks was simulated using MG5_aMC@NLO v2.2.2 [19] with Pythia v8.186, using the NNPDF2.3LO PDF set. In the 2UED/RPP scenario, four-top-quark production was modelled with Pythia v8.186, using the NNPDF2.3LO PDF set. For the contact interaction model, four-top-quark production was modelled with MG5_aMC@NLO v2.2.3 and Pythia v8.205 using the NNPDF2.3LO PDF set. Same-sign top-quark pair production was modelled by MG5_aMC@NLO v2.3.3 and Pythia v8.210 using the NNPDF2.3LO PDF set.
The main sources of irreducible backgrounds are ttV¯ production (where V represents either a W or
Z boson), ttH¯ production, and diboson production. Smaller contributions from triboson, V H, ttt¯,
4Throughout this analysis it is assumed that pair production of vector-like quarks occurs only via QCD. There are models, such
ttWW¯ , t ZW, and t Z production are shown in the tables and figures as ‘Other bkg’. The SM four-top-quark production is included as a background for all BSM searches, but is considered as the signal in the search for SM four-top-quark production. The matrix elements for ttV¯ , ttH¯ , ttt¯, ttt¯t¯, ttWW¯ , andt ZW production processes were modelled with MG5_aMC@NLO v2.2.2 and Pythia v8.186 for hadronisation and showering, using the NNPDF3.0NLO PDF set. Next-to-leading-order (NLO) matrix-element calculation was used forttV¯ ,ttH¯ andt ZWwhile leading-order (LO) calculation was used forttt¯,
ttt¯t¯andttWW¯ . Thet Z process was modelled by MG5_aMC@NLO v2.2.2 based on LO matrix-element calculation with Pythia v6.428 [46] for showering and hadronisation. The CTEQ6L1 PDF set [47] and Perugia2012 set of tuned parameters [48] were used. Diboson and triboson production was modelled with the Sherpa v2.2.1 generator, which uses the Comix [49] and OpenLoops [50] matrix-element generators merged with the Sherpa parton shower [51] using the ME+PS@NLO prescription [52]. The
V Hproduction process was modelled using Pythia v8.186, with the NNPDF2.3LO PDF set. The
cross-sections for all processes are calculated at NLO in QCD, except fort Zwhere the leading-order calculation is used.
Simulated Pythia v8.186 minimum-bias events were overlaid on each simulated event to model the effects of pile-up; the generated events were then reweighted so that the distribution of the number of interactions per bunch crossing matched the distribution observed in the data. The response of the ATLAS detector for most samples was modelled using Geant4 [53] within the ATLAS simulation infrastructure [54]. The
ttt¯, singleT5/3, and same-sign top-quark pair production samples were processed with a fast simulation that relies on a parameterisation of the calorimeter response [55]. Events were reconstructed using the same algorithms as used for the collider data. Corrections were applied to the simulated events to account for differences observed in trigger efficiencies, object identification efficiencies and resolutions when comparing the simulation with data.
7 Estimation of reducible backgrounds
In addition to the irreducible backgrounds described above, there are reducible backgrounds where a jet or lepton from heavy-flavour hadron decay mimics a prompt lepton5(called ‘fake/non-prompt lepton background’ in the following), or the charge of a lepton is misidentified. These backgrounds are estimated using data-driven techniques.
The fake/non-prompt lepton background yield is estimated with the matrix method [56,57], which uses the relaxed and nominal lepton categories defined in Table1. The fraction of prompt leptons satisfying the relaxed criteria that also satisfy the nominal criteria is referred to asr. Similarly, the fraction of fake/non-prompt leptons satisfying the relaxed requirements that also satisfy the nominal requirements is referred to as f. Using the measured values ofr and f, the number of events with at least one non-prompt/fake lepton in the nominal sample can be inferred from the numbers of relaxed and nominal leptons in the relaxed sample, and this number is taken as the fake/non-prompt yield. A Poisson likelihood approach is used to estimate the final fake/non-prompt yield and its statistical uncertainty. This approach guarantees that the estimated yield is not negative, and provides a more reliable estimate of the statistical uncertainty in regions with a small number of selected events.
Single-lepton control regions enriched in prompt and fake/non-prompt leptons are used to measurer and
different sources of fake/non-prompt leptons for each flavour. For electrons,ris measured using events with
Emiss
T >150 GeV, where the dominant contribution is fromW →eν, and f is measured using events with the transverse mass of theETmiss–lepton system6mT(W) <20 GeV andETmiss+mT(W) < 60 GeV, where the dominant contribution is from multijet production (including heavy-flavour production) where one or more jets are misidentified as electrons. For muons,ris measured using events withmT(W)>100 GeV, a sample dominated byW →µν, and f is measured using events where the transverse impact parameter of the muon relative to the primary vertex is more than five standard deviations away from zero, consistent with muons originating from heavy-flavour hadron decays. The small contribution of prompt leptons in the control samples used to measure f is estimated from simulation and this contribution is subtracted from the sample. The values ofr and f are parameterised in terms of variables of the leptons (|η|, pT, and the angular distance to the nearest jet) and the number ofb-tagged jets. For muons,r ranges from 55% to 97% while f ranges from 7% to 30%. For electrons,r ranges from 70% to 95% while f ranges from 8% to 30%. In general, the values ofrand f are smaller for leptons near a jet, and larger for high-pT leptons.
The second reducible background, corresponding to events where the charge of a lepton is misidentified, is considered only for electrons since the probability of muon charge misidentification is negligibly small. There are two primary mechanisms by which the electron charge can be misidentified: the first is the ‘trident’ process in which an electron emits an energetic bremsstrahlung photon, which subsequently produces ane+e−pair. This can result in a track of the incorrect charge being associated with the electron. The second is the mismeasurement of the curvature of the electron track. The probability for an electron to have its charge incorrectly reconstructed is measured using a sample of dielectron events with invariant mass consistent with the Z boson. The trident process can result in misidentified charge for an electron that is also likely to be considered fake/non-prompt due to the presence of nearby charged tracks. To avoid double-counting the background contribution from such electrons, the matrix method is used to subtract the fake/non-prompt electron yield from theZ sample. The charge misidentification probability is calculated in bins of electron|η| andpT, using a likelihood fit that adjusts these binned probabilities to find the best agreement with the observed numbers of same-charge and opposite-charge electron pairs. The charge misidentification probability varies from 2×10⁻⁵(for electrons at low pT and small |η|) to 10−2 for electrons at high pT and |η| near the edge of the barrel calorimeter; for electrons with larger values of|η|the probability can reach 10%.
Since charge misidentification is negligible for muons and not relevant for trilepton events (for which no lepton charge requirements are imposed), the background from charge misidentification (called charge mis-ID hereafter) only appears inee oreµevents. To estimate its yield, ee andeµevents are selected using all the criteria applied in the analysis, with the exception that the leptons are required to have opposite charge. Then the charge misidentification probabilities are applied to this sample to determine the background yield.
8 Signal and validation regions
Several signal regions (SR) are defined to represent the broad range of BSM signals considered. The selection criteria are designed to maximise the sensitivity to the signals. The signal regions are separated
6The transverse mass of theEmiss
T –lepton system is defined asmT(W) ≡ q
2pT`Emiss
T (1−cos∆φ)wherepT` is the lepton
into two categories: one category is designed for maximal sensitivity to VLQ and four-top-quark produc-tion, while the second category is optimised for the same-sign top-quark pair production searches. For the VLQ and four-top-quark searches, the preselected sample is first split according to the numbers of leptons (two or three) andb-tagged jets (one, two, or greater than two). Within each of the resulting subsamples, requirements are placed onHT and ETmiss, where HT is the scalar sum of the pT of all selected jets and leptons, to maximise the average sensitivity for the signal models considered. In addition, to fully exploit specific features of VLQ and four-top-quark signatures, the signal regions with at least threeb-tagged jets are further split. RelaxedHTand high jet multiplicity requirements are sensitive to the four-top-quark sig-nature, while highHTand low jet multiplicity requirements enhance sensitivity to the VLQ signature. For all the signal regions described above, lepton flavours are considered inclusively to increase the number of data events in the loosely selected samples used to estimate the reducible backgrounds. The values of
r and f appropriate to each lepton’s flavour are used to estimate the fake/non-prompt lepton background.
The selection criteria are summarised in Table2, and the selection efficiencies for some signal models are shown in Table3.
The same-sign top-quark selection requires exactly two leptons with positive charge, reflecting the prepon-derance ofttover ¯tt¯production inppcollisions by a typical factor of 100. Additional criteria are imposed to maximise the sensitivity of the search: at least oneb-tagged jet,HTgreater than 750 GeV,ETmissgreater than 40 GeV, and the azimuthal separation between the two leptons |∆φ``| greater than 2.5. Since the
optimal kinematic selection is looser than for VLQ and four-top-quark signal regions, more statistics are available for estimating the reducible backgrounds, so the lepton flavours (ee, eµ, and µµ) are treated separately in the search for same-sign top-quark pair production. These selection criteria are summarised in Table4and the selection efficiencies for the three same-sign top-quark pair signal processes are shown in Table5.
[GeV]
T miss
E
0 50 100 150 200 250 300
Events / 20 GeV
0 20 40 60 80 100 120 140 Data Fake/non-prompt Charge mis-ID Z t t H t t W t t Dibosons t t t t Other bkg Total bkg unc.
ATLAS
-1
= 13 TeV, 36.1 fb s SS dilepton VR1b2l (a) [GeV] T miss E
0 50 100 150 200 250 300
Events / 20 GeV
0 10 20 30 40 50 60 70 80
90 DataFake/non-prompt Z t t H t t W t t Dibosons t t t t Other bkg Total bkg unc.
ATLAS
-1
= 13 TeV, 36.1 fb s Trilepton VR1b3l (b) [GeV] T miss E
0 50 100 150 200 250 300
Events / 20 GeV
0 10 20 30 40 50 60 70 80 90 Data Fake/non-prompt Charge mis-ID Z t t H t t W t t Dibosons t t t t Other bkg Total bkg unc.
ATLAS
-1
= 13 TeV, 36.1 fb s SS dilepton VR2b2l (c) [GeV] T miss E
0 50 100 150 200 250 300
Events / 20 GeV
0 5 10 15 20 25 30 35 40 Data Fake/non-prompt Z t t H t t W t t Dibosons t t t t Other bkg Total bkg unc.
ATLAS
-1
= 13 TeV, 36.1 fb s Trilepton VR2b3l (d) [GeV] T miss E
0 50 100 150 200 250 300
Events / 20 GeV
0 2 4 6 8 10 12 14 16 Data Fake/non-prompt Charge mis-ID Z t t H t t W t t Dibosons t t t t Other bkg Total bkg unc.
ATLAS
-1
= 13 TeV, 36.1 fb s SS dilepton VR3b2l (e) [GeV] T miss E
0 50 100 150 200 250 300
Events / 20 GeV
0 1 2 3 4 5 6 7 Data Fake/non-prompt Z t t H t t W t t Dibosons t t t t Other bkg Total bkg unc.
ATLAS
-1
= 13 TeV, 36.1 fb s
Trilepton VR3b3l
[image:13.595.86.529.139.628.2](f)
Figure 4: Distributions ofETmiss in each of the validation regions used for the four-top-quark and VLQ searches. The first (second) column shows distributions of dilepton (trilepton) events while each row corresponds to a given
b-tagged jet multiplicity. The uncertainty, shown as the hashed region, includes both the statistical and systematic
[GeV]
T
H
400 500 600 700 800 900 1000 1100 1200
Events / 80 GeV
0 50 100 150 200 250 Data Fake/non-prompt Charge mis-ID Z t t H t t W t t Dibosons t t t t Other bkg Total bkg unc.
ATLAS
-1
= 13 TeV, 36.1 fb s SS dilepton VR1b2l (a) [GeV] T H
400 500 600 700 800 900 1000 1100 1200
Events / 80 GeV
0 20 40 60 80 100 120 Data Fake/non-prompt Z t t H t t W t t Dibosons t t t t Other bkg Total bkg unc.
ATLAS
-1
= 13 TeV, 36.1 fb s Trilepton VR1b3l (b) [GeV] T H
400 500 600 700 800 900 1000 1100 1200
Events / 80 GeV
0 20 40 60 80 100 120 140 Data Fake/non-prompt Charge mis-ID Z t t H t t W t t Dibosons t t t t Other bkg Total bkg unc.
ATLAS
-1
= 13 TeV, 36.1 fb s SS dilepton VR2b2l (c) [GeV] T H
400 500 600 700 800 900 1000 1100 1200
Events / 80 GeV
0 5 10 15 20 25 30 35 40 45 Data Fake/non-prompt Z t t H t t W t t Dibosons t t t t Other bkg Total bkg unc.
ATLAS
-1
= 13 TeV, 36.1 fb s Trilepton VR2b3l (d) [GeV] T H
400 500 600 700 800 900 1000 1100 1200
Events / 80 GeV
0 2 4 6 8 10 12 14 16 Data Fake/non-prompt Charge mis-ID Z t t H t t W t t Dibosons t t t t Other bkg Total bkg unc.
ATLAS
-1
= 13 TeV, 36.1 fb s SS dilepton VR3b2l (e) [GeV] T H
400 500 600 700 800 900 1000 1100 1200
Events / 80 GeV
0 1 2 3 4 5 6 Data Fake/non-prompt Z t t H t t W t t Dibosons t t t t Other bkg Total bkg unc.
ATLAS
-1
= 13 TeV, 36.1 fb s
Trilepton VR3b3l
[image:14.595.86.528.147.627.2](f)
Figure 5: Distributions of HT in each of the validation regions used for the four-top-quark and VLQ searches.
The first (second) column shows distributions of dilepton (trilepton) events while each row corresponds to a given
b-tagged jet multiplicity. The uncertainty, shown as the hashed region, includes both the statistical and systematic
Table 2: Definitions of the validation and corresponding signal regions for the four-top-quark and VLQ searches, whereNj is the number of jets,Nb is the number ofb-tagged jets, andN` is the number of leptons. The name of each signal (validation) region begins with “SR” (“VR”), with the rest of the name indicating the number of leptons and number ofb-tagged jets required. The suffix “_L” denotes the signal regions with relaxedHTbut stricterNj
requirements. For regions that require two leptons, the leptons must have the same charge. Events that appear in any of the signal regions are vetoed in the validation regions.
Region name Nj Nb N` Lepton charges Kinematic criteria
VR1b2` ≥1 1 2 ++or−− 400<HT<2400 GeV orETmiss<40 GeV
SR1b2` ≥1 1 2 ++or−− HT>1000 GeV andETmiss>180 GeV
VR2b2` ≥2 2 2 ++or−− HT>400 GeV
SR2b2` ≥2 2 2 ++or−− HT>1200 GeV andETmiss>40 GeV
VR3b2` ≥3 ≥3 2 ++or−− 400<HT<1400 GeV orETmiss<40 GeV
SR3b2`_L ≥7 ≥3 2 ++or−− 500<HT<1200 GeV andETmiss>40 GeV
SR3b2` ≥3 ≥3 2 ++or−− HT>1200 GeV andETmiss>100 GeV
VR1b3` ≥1 1 3 any 400<HT<2000 GeV orETmiss<40 GeV
SR1b3` ≥1 1 3 any HT>1000 GeV andETmiss>140 GeV
VR2b3` ≥2 2 3 any 400<HT<2400 GeV orETmiss<40 GeV
SR2b3` ≥2 2 3 any HT>1200 GeV andETmiss>100 GeV
VR3b3` ≥3 ≥3 3 any HT>400 GeV
SR3b3`_L ≥5 ≥3 3 any 500<HT<1000 GeV andETmiss>40 GeV
[image:15.595.78.535.204.441.2]SR3b3` ≥3 ≥3 3 any HT>1000 GeV andETmiss>40 GeV
Table 3: Signal selection and preselection efficiencies for events in various signal models, as estimated from MC simulation. VLQs are assumed to decay with the branching ratios expected in the singlet model of Ref. [2].
Signal Preselection Signal region efficiencies [%]
efficiency [%] SR1b2`/ 3` SR2b2`/ 3` SR3b2`_L / 3`_L SR3b2`/ 3`
BB¯,mB=800 GeV 1.7 0.12 / 0.16 0.19 / 0.14 0.007 / 0.002 0.05 / 0.04
BB¯,mB=1200 GeV 1.9 0.27 / 0.28 0.31/ 0.24 4×10⁻⁴/ 4×10⁻⁴ 0.07 / 0.05
TT¯,mT =800 GeV 1.2 0.06 / 0.02 0.09 / 0.02 0.008 / 0.006 0.04 / 0.06
TT¯,mT =1200 GeV 1.3 0.10 / 0.25 0.13 / 0.22 0.002 / 9×10⁻⁴ 0.06 / 0.11
ttt¯t¯(SM) 2.7 0.02 / 0.02 0.11 / 0.04 0.37 / 0.17 0.20 / 0.18
ttt¯t¯(CI) 3.0 0.06 / 0.05 0.23 / 0.08 0.30 / 0.16 0.33 / 0.27
ttt¯t¯(2HDM, 3.1 0.02 / 0.03 0.11 / 0.03 0.62 / 0.24 0.19 / 0.17
mH =700 GeV)
ttt¯t¯(2UED/RPP, 3.3 0.27 / 0.16 0.62 / 0.31 8×10⁻⁴/ 0.0 0.89 / 0.51
[image:15.595.87.526.539.700.2]Table 4: Definitions of the validation and signal regions for the same-sign top-quark pair production search, where
Nb is the number of b-tagged jets, N` is the number of leptons, and |∆φ``| is the azimuthal angle between the leptons. The name of each signal (validation) region begins with “SR” (“VR”). The validation region is inclusive in lepton flavour.
Region name Nb N` HT[GeV] ETmiss[GeV] |∆φ``|[radians] Lepton flavour/charge
VRtt ≥1 2 >750 >40 >2.5 e−e−+e−µ−+µ−µ−
SRttee
≥1 2 >750 >40 >2.5
e+e+
SRtteµ e+µ+
[image:16.595.103.508.176.260.2]SRttµµ µ+µ+
Table 5: Signal selection and preselection efficiencies for events in the three same-sign top-quark pair production processes, as estimated from MC simulation.
Signal Preselection Signal region efficiencies [%] efficiency [%] SRttee SRtteµ SRttµµ
tt,mV =2000 GeV 2.0 0.1 0.3 0.3
ttu¯off-shell,mV =2000 GeV 1.7 0.1 0.2 0.2
tV(→tu¯)on-shell,mV =2000 GeV 1.8 0.04 0.2 0.1
[GeV]
T miss
E
0 50 100 150 200 250 300
Events / 20 GeV
0 1 2 3 4 5 6 7 8 9 Data Fake/non-prompt Charge mis-ID Z t t H t t W t t Dibosons t t t t Other bkg Total bkg unc.
ATLAS
-1 = 13 TeV, 36.1 fb s SS dilepton VRtt (a) [GeV] T H
800 1000 1200 1400 1600 1800 2000 2200 2400
Events / 100 GeV
0 2 4 6 8 10 12 Data Fake/non-prompt Charge mis-ID Z t t H t t W t t Dibosons t t t t Other bkg Total bkg unc.
ATLAS
-1 = 13 TeV, 36.1 fb s
SS dilepton VRtt
(b)
Figure 6: Distributions of (a) ETmiss and (b) HT in the validation region used for the same-sign top-quark pair
[image:16.595.129.483.352.425.2] [image:16.595.96.512.431.651.2]Table 6: Expected background and observed event yields in the validation regions used in the VLQ and four-top-quark searches. The ‘Other bkg’ category includes contributions from all rare SM processes listed in Section6. The first uncertainty is statistical and the second is systematic. Thep-values are the probabilities for the expected background to fluctuate to equal or exceed the observed yield in each region.
Source VR1b2` VR2b2` VR3b2`
ttW¯ 49 ± 1 ±14 48 ± 1 ±13 5.8 ± 0.3 ± 2.8
tt Z¯ 28.7 ± 0.5 ± 4.6 27.6 ± 0.4 ± 5.3 3.4 ± 0.2 +4.2
−3.4 Dibosons 48 ± 4 ±35 4.9 ± 1.3 ± 3.5 <0.5
ttH¯ 17.7 ± 0.4 ± 2.4 18.3 ± 0.4 ± 2.6 2.6 ± 0.2 ± 1.9
ttt¯t¯ 0.59± 0.04± 0.39 1.3 ± 0.1 ± 1.2 1.0 ± 0.1 +−21..50
Other bkg 12.3 ± 0.5 ± 6.4 7.3 ± 0.3 ± 4.0 1.1 ± 0.2 ± 1.1 Fake/non-prompt 170 ± 8 ±87 53 ± 5 ±28 7.8 ± 1.6 ± 3.8 Charge mis-ID 70 ± 1 ±17 54 ± 1 ±15 4.4 ± 0.2 ± 1.3
Total bkg 395 ± 9 ±98 216 ± 5 ±38 26 ± 2 ±11
Data yield 407 269 27
p-value 0.45 0.10 0.46
Source VR1b3` VR2b3` VR3b3`
ttW¯ 10.4 ± 0.3 ± 3.3 9.4 ± 0.3 ± 2.4 0.31± 0.09 +−00..5730
tt Z¯ 70 ± 1 ±11 66 ± 1 ±15 4.6 ± 0.2 +−74..46
Dibosons 93 ± 7 ±66 7.7 ± 2.1 ± 6.2 0.17± 0.17 +−00..2600
ttH¯ 6.5 ± 0.2 ± 0.8 6.8 ± 0.2 ± 0.8 0.41± 0.05 +−00..7841
ttt¯t¯ 0.21± 0.02± 0.14 0.64± 0.03± 0.37 0.21± 0.02 +−10..2021
Other bkg 27 ± 1 ±14 12.0 ± 0.5 ± 6.1 0.7 ± 0.2 +−00..97
Fake/non-prompt 22 ± 4 ±13 2.7 ± 1.5 ± 2.1 0.21 +−00..3118± 0.12
Total bkg 229 ± 8 ±70 105 ± 3 ±19 6.5 ± 0.4 +−106.5.8
Data yield 248 126 5
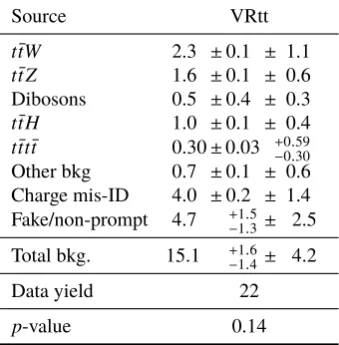
Table 7: Expected background and observed event yields in the validation region for the same-sign top-quark pair production search. The ‘Other bkg’ category includes contributions from all rare SM processes listed in Section6. The first uncertainty is statistical and the second is systematic. The p-value is the probability for the expected background to fluctuate to equal or exceed the observed yield.
Source VRtt
ttW¯ 2.3 ±0.1 ± 1.1
tt Z¯ 1.6 ±0.1 ± 0.6
Dibosons 0.5 ±0.4 ± 0.3
ttH¯ 1.0 ±0.1 ± 0.4
ttt¯t¯ 0.30±0.03 +0.59
−0.30
Other bkg 0.7 ±0.1 ± 0.6 Charge mis-ID 4.0 ±0.2 ± 1.4 Fake/non-prompt 4.7 +−11..53 ± 2.5
Total bkg. 15.1 +−11..64 ± 4.2
Data yield 22
9 Systematic uncertainties
The expected background yields are subject to several sources of systematic uncertainty. For the irreducible backgrounds, the uncertainties include those from the background model and from the simulation of the response of the detector. The background model uncertainties arise from the uncertainty of both the cross-section for a given process and of the acceptance of the signal regions for that process. ForttW¯ andtt Z¯ production, these uncertainties are estimated by varying the renormalisation and factorisation scales up and down by a factor of two from their nominal values, and comparing the nominal MG5_aMC@NLO v2.2.2 with a sample generated with Sherpa v2.2.1. For diboson production these uncertainties are estimated by varying the renormalisation, factorisation, and resummation scales up and down by a factor of two from their nominal values, and setting the CKKW merging scale to 15 and 30 GeV (where the nominal value is 20 GeV) [52]. The cross-section uncertainties forttW¯ andtt Z¯ are 13% and 12%, respectively, 6% for diboson production, and +−6%9% for ttH¯ production [19]. For other irreducible backgrounds, this uncertainty is set to 50% of the nominal yield. The most important detector-related uncertainties are those of the efficiency for identifying b-jets (or misidentifying c- or light-jets as b-jets) [38], the jet energy calibration [58], and the efficiencies for jets and leptons to satisfy the identification criteria [33,34]. In addition, there is a global 2.1% uncertainty of the irreducible background yields due to the uncertainty of the integrated luminosity of the data sample.
Uncertainties of the fake/non-prompt lepton background arise from: i) possible differences between the values ofr and f in the regions used to measure the efficiencies and in the signal regions,ii) statistical uncertainty of the control samples used to measurer and f, andiii) uncertainties of the normalisation of the MC sample used to subtract the prompt-lepton contribution in the fake control sample used to measure f. The first uncertainty is estimated by modifying the selection criteria for the control samples. The modified sample for measuringr for electrons requires ETmiss > 175 GeV, the modified sample for measuring f for electrons requires ETmiss < 20 GeV, the modified sample for measuring r for muons requiresmT(W)>110 GeV, and the modified sample for measuring f for muons requiresETmiss<20 GeV and ETmiss +mT(W) < 60 GeV. The second uncertainty is estimated by dividing the control samples randomly into four subsamples, computing the efficiencies in each of them, and observing the variation in the fake/non-prompt lepton yield. This variation is then divided by two since each of the subsamples has only one fourth of the statistics of the full sample. This procedure accounts for any correlations in the efficiencies. The third uncertainty is estimated by varying the normalisation of the MC subtraction in the fake control sample by 10%. The resulting uncertainty depends on the region the fake/non-prompt lepton background is estimated in, since the fake sample can vary kinematically, but is generally around 40−50% of the expected fake/non-prompt lepton yield for the dominant uncertainty in the signal regions. The first is the dominant uncertainty, particularly from variations in the fake-lepton efficiency when the selection criteria for the control samples are changed.
in the fake/non-prompt background that is subtracted when calculating the charge misidentification rates (≈ 10%). This component of the uncertainty is anti-correlated between the fake/non-prompt and charge mis-ID backgrounds.
[image:20.595.81.530.299.505.2]Since the optimised selection criteria result in small expected background yields in the signal regions, the dominant uncertainty in the analysis is statistical. Among the systematic uncertainties, the leading contributors are from uncertainties of the fake/non-prompt lepton background estimate, the modelling of the irreducible backgrounds (in terms of both their production cross-sections and acceptance) and uncertainties of the efficiency for identifying b-jets. Summaries of the leading sources of systematic uncertainty in each signal region are provided in Tables8and10for the total background yield, and in Tables9and11for representative signal models (aTvector-like quark withmT =1 TeV, and exclusivett production withmV =2 TeV, respectively).
Table 8: Uncertainty of the total background yields in the signal regions for the four-top-quark and VLQ searches due to the leading sources of systematic uncertainty.
Uncertainty SR1b2` SR2b2` SR3b2`_L SR3b2` SR1b3` SR2b3` SR3b3`_L SR3b3`
source [%] [%] [%] [%] [%] [%] [%] [%]
Jet energy 3 1 5 6 3 5 3 4
resolution
Jet energy scale 3 3 9 6 3 5 11 6
b-tagging 5 3 6 7 3 4 9 9
efficiency
Lepton ID 2 1 1 1 3 3 2 3
efficiency
Pile-up 5 2 3 3 3 5 1 6
reweighting
Luminosity 1 1 2 2 2 2 2 2
Fake/non-prompt 20 12 13 8 7 2 3 1
Charge mis-ID 2 3 1 2 - - -
-Cross-section 25 13 22 32 32 26 21 24
Table 9: Uncertainty of the event yields in the signal regions for a representative signal (vector-likeT quark,
mT =1 TeV) due to the leading sources of experimental systematic uncertainty. The expected yield for this signal
in each region is also given.
Uncertainty SR1b2` SR2b2` SR3b2`_L SR3b2` SR1b3` SR2b3` SR3b3`_L SR3b3`
source [%] [%] [%] [%] [%] [%] [%] [%]
Jet energy <1 1 6 4 <1 <1 24 <1 resolution
Jet energy scale 2 1 23 3 1 1 12 <1
b-tagging 6 3 9 8 5 4 7 8
efficiency
Lepton ID 2 2 1 2 3 3 2 3
efficiency
Luminosity 2 2 2 2 2 2 2 2
Pile-up 3 3 7 3 <1 <1 3 2
reweighting
Expected yield 1.7 2.1 0.08 1.0 3.0 3.2 0.03 1.8
Table 10: Uncertainty of the total background yields in the signal regions for the same-sign top-quark pair production search due to the leading sources of systematic uncertainty.
Source SRttee SRtteµ SRttµµ [%] [%] [%]
Jet energy resolution 3 <1 13
Jet energy scale 2 2 9
b-tagging efficiency 1 2 3 Lepton ID efficiency <1 1 4 Pile-up reweighting 2 2 4
Luminosity <1 1 2
Fake/non-prompt 36 17 5
Charge mis-ID 12 5
[image:21.595.185.424.527.668.2]Table 11: Uncertainty of the event yields in the signal regions for a representative signal of the same-sign top-quark pair production search (exclusivett production,mV =2 TeV normalised to 100 fb) due to the leading sources of experimental systematic uncertainty. In all three channels, the uncertainty due to jet energy resolution is compatible with the statistical uncertainty of the simulated samples.
Source SRttee SRtteµ SRttµµ [%] [%] [%]
Jet energy resolution 7 < 1 < 1 Jet energy scale 1 1 < 1
b-tagging efficiency 3 2 < 1
Lepton ID efficiency 5 3 4
Luminosity 2 2 2
Pile-up reweighting 3 < 1 1
10 Results
To test for the presence of a BSM signal, the observed numbers of events in a set of signal regions are compared with the expected background yields in those regions. The searches for VLQ and four-top-quark production use the combination of the signal regions defined in Table2, while the searches forttproduction use the combination of the signal regions defined in Table4. In the case where the SM four-top-quark production is probed, this process is removed from the background contribution. In all other cases, the quoted significances refer to BSM benchmarks.
A Poisson likelihood ratio test is used to assess the probability that the observed yields are compatible with the sum of the expected background and signal, with the nominal signal cross-section scaled by a valueµ. Systematic uncertainties are introduced as nuisance parameters that have Gaussian or log-normal constraints corresponding to their uncertainty values. For any given choice ofµthe likelihood ratioqµ
is compared with the distribution of values that would be expected under the background-only and signal plus background hypotheses. The probabilitiespb(µ)of the background fluctuating to be more signal-like than the data, andps+b(µ)of the signal plus background fluctuating to be more background-like than the data are both by comparingqµwith these distributions. The values ofpb(µ)andps+b(µ)are derived using the asymptotic approximation described in Ref. [59]. The quantityRCLs[60] is then defined as
RCLs(µ) ≡ ps+b(µ)
1−pb(µ)
.
If the data are statistically consistent with the background expectation, RCLs(µ)will tend to decrease as
µincreases. All values of µ for which RCLs(µ) is less than 0.05 are considered as being excluded at
95% confidence level (CL). If, for a particular signal model,RCLs(µ= 1)is less than 0.05, that model is
excluded.
The observed yields in each of the signal regions, along with the expected yields from background sources and some representative BSM physics models are shown in Tables12and13and in Figure7. There are no statistically significant differences between the event yields and the expected background, although in two of the signal regions, SR3b2`_L and SR3b3`_L, the event yield exceeds the background by 1.7 and 1.8 standard deviations, respectively. The resulting combined significance depends on the signal being considered, reaching 3.0 standard deviations for SM four-top-quark production (where this contribution is not included among the backgrounds), while a significance of 0.9 standard deviations is expected. More than half of the excess is observed in events with two muons, threeb-tagged jets andHT around 700 GeV. The largest significance for any of the BSM models considered is 2.3 standard deviations, which is obtained for the 2HDM model. Therefore no evidence of BSM signals is found, and limits are set as detailed below.
Several studies were done to validate the background estimate. One potential issue was noted when applying the matrix method for muons to the same sample of events used to calculate the fake/non-prompt muon efficiency, where the predicted yield was observed to deviate from data at the level of 1.2 standard deviations near ∆R(µ,jet) = 1.0. Applying a two-dimensional parameterisation of the efficiencies in
pT,µ×∆R(µ,jet)substantially improves the level of agreement, and the background in the signal regions
presence or absence of ab-tagged jet), and also using a completely different set of control regions (dilepton events where a tag-and-probe procedure was applied). The fake/non-prompt lepton background was also estimated using the fake-factor method [61] instead of the matrix method. The level of compatibility between the expected background and observed data yields was similar in all of these variations.
Further, the events in the signal regions were scrutinised to determine if some of them might have arisen from detector defects or other anomalies. The distribution of objects inη, φ, and pT was found to be consistent with expectations, as was the temporal distribution of the events across the data-taking period. The reconstructed muon candidates in these events were inspected, and their features (such as the χ2 of their fitted tracks, and compatibility of the momenta measured in the inner detector and the muon spectrometer) were found to be unremarkable. The three-lepton samples were split between those with and without a lepton pair that formed aZ-boson candidate. In the subsample with aZ-boson candidate, four events are observed with an expected background of 2.4±0.6, while in the subsample without a
Z-boson candidate, five events are observed with an expected background of 1.7±0.6. The composition
Table 12: Expected background and observed event yields in the signal regions for the vector-like quark and four-top-quark searches. The ‘Other bkg’ category contains contributions from all rare SM processes listed in Section6. The first uncertainty is statistical and the second is systematic. The BSM significance is the number of standard deviations by which a BSM signal plus background hypothesis is preferred to the background-only hypothesis. Since this significance depends only on the event yield and expected background in the given signal region, it is independent of the BSM model. When computing the SMt¯ttt¯significance, the expected SMttt¯t¯yield is not included in the expected background. Both significances are calculated using the same procedure used to calculate the reported limits.
Source SR1b2` SR2b2` SR3b2`_L SR3b2`
ttW¯ 2.04±0.14±0.49 2.68±0.15±0.55 0.95±0.11±0.31 0.40±0.06±0.10
tt Z¯ 0.58±0.08±0.10 0.95±0.11±0.17 0.72±0.11±0.19 0.11±0.05 +−00..1310
Dibosons 3.2 ±1.5 ±2.4 <0.5 0.13± 0.13 +−00..2700 <0.5
ttH¯ 0.56±0.07±0.07 0.57±0.10±0.09 0.91±0.11±0.22 0.19±0.05±0.07
ttt¯t¯ 0.10±0.01±0.05 0.44±0.03±0.23 1.46±0.05±0.74 0.75±0.04±0.38
Other bkg 0.52±0.07±0.14 0.68±0.09±0.24 0.47±0.08±0.18 0.20±0.04±0.06
Fake/non-prompt 4.1 +−11..64 ±2.4 2.5
+1.0
−0.9±1.1 1.2
+0.9
−0.7 ±0.6 0.20
+0.46
−0.20±0.16
Charge mis-ID 1.17±0.10±0.27 1.29±0.10±0.28 0.32±0.04±0.09 0.21±0.04±0.04
Total bkg 12.3 +−22..21 ±3.4 9.1 +−11..21±1.2 6.2 +−10..08 ±1.2 2.0 +−00..52 ±0.3
Data yield 14 10 12 4
BSM significance 0.31 0.25 1.7 1.1
SMttt¯t¯significance 0.33 0.38 2.1 1.6
Source SR1b3` SR2b3` SR3b3`_L SR3b3`
ttW¯ 0.66±0.08±0.20 0.38±0.05±0.11 0.21±0.05± 0.09 0.15±0.04±0.05
tt Z¯ 2.66±0.15±0.43 1.90±0.14±0.42 2.80±0.17± 0.58 1.47±0.14±0.28
Dibosons 2.3 ±0.7 ±1.7 0.22±0.16±0.27 <0.5 <0.5
ttH¯ 0.30±0.04±0.04 0.28±0.05±0.05 0.38±0.06± 0.07 0.10±0.03±0.02
ttt¯t¯ 0.06±0.01±0.03 0.13±0.02±0.06 0.58±0.04± 0.29 0.59±0.03±0.30
Other bkg. 1.37±0.13±0.45 0.65±0.10±0.27 0.17±0.09± 0.10 0.31±0.07±0.11
Fake/non-prompt 1.0 +−00..65 ±0.6 0.14
+0.31
−0.12±0.09 0.00
+0.38
−0.00
+0.09
−0.00 0.03
+0.15
−0.02±0.00
Total bkg 8.3 +−00..98 ±1.8 3.7
+0.6
−0.3 ±0.4 4.2
+0.4
−0.2 ± 0.7 2.7 ±0.2 ±0.5
Data yield 8 4 9 3
BSM significance −0.09 0.14 1.8 0.19
Event Yield 0 5 10 15 20 25 Data Fake/non-prompt Charge mis-ID Z t t H t t W t t Dibosons t t t t Other bkg
1TeV (44 fb) T T
CI (40 fb) t t t t Total bkg unc.
ATLAS
-1
= 13 TeV, 36.1 fb s
SS dilepton / trilepton VLQ/4top Signal Regions
SR1b2l SR2b2l SR3b2l_LSR3b2l SR1b3l SR2b3l SR3b3l_LSR3b3l Data / Pred. 0
1 2 (a) Event Yield 1 10 2 10 3 10 4 10 5 10 Data Fake/non-prompt Charge mis-ID Z t t H t t W t t Dibosons t t t t Other bkg Total bkg unc.
ATLAS
-1
= 13 TeV, 36.1 fb s
SS dilepton / trilepton VLQ/4top Validation Regions
VR1b2l VR2b2l VR3b2l VR1b3l VR2b3l VR3b3l Data / Pred. 0.5
1 1.5 (b) Event Yield 0 5 10 15 20 25 30 35 40 Data Fake/non-prompt Charge mis-ID Z t t H t t W t t Dibosons t t t t Other bkg on-shell (100fb) u tt off-shell (100fb) u tt tt (100fb) Total bkg unc.
ATLAS
-1
= 13 TeV, 36.1 fb s
SS dilepton
SStt Validation/Signal Regions
VRtt SRttee SRtteµ SRttµµ
Data / Pred. 0 0.5 1 1.5 2
[image:26.595.82.523.230.542.2](c)
Table 13: Expected background and observed event yields in the signal regions for the same-sign top-quark pair production search. The ‘Other bkg’ category includes contributions from all rare SM processes listed in Section6. The first uncertainty is statistical and the second is systematic. The significance is the number of standard deviations by which thettsignal plus background hypothesis is preferred to the background-only hypothesis. It is calculated using the same procedure used to calculate the reported limits.
Source SRttee SRtteµ SRttµµ
ttW¯ 0.91±0.09±0.19 2.64±0.15±0.48 1.86±0.13±0.37
tt Z¯ 0.35±0.07±0.09 0.91±0.09±0.12 0.47±0.08±0.09
Dibosons 0.40±0.45±0.09 1.4 ±0.6 ±0.9 0.5 ±0.5 ±0.5
ttH¯ 0.19±0.06±0.02 0.53±0.08±0.08 0.58±0.07±0.05
ttt¯t¯ 0.12±0.02±0.06 0.30±0.02±0.15 0.22±0.03±0.11
Other bkg 0.29±0.06±0.13 0.51±0.08±0.16 0.33±0.08±0.12 Fake/non-prompt 3.4 +−21..17 ±2.5 3.3 −+11..21±2.1 0.20 −+00..2420±0.18 Charge mis-ID 1.90±0.11±0.91 2.69±0.14±0.59 N/A
Total bkg. 7.5 +−21..28 ±2.7 12.2 ±1.3 ±2.5 4.2 +−00..66 ±0.7
Data yield 9 13 8
Limits on B- andT-quark pair production are set in two scenarios. In the first, it is assumed that the branching ratios are given by the singlet model of Ref. [2]. These branching ratios vary slightly with the VLQ mass; they are approximately(0.48,0.27,0.25)forB → (Wt,Z b,Hb)and(0.49,0.22,0.27)for
T → (W b,Zt,Ht). The resulting 95% CL upper limits on the production cross-section as a function of
the VLQ mass are shown in Figure8. Lower limits on the B- andT-quark masses are extracted from these cross-section limits, resulting in observed (expected) excluded massmB < 1.00 TeV (1.01 TeV) andmT < 0.98 TeV (0.99 TeV). The expected and observed limits agree well in spite of the observed excesses in some signal regions because the expected yield of VLQ in those regions is small. In the second scenario, no assumptions are made about the branching ratio, and lower limits on the masses are determined for any possible set of branching ratios, as shown in Figure9.
400 600 800 1000 1200 1400
[GeV] B m 2 − 10 1 − 10 1 10 ) [pb] B B → (pp σ Observed limit Expected limit σ 1 ± σ 2 ± Theory (NNLO) All limits at 95% C.L. -1
= 13 TeV, 36.1 fb s
SS dilepton / trilepton + b-jets
ATLAS
(a)
400 600 800 1000 1200 1400
[GeV] T m 2 − 10 1 − 10 1 10 ) [pb] T T → (pp σ Observed limit Expected limit σ 1 ± σ 2 ± Theory (NNLO) All limits at 95% C.L. -1
= 13 TeV, 36.1 fb s
SS dilepton / trilepton + b-jets
ATLAS
[image:28.595.83.525.256.434.2](b)
Figure 8: Expected and observed limits on (a) vector-likeB- and (b)T-quark pair production as a function of mass, assuming the branching ratios expected in the singlet model. The expected 95% CL limits are shown as a continuous line with their±1 and±2 standard deviation bands, and the NNLO theory prediction is shown as a continuous line.
Since a singleT5/3 quark could decay into a same-charge lepton pair, limits on both single and pair production ofT5/3 quarks are set. If only pair production is considered, then the cross-section limit as a function of mass is unambiguous since the only allowed decay channel isT5/3 → Wt, as shown in Figure10(a). The corresponding lower observed (expected) limit on theT5/3-quark mass is 1.19 TeV (1.21 TeV). If single production is considered in addition to pair production, the limit depends on the assumed strength of theT5/3tWcoupling, as shown in Figure10(b).
0 0.1 0.2 0.3 0.4 0.5 0.6 0.7 0.8 0.9 1 Wt) → BR(B 0 0.1 0.2 0.3 0.4 0.5 0.6 0.7 0.8 0.9 1 Hb) → BR(B 500 600 700 800 900 1000 1100 1200 1300 1400
95% CL mass limit [GeV]
800 900 1000 1100 ATLAS -1 13 TeV, 36.1 fb SS dilepton / trilepton + b-jets
SU(2) Singlet Expected limit
(a)
0 0.1 0.2 0.3 0.4 0.5 0.6 0.7 0.8 0.9 1 Wt) → BR(B 0 0.1 0.2 0.3 0.4 0.5 0.6 0.7 0.8 0.9 1 Hb) → BR(B 500 600 700 800 900 1000 1100 1200 1300 1400
95% CL mass limit [GeV]
800 900 1000 1100 ATLAS -1 13 TeV, 36.1 fb SS dilepton / trilepton + b-jets
SU(2) Singlet Observed limit
(b)
0 0.1 0.2 0.3 0.4 0.5 0.6 0.7 0.8 0.9 1 Wb) → BR(T 0 0.1 0.2 0.3 0.4 0.5 0.6 0.7 0.8 0.9 1 Ht) → BR(T 500 600 700 800 900 1000 1100 1200 1300 1400
95% CL mass limit [GeV]
800 900 1000 1100 ATLAS -1 13 TeV, 36.1 fb SS dilepton / trilepton + b-jets
SU(2) Singlet Expected limit
(c)
0 0.1 0.2 0.3 0.4 0.5 0.6 0.7 0.8 0.9 1 Wb) → BR(T 0 0.1 0.2 0.3 0.4 0.5 0.6 0.7 0.8 0.9 1 Ht) → BR(T 500 600 700 800 900 1000 1100 1200 1300 1400
95% CL mass limit [GeV]
800 900 1000 1100 ATLAS -1 13 TeV, 36.1 fb SS dilepton / trilepton + b-jets
SU(2) Singlet Observed limit
[image:29.595.117.529.121.471.2](d)
Figure 9: Mass hypotheses excluded at 95% CL as a function of the branching ratio: (a) expected and (b) observed limits for a vector-likeB-quark, (c) expected and (d) observed limits for a vector-likeT-quark. Contours of constant 95% CL lower mass limits are shown in white in each plot, and labelled with the mass limit in GeV. The star represents the branching ratios for the SU(2) singlet models of Ref. [2].
and pseudo-scalar Higgs bosons have equal masses and both contribute to the four-top-quark production. Limits are computed and compared with theoretical predictions at partial NNLO in QCD [62–64].
Table 14: Expected and observed 95% CL upper limits on the four-top-quark production cross-section in various models.
Observable Expected median with 1σrange Observed
SM cross-section [fb] 29.0+−128.1.2 69.2
CI cross-section [fb] 20.8+−128.1.2 38.6
CI coupling|C4t|/Λ2(TeV
−2
[image:29.595.139.468.636.710.2]400 600 800 1000 1200 1400 [GeV] 5/3 T m 2 − 10 1 − 10 1 10 ) [pb] 5/3 T 5/3 T → (pp σ Observed limit Expected limit σ 1 ± σ 2 ± Theory (NNLO) All limits at 95% C.L. -1
= 13 TeV, 36.1 fb s
SS dilepton / trilepton + b-jets
ATLAS (a) [GeV] 5/3 T m 1000 1200 1400 1600 1800 2000 2200
t W Coupling
5/3 T 0 0.1 0.2 0.3 0.4 0.5 0.6 0.7 0.8 0.9 1 Excluded region Observed Expected σ 1 ± σ 2 ±
All limits at 95% C.L.
ATLAS
-1
= 13 TeV, 36.1 fb s
SS dilepton / trilepton + b-jets pair and single production
5/3
T
(b)
Figure 10: (a) Expected and observed limits on vector-likeT5/3pair production as a function of mass. The NNLO
theory prediction is shown as the continuous line. (b) Expected and observed limits on vector-likeT5/3single- plus
pair-production as a function of mass andT5/3tW coupling. In both plots, the expected 95% CL limits are shown
with their±1 and±2 standard deviation bands and it is assumed that the branching ratioB(T5/3→Wt)=100%.
[image:30.595.82.525.111.285.2]