UNIVERSITI TEKNIKAL MALAYSIA MELAKA
DEVELOPMENT A LIQUID SENSOR USING FIBER OPTIC FOR ENGINE LUBRICATION OIL AND OPTIMIZATION USING DESIGN OF
EXPERIMENT (D.O.E) TECHNIQUE
This report submitted in accordance with requirement of the Universiti Teknikal Malaysia Melaka (UTeM) for the Bachelor Degree of Electronic Engineering
Technology
(Telecommunication) (Honours.)
By
MUHAMMAD NURFAIDHI BIN MAHFOR
B071310334
910817146489
ii
UNIVERSITI TEKNIKAL MALAYSIA MELAKA
BORANG PENGESAHAN STATUS LAPORAN PROJEK SARJANA MUDA
TAJUK: Development A Liquid Sensor Using Fiber Optic for Engine
Lubrication Oil and Optimization Using Design of Experiment (D.O.E)
Technique
SESI PENGAJIAN: 2016/2017 Semester 1
Saya
MUHAMMAD NURFAIDHI BIN MAHFORmengaku membenarkan Laporan PSM ini disimpan di Perpustakaan Universiti Teknikal Malaysia Melaka (UTeM) dengan syarat-syarat kegunaan seperti berikut:
1. Laporan PSM adalah hak milik Universiti Teknikal Malaysia Melaka dan penulis. 2. Perpustakaan Universiti Teknikal Malaysia Melaka dibenarkan membuat salinan
untuk tujuan pengajian sahaja dengan izin penulis.
3. Perpustakaan dibenarkan membuat salinan laporan PSM ini sebagai bahan pertukaran antara institusi pengajian tinggi.
4. **Sila tandakan ( )
SULIT
TERHAD
TIDAK TERHAD
(
Mengandungi maklumat yang berdarjah keselamatan atau kepentingan Malaysia sebagaimana yang termaktub dalamAKTA RAHSIA RASMI 1972)
(Mengandungi maklumat TERHAD yang telah ditentukan oleh organisasi/badan di mana penyelidikan dijalankan)
Alamat Tetap:
No 31 Jalan Melati, Kampung Sungai Tua Baru
Selayang, 68100 Batu Caves,
Selangor,
Disahkan oleh:
Cop Rasmi:
Tarikh
: ___________________
iii
DECLARATION
I hereby, declared this report entitle
Development a Liquid Sensor Using Fiber Optic for Engine Lubrication Oil
and Optimization Using Design of Experiment (D.O.E) Technique is the result
of my own research except as cited in reference
Signature : ……….
Author’s Name : MUHAMMAD NURFAIDHI BIN MAHFOR
iv
APPROVAL
This report is submitted to the Faculty of Engineering Technology of UTeM as a partial fulfilment of the requirements for the degree of Bachelor of Electronic
Engineering Technology (Telecommunication) (Hons). The member of the supervisory us as follow:
v
ABSTRAK
vi
ABSTRACT
vii
DEDICATION
Specially dedicated to,
viii
ACKNOWLEDGEMENT
First and foremost, I would like to express my greatest gratitude to my project supervisor, Associate Mrs. Aminah Binti Ahmad, for all the great supervision, supports, advises and guidance that help me lots with my final year project. His valuable advice is really useful for me.
Besides, I wish to express my profound gratitude to Md Ashadi Bin Md Johari, the co-supervisor for my research for his good cooperation. He has allowed me to obtain the knowledge about fiber optic sensor and I’ve taken lots of advice from he. I will never forget his kindness.
I also wish to thank the Laboratory Technicians, En Izwan Bin Hamdan that help me lots in preparing the suitable equipment for conducting the test. They also help me lots while collecting sample in the field. With their help, my works become easier. Thanks to both of you!
Not forget to thanks all of the postgraduate students for their help, cares and advice who have given me useful guidance on writing the thesis.
For my parents, you are the best “things” that I have. I don’t know what is the best word to describe your patience, love and cares towards me. Thanks for your moral support and encouragement.
ix
TABLE OF CONTENT
DECLARATION ... iii
APPROVAL ... iv
ABSTRAK ... v
ABSTRACT ... vi
DEDICATION ... vii
ACKNOWLEDGEMENT ... viii
CHAPTER 1: INTRODUCTION ... 1
1.1 Project Background ... 1
1.2 Problems Statement ... 2
1.3 Project Objectives ... 2
1.4 Project Scope ... 2
1.5 Summary ... 3
CHAPTER 2: LITERATURE REVIEW ... 4
2.1 Introduction ... 4
2.2 Basic System of Communication ... 4
2.2.1 Transmitter ... 5
2.2.2 Channel ... 6
2.2.3 Receiver ... 6
2.3 Fibre Optic ... 6
2.3.1 Basic Fiber Optic Communication System ... 6
2.3.2 How Does Fiber Optic Work? ... 7
2.3.3 Critical Angle ... 9
x
2.4 Type of Fiber Optic ... 10
2.4.1 Multimode Step-Index (MMF) ... 10
2.4.2 Graded-Index ... 11
2.4.3 Single Mode Step- Index ... 11
2.5 Advantages of Fiber Optic ... 13
2.5.1 Long-distance signal transmission ... 13
2.5.2 Large bandwidth, light weight, and small diameter... 13
2.5.3 Non conductivity... 14
2.5.4 Security ... 14
2.5.5 Designed for future application needs ... 14
2.6 Light Source ... 15
2.6.1 Nonlinear Pulse Propagation. ... 15
2.6.2 Linear Pulse Propagation. ... 16
2.7 Fiber Optic Sensor ... 16
2.7.1 Advantage of fiber optic sensors ... 17
2.7.2 Fiber Optic Sensor Principles ... 18
2.7.3 Based on the application, a fiber optic sensor can be classified as follows………...19
2.7.4 Intensity based fiber optic sensors. ... 19
2.8 Lubrication oil ... 20
2.8.1 Lubrication ... 20
2.8.2 Classification of lubricating oils ... 21
2.9 Lubricant Selection ... 22
2.9.1 Term in lubrication oil ... 22
2.9.2 Mineral oil... 23
2.9.3 Properties of mineral oil ... 23
xi
2.9.5 Boiling Point ... 24
2.9.6 Oxidation Stability ... 25
2.9.7 Quenching Speed ... 25
2.10 Design of Experiment ... 26
2.10.1 Random design ... 26
2.10.2 Orthogonal design ... 27
2.11 DESIGN EXPERT ... 30
2.12 Summary ... 31
CHAPTER 3 : METHODOLOGY ... 32
3.1 Introduction ... 32
3.2 Identify The Problem ... 32
3.3 Project Planning ... 33
3.3.1 Title Finding ... 34
3.3.2 Literature review ... 34
3.3.3 Raw material ... 34
3.3.4 Development for fiber optic sensor ... 39
3.3.5 Testing the sensor ... 41
3.3.6 Analyse the result... 41
3.3.7 Method of analyse the result ... 42
3.3.8 Analyse using design of experiment ... 42
3.3.9 Conclusion from the result. ... 43
3.3.10 Report writing ... 44
3.4 Summary ... 44
CHAPTER 4 : RESULT AND DISCUSSION ... 45
4.1 Project overview... 45
4.2 Optical Sensor Diagram ... 45
xii
4.4 Fiber Optic Mineral Oil Sensor Data Collection ... 47
4.5 Analysis of Design Expert Result ... 48
4.6 Analysis of Half – Normal Plot ... 49
4.7 Analysis of Normal Plot ... 50
4.8 Analysis of Normal Plot Residuals ... 51
4.9 Analysis of Residual Vs Predicted ... 52
4.10 Analysis of Residual Vs Run ... 53
4.11 Analysis of Factor Interaction of Type of Fiber... 54
4.12 Analysis of Factor interaction of Light Sources ... 55
4.13 Analysis of Factor Interaction of Type of Fiber and Light source ... 56
4.14 Optimization Design ... 57
4.15 Regression Model ... 58
4.15.1 Final Equation Terms of Coded Factors: ... 58
4.16 Final selected Factors: ... 58
4.17 Summary ... 59
CHAPTER 5 ... 60
5.1 Conclusion ... 60
5.2 Recommendation... 61
REFERENCE ... 62
xiii
LIST OF TABLE
TABLE 2.1:CHARACTERISTIC BETWEEN LED AND LASER ... 15
TABLE 2.2:TERM OF LUBRICATION OIL ... 23
TABLE 2.3:PROPERTIES OF COMMERCIAL MINERAL OILS ... 24
TABLE 2.4:THE 23 DESIGN (MONTGOMERY, 2013) GEOMETRIC VIEW, DESIGN MATRIX AND TABLE. ... 30
TABLE 2.5:THE ALGEBRAIC SIGN FOR CALCULATING EFFECTS IN THE 23 DESIGN (MONTGOMERY, 2013). ... 30
TABLE 3.1:VARIABLE OF THE EXPERIMENT ... 43
TABLE 3.2:MATRIX DESIGN OF EXPERIMENT ... 43
TABLE 4.1:TABLE AND THE SIGNAL TO NOISE FROM THE TABLE OF VARIABLE... 46
TABLE 4.2:RESULT OF MINERAL OIL POWER OUTPUT MEASUREMENTS ... 47
xiv
LIST OF FIGURE
FIGURE 2.1:ANALOGUE COMMUNICATION ... 4
FIGURE 2.2:DIGITAL COMMUNICATION... 5
FIGURE 2.3::BASIC FIBER OPTIC COMMUNICATION SYSTEM ... 7
FIGURE 2.4: RAY OF REFRACTION ... 8
FIGURE 2.5: SNELL’S LAW ... 9
FIGURE 2.6:TOTAL INTERNAL REFLECTION ... 9
FIGURE 2.7:MULTIMODE STEP INDEX ... 11
FIGURE 2.8:GRADED INDEX ... 11
FIGURE 2.9:SINGLE MODE STEP INDEX ... 12
FIGURE 2.10:EXTRINSIC OR HYBRID FIBER OPTIC SENSORS: LIGHT TRANSMITS INTO AND OUT OF THE FIBER TO REACH THE SENSING REGION. ... 16
FIGURE 2.11: INTRINSIC OR ALL-FIBER FIBER OPTIC SENSORS: THE ENVIRONMENTAL EFFECT IS CONVERTED TO A LIGHT SIGNAL WITHIN THE FIBER ... 17
FIGURE 2.12:BASIC COMPONENTS OF AN OPTICAL FIBER SENSOR SYSTEM. ... 18
FIGURE 2.13:EXTRINSIC AND INTRINSIC TYPES OF FIBER OPTIC SENSORS. ... 18
FIGURE 2.14:INTRINSIC FIBER OPTIC SENSOR ... 20
FIGURE 2.15:RANDOM DESIGN ... 27
FIGURE 2.16:ORTHOGONAL DESIGN ... 27
FIGURE 2.17:EXAMPLE OF FACTORIAL DESIGN ... 29
FIGURE 3.1:FLOW CHART FOR THIS PROJECT ... 33
FIGURE 3.2:FIBER OPTIC STRUCTURE ... 35
FIGURE 3.3:PIGTAIL CABLE ... 35
FIGURE 3.4: FUSION STATE AND SPLICER EQUIPMENT ... 36
FIGURE 3.5:FIBER OPTIC SENSOR STRUCTURE ... 36
FIGURE 3.6:OPTICAL SPECTRUM ANALYSER ... 37
FIGURE 3.7:AMPLIFIED SPONTANEOUS EMISSION ... 37
FIGURE 3.8:CHART FOR DETERMINE WHICH BRAND THAT WILL USE ... 38
FIGURE 3.9:TOOL BOX ... 38
xv
FIGURE 3.11:STRIPPING THE CLADDING OF FIBER ... 40
FIGURE 3.12:CLEAVING THE CORE OF THE FIBER ... 40
FIGURE 3.13:FUSION STATE LEFT PICTURE SHOW BEFORE AND RIGHT SHOW AFTER FUSION. ... 40
FIGURE 3.14:LEFT PICTURE SHOW THAT MINERAL OIL IS TESTED TO THE FIBER AND LEFT PICTURE SHOW THE FULL SCALE OF TESTING THE SENSOR ... 41
FIGURE 3.15:FLOW CHART OF DOE USING FACTORIAL DESIGN ... 42
FIGURE 4.1:SINGLE-MODE OPTICAL FIBER SENSOR ... 45
FIGURE 4.2:MULTI-MODE OPTICAL FIBER SENSOR ... 46
FIGURE 4.3:GRAPH OF RUN TIME VERSUS POWER ... 48
FIGURE 4.4:GRAPH IS SIGNIFICANT ... 49
FIGURE 4.5:P-VALUE FOR THE GRAPH ... 50
FIGURE 4.6:GRAPH IS SIGNIFICANT ... 51
FIGURE 4.7:NORMAL PLOT OF RESIDUALS GRAPH ... 52
FIGURE 4.8:RESIDUALS VERSUS PREDICTED IDEAL GRAPH ... 53
FIGURE 4.9:RESIDUALS VERSUS RUN TIME GRAPH ... 54
FIGURE 4.10:ONE FACTOR GRAPH FOR TYPE OF FIBER. ... 55
FIGURE 4.11:ONE FACTOR GRAPH FOR LIGHT SOURCE. ... 56
xvi
LIST OF SYMBOL AND ABBREVIATIONS
DOE = Design of Experiment
OFAT = One Factor at a Time Method TQM = Total Quality Management TPM = Target Performance Measure NPM = Noise Performance Measure LED = Light Emitting Diode FFD = Full Factorial Design DFSS = Design for Six-Sigma
IDDM = Insulin Dependent Diabetes Mellitus NIDDM = Non-Insulin Dependent Diabetes Mellitus
MMF = Multi-Mode Strands
SMF = Single-Mode Strands
PCS = Plastic-Clad Silica
ASE = Amplified Spontaneous Emission OSA = Optical Spectrum Analyzer ANOVA = Analysis of Variance
LRIS = Liquid Refractive Index Sensor SPR = Surface Plasmon Reverberation
dB = Decibel
1
INTRODUCTION
Project Background
A lubrication is a substance that being used to reduce the friction between surfaces in a certain area, in other word it reduces the heat that being generated when a surface contact with each other. It might likewise have the capacity of transmitting powers, transporting remote particles, or warming and cooling the surfaces. This property to reduce the friction is well known as lubricity. In addition, big industrial application, use lubrication for many different purpose.
In a world of communication, fiber-optic is a form of transmitting data starting with one place then onto the next by sending beats of light through an optical fiber. The light structures form an electromagnetic carrier wave that is adjusted to convey data being sent. This project is to expend the use of fiber optic as a sensor not only sent data as we know today. The fiber optic sensor is used to detect the thickness of oil lubrication for a certain period of time, each time the lubrication being use by the engine it will get thick and this will damage the engine if it not changes. Therefore, fibre optic sensor will be develop to detect the suitable time for the lubrication oil to be change.
2
Problems Statement
Mineral oil is use for lubrication engine oil and importance to keep the engine in the best performance. They are many brand in market that have their advantages and disadvantages. Fiber optic sensor is develop to test the different of 2 brand in market that is mineral oil. Design of experiment will be use to analyses the optimum performance of each oil and determine the best among 2 brand.
In such many year fiber optic has a major impact in communication system but never much to know in becoming a sensor. By this project fiber optic sensor is develop to become a sensor for lubrication oil. This research is about to determine the must to know function and implement fiber optic to develop to becoming a liquid sensor for lubrication oil that is mineral oil.
Project Objectives
The main objectives in this research can be describe with three factor, which lead to project success. The objectives of the project are:
a) To study Fiber Optic Sensor (F.O.S)
b) To develop Fiber Optic Sensor to detect mineral oil
c) To analyse performance of FOS using Design of Experiment (DOE)
Project Scope
3 Analysis will be conducted by varying the parameter that is time, source light, brand of oil and type of fiber optic. This parameter is use as the main point for this research on determine the variable for the fiber optic sensor that will be test. Lastly the result can be analysed and studied and implement to a good use in daily life.
Summary
4
LITERATURE REVIEW
Introduction
This chapter states all the studies and reviews from previous projects and other sources that help to successfully design, built and implement the entire task during this project. There are some previous projects that similar to this project and can be search across the internet and paper work done by the researcher who is inspired with the optical communication. For this project, the summation is all about to develop the fiber optic sensor.
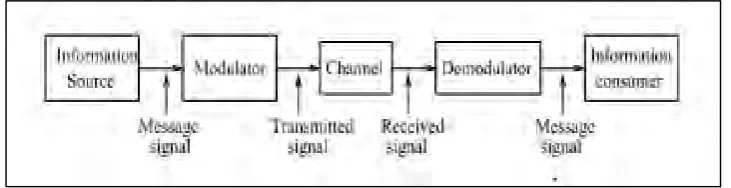
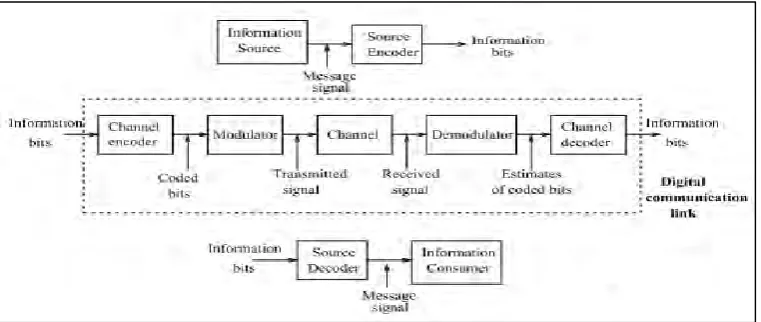
Basic System of Communication
[image:20.595.137.503.490.584.2]They have 2 type of communication that is analogue and digital
5 Figure 2.2:Digital communication
The figure above shows the basic of block diagram for communication system. Each of the block have they function. For each of the step to transmit the information to other side of the receive. As the figure about show two block diagram. Believe it or not by comparing the block diagram for analogue and digital communication respectively. The digital communication system involves far more processing. However, this is not an obstacle for modern transceiver design, due to the exponential increase in the computational power of low-cost silicon integrated circuit. By that digital communication has the advantages compare to analogue. In reality digital is more use than the analogue because the system will keep on improving. (Schiff, 2006) There are three basic system of communication which is transmitter, channel for transmit the signal and receiver to receive the signal from transmitter. This is a summery to understanding the concept of communication for a fiber optic sensor for this project. (U.Madhow, 2008)
Transmitter
6
Channel
Channel is the medium which transfer the modulated signal from the transmitter to the receiver section while on the same time air acts as the channel for broadcasting such as radio, television and Internet. Channel might also be a wiring system for example like a cable or fiber optic
Receiver
The receiver is a system which receives the transmitted signal from the channel and processes it to recover the message signal. The receiver has to be accomplished to distinguish the signals from others signal which that it might be use the same channel or tuning. Other than that, a receiver also should be able to amplify the signal for processing and demodulate to remove the carrier and then processes the input signal for reception and generate the output that being sent.
Fibre Optic
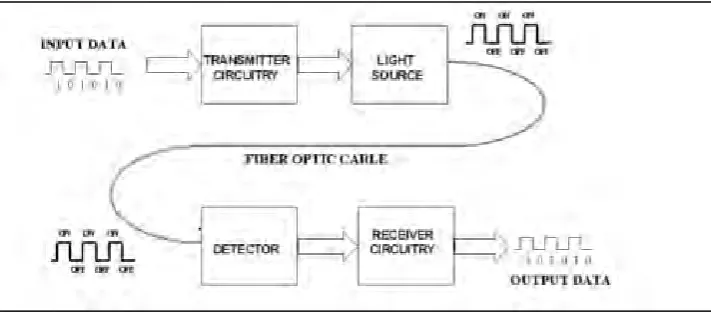
Basic Fiber Optic Communication System
7 Figure 2.3::Basic fiber optic communication system
In order to comprehend the project of fiber optic sensor on fiber optic application work, it is important to understand the components of fiber optic link, with a specific end goal to grasp how fiber optic applications work, there are four primary segments in a fiber optic connection that is:
a) Optical Transmitter b) Optical Fiber c) Connectors d) Optical Receive
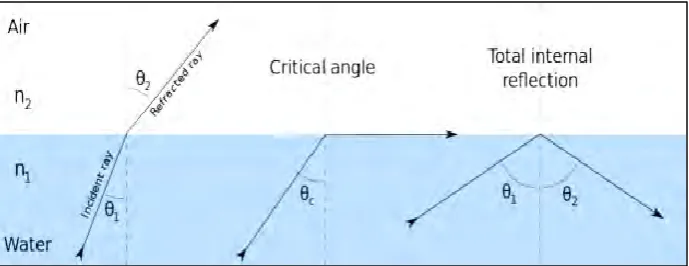
How Does Fiber Optic Work?
8 Figure 2.4: Ray of refraction
To discuss the speed of light, it normally discussing the speed in a vacuum (space), which is 3.00 x 10⁸ m/s. when light go through something else, for example, glass or plastic, it travels at a different velocity. The velocity of light in a given material is identified as index of refraction, n, which is define as the pace of light in vacuum to the rate of the light in the medium;
Index of refraction: n = c / v
At the point when light goes starting with one medium then onto the next, the speed changes, as does the wavelength. The index of refraction can also be expressed as terms of wavelength
𝒏 = 𝝀 𝝀𝒎⁄
Where λ is the wavelength in vacuum and λm is the wavelength in the medium, in spite of the fact that the velocity changes and wavelength changes, the frequency of the light will be consistent. The frequency, wavelength, and velocity are connected by:𝒗 = 𝒇𝛌. The changing in light speed that happen