stroke patients using passive movement
.
White Rose Research Online URL for this paper:
http://eprints.whiterose.ac.uk/100762/
Version: Published Version
Article:
Arvaneh, M., Guan, C., Ang, K.K. et al. (6 more authors) (2016) Facilitating motor
imagery-based brain–computer interface for stroke patients using passive movement.
Neural Computing and Applications. pp. 1-14. ISSN 0941-0643
https://doi.org/10.1007/s00521-016-2234-7
[email protected] https://eprints.whiterose.ac.uk/ Reuse
This article is distributed under the terms of the Creative Commons Attribution (CC BY) licence. This licence allows you to distribute, remix, tweak, and build upon the work, even commercially, as long as you credit the authors for the original work. More information and the full terms of the licence here:
https://creativecommons.org/licenses/
Takedown
If you consider content in White Rose Research Online to be in breach of UK law, please notify us by
O R I G I N A L A R T I C L E
Facilitating motor imagery-based brain–computer interface
for stroke patients using passive movement
Mahnaz Arvaneh1•Cuntai Guan2•Kai Keng Ang2•Tomas E. Ward3•
Karen S. G. Chua4•Christopher Wee Keong Kuah4•Gopal Joseph Ephraim Joseph4•
Kok Soon Phua2•Chuanchu Wang2
Received: 22 May 2015 / Accepted: 16 February 2016
The Author(s) 2016. This article is published with open access at Springerlink.com
Abstract Motor imagery-based brain–computer interface (MI-BCI) has been proposed as a rehabilitation tool to facilitate motor recovery in stroke. However, the calibra-tion of a BCI system is a time-consuming and fatiguing process for stroke patients, which leaves reduced time for actual therapeutic interaction. Studies have shown that passive movement (PM) (i.e., the execution of a movement by an external agency without any voluntary motions) and motor imagery (MI) (i.e., the mental rehearsal of a move-ment without any activation of the muscles) induce similar EEG patterns over the motor cortex. Since performing PM is less fatiguing for the patients, this paper investigates the effectiveness of calibrating MI-BCIs from PM for stroke subjects in terms of classification accuracy. For this pur-pose, a new adaptive algorithm called filter bank data space adaptation (FB-DSA) is proposed. The FB-DSA algorithm linearly transforms the band-pass-filtered MI data such that the distribution difference between the MI and PM data is
minimized. The effectiveness of the proposed algorithm is evaluated by an offline study on data collected from 16 healthy subjects and 6 stroke patients. The results show that the proposed FB-DSA algorithm significantly improved the classification accuracies of the PM and MI calibrated models (p\0.05). According to the obtained classification
accuracies, the PM calibrated models that were adapted using the proposed FB-DSA algorithm outperformed the MI calibrated models by an average of 2.3 and 4.5 % for the healthy and stroke subjects respectively. In addition, our results suggest that the disparity between MI and PM could be stronger in the stroke patients compared to the healthy subjects, and there would be thus an increased need to use the proposed FB-DSA algorithm in BCI-based stroke rehabilitation calibrated from PM.
Keywords AdaptationBrain–computer interface
Motor imageryPassive movementStroke rehabilitation
& Mahnaz Arvaneh
Cuntai Guan
Kai Keng Ang [email protected]
Tomas E. Ward
Karen S. G. Chua [email protected]
Christopher Wee Keong Kuah [email protected]
Gopal Joseph Ephraim Joseph [email protected]
Kok Soon Phua [email protected]
Chuanchu Wang [email protected]
1 Department of Automatic Control and Systems Engineering,
University of Sheffield, Sheffield, UK
2 Institute for Infocomm Research, Agency for Science,
Technology and Research (A*STAR), Singapore, Singapore
3 Department of Electronic Engineering, National University
of Ireland, Maynooth, Ireland
4 Department of Rehabilitation Medicine, Tan Tock Seng
1 Introduction
A brain–computer interface (BCI) provides a direct com-munication pathway between a human brain and an external device [1,2]. Using appropriate sensors and data processing algorithms, a BCI maps patterns of brain activity associated with a volitional thought onto signals suitable for communication and control [3,4]. Such tech-nology holds great promise as a basis for assisting people with severe communication and motor disabilities. More recently, BCI systems have been adapted to operate so as to encourage neurophysiological activity that might promote motor recovery in conditions such as stroke [5–7]. Several studies have demonstrated that motor imagery (MI) has a positive effect on motor rehabilitation after stroke through activation of the affected sensorimotor networks [8–10]. Since the performance of MI is internal to the subject, and thus not directly observable, BCI can facilitate the MI-based stroke rehabilitation by providing direct and imme-diate feedback on the MI performance.
In most of BCI systems, brain signals are measured by electroencephalogram (EEG), due to its low cost and high temporal resolution [2]. However, the EEG patterns used for discerning MI vary considerably between sessions even for the same subject [11]. Thus, MI-BCIs typically require the recording of labeled training data (acquired without giving feedback to the patient) during a so called calibra-tion phase at the beginning of each session. The calibracalibra-tion phase takes around 20–30 min, and is thus time-consuming and tedious, particularly for patients who require long-term BCI therapy. Hence, algorithms that require less calibration time is highly desirable for patients use.
Several approaches have been proposed in the literature to remove the calibration phase, for example, through concatenating and clustering historic spatial filters and data from the same subject [12–14], or by creating an ensemble of historic spatial filters and classifiers derived from dif-ferent subjects [15]. These methods, however, require a large amount of historic data to be available. Other tech-niques have sought to reduce the calibration phase through the use of co-adaptive methods or semi-supervised learning approaches [16–21]. These methods may initially have a limited performance, but it improves after a considerable adaptation time. Despite several studies in this issue, reducing the calibration time has still remained a chal-lenging issue.
Previous research studies have demonstrated that specific EEG synchronization (ERS), are largely similar during passive movement (PM) and MI [22–24]. There-fore, PM could potentially serve as a repeatable, and observable input to produce the stereotypical EEG patterns required for calibrating a BCI model. Since PM exercises
are a part of normal stroke rehabilitation [25], MI-based BCI rehabilitation therapy could start immediately by training the classifier using the PM data collected in the previous physical therapy session. The issue is that PM-induced EEG patterns may not be identical to those pro-duced during MI [24,26], and further, due to other inter-session variations (e.g., electrode positioning, cognitive state etc), the use of adaptive methods may be required to enhance the performance of a BCI system calibrated in this way.
To address this issue, this paper proposes a new filter bank data space adaptation (FB-DSA) algorithm to linearly transform the filter bank band-passed MI data, such that the distribution difference between the PM and MI data is minimized. This algorithm is a modified version of our previously proposed algorithm called EEG data space adaptation [27]. The performance of the proposed FB-DSA algorithm is evaluated on data collected from 6 stroke and 16 healthy subjects. The experiments performed for both the stroke and healthy subjects are based on those previ-ously practised for MI-BCI in stroke rehabilitation [5]. For the first time, this paper also provides evidence supporting that the disparity between PM and MI is significantly stronger in the stroke patients compared to the healthy subjects, and it would thus increase the need to use adap-tive algorithms such as the proposed FB-DSA algorithm in BCI-based stroke rehabilitation calibrated from PM data.
2 Methodology
2.1 Filter bank common spatial patterns (FBCSP)
Recently, the FBCSP algorithm [28] was proposed that combined a filter bank framework with the common spatial patterns (CSP) algorithm [29] to select the most discrimi-native features using a mutual information-based crite-rion [30]. In this paper FBCSP was used to classify the EEG data as it was the basis of all the winning algorithms in the EEG category of the BCI competition IV [31]. The FBCSP algorithm comprises the following steps:
1. Spectral filtering: This step uses a filter bank that decomposes the EEG data using nine equal bandwidth
filters, namely 4–8, 8–12, …, 36–40 Hz. These
frequency ranges cover most of the manually or heuristically selected settings used in the literature. 2. Spatial filtering: In this step, the EEG data from each
frequency band are spatially filtered using the CSP algorithm. Letxb 2Rns represent a single-trial EEG
data from thebth band-pass filter, wherenandsdenote
measurement samples respectively. The CSP matrix linearly transformsxb to spatially filteredZb as
Zb¼Wb xb; ð1Þ
where Wb2Rnn denotes the CSP matrix. Wb, is
generally computed by solving the eigenvalue
decomposition problem:
Cb;1Wb ¼Cb;1þCb;2WbD; ð2Þ
where Cb;1 and Cb;2 are respectively the averaged
covariance matrices of the band-passed EEG data of each class; Dis the diagonal matrix that contains the eigenvalues of ðCb;1þCb;2Þ 1Cb;1. A direction that
has a large variance in events of one class (high eigenvalue) has a small variance in events of the other class (low eigenvalue). Usually, only the first and last
mrows ofWb, corresponding to the highest and lowest
eigenvalues, are used as the most discriminative filters to perform spatial filtering [32].
3. Feature extraction: The m pairs of the CSP features corresponding to the ith trial from the bth band-pass filter are computed as [32]
fb;i¼log diag zb;izTb;i
=tr zb;izTb;i
h i
; ð3Þ
wherefb;i2R12m;zb;irepresents the first and the last mrows ofZb; diag(.) returns the diagonal elements of
the square matrix; tr[.] returns the sum of the diagonal elements of the square matrix; and the superscript T denotes the transpose operator. Since the nine fre-quency bands are used, the feature vector for the ith trial is formed as
Fi¼ ½f1;i;f2;i;. . .;f9;i; ð4Þ
where Fi2R118m. In this study, m¼2 pairs of the spatial filters were used as suggested in [28].
4. Feature selection: The last step selects four pairs of the
features from the feature vector F as the most
discriminative features using the mutual information-based best individual feature (MIBIF) algorithm [30]. The selected features are used as the inputs to the classifier.
2.2 Filter bank data space adaptation (FB-DSA)
In this work, the set of the labeled EEG trials in the cali-bration session filtered by the bth band-pass filter is denoted as Db¼ fðxb;i;yiÞg
N
i¼1, where xb;i2XbRns
denotes the ith single-trial EEG filtered by the bth filter, and yi2YR is the class label of the ith single-trial EEG. In the evaluation session, the available labeled EEG trials from the bth band-pass filter are denoted as
Db¼ fðxb;i;yiÞg N
i¼1, where xb;i2Xb Rns, and
yi2YR.
The dissimilarities between the calibration and evalua-tion sessions from the bth band-pass filter can yield dif-ferent joint distributions for the corresponding evaluation session PðXb;YÞ and calibration session PðXb;YÞ.
How-ever, changing the representation of Xb, while the
repre-sentation ofYis fixed, can change the joint distribution of the evaluation session. Following this concept, assume g: Xb !Hb as a function that transforms a
band-pass-fil-tered single-trial EEG, xb, from the evaluation space into
another spacehb¼gðxbÞ 2Hb. Thus, if for each band-pass
filter, a transformation functiongcan be computed to yield the same joint distributions for both the calibration and evaluation sessions PðHb;YÞ ¼PðXb;YÞ, the optimal
model that classifies the calibration session will be still optimal for classifying the evaluation session.
For this purpose, a linear transformation function is proposed as
hb¼VTbxb; ð5Þ
where Vb2Rnn denotes the FB-DSA transformation
matrix. The transformation matrixVb should be computed
such that the distribution difference between the evaluation session and the calibration session filtered by thebth band-pass filter is reduced.
Similar to [33], we assume that the differences between the calibration and evaluation sessions can be observed in the first two moments of the single-trial EEG (i.e., mean and covariance). Following this assumption, to simplify the problem, we only compare the average distributions of the EEG trials between the calibration session and the evalu-ation session to compute a transformevalu-ation matrix that minimizes the differences between their first two moments. Since the single-trial EEG is band-pass-filtered, it has approximately zero mean value. Consequently, the average distribution of a group of band-pass-filtered EEG trials can be defined by a zero mean and a covariance matrix computed from averaging the covariance matrices over the multiple EEG trials. Based on the maximum entropy principle, the most prudent model for modeling the distribution of the single-trial EEG that is consistent with zero mean and a covariance matrix is Gaussian [33]. Thus, the Kullback– Leibler (KL) divergence between gaussians can be used to measure the difference between the distributions.
The KL divergence between the distributions of two groups of band-pass-filtered EEG trials, presented as
N0ð0;RÞ and N1ð0;RÞ (taken as reference), has a closed
form expression
KL½N0jjN1 ¼
1 2 trðR
1
RÞ ln detðRÞ detðRÞ
d
whereRandRdenote the average covariance matrices of the two groups of the EEG trials; det and d denote the determinant function and the dimensionality of the data respectively.
Let Nð0;Rb;jÞ be the average distribution of the bth band-pass-filtered EEG trials belonging to the classjin the calibration session. Using the available labeled trials from the evaluation session Db¼ fðxb;i;yiÞg
N
i¼1, the average
distribution of the transformed EEG trials belonging to the class j and the bth filter is estimated as Nð0;VTbRb;jVbÞ,
whereVb denotes the linear transformation matrix for the
bth filtered data, and Rb;j denotes the average covariance matrix of classjin the evaluation session estimated using
Db. When the class probabilities are balanced, using the KL
divergence the optimalVbcan be computed as the solution
of the minimization problem
min
Vb
LbðVbÞ ¼min
Vb X2
j¼1
KLNð0;VTbRb;jVbÞjjNð0;Rb;jÞ
¼min
Vb X
2
j¼1
1 2
trðRb;j
1
VTbRb;jVbÞ:
ln detðV
T bRb;jVbÞ
detðRb;jÞ
! d :
ð7Þ
To minimize (7), it is sufficient to calculate the first order derivative of the loss function LbðVbÞwith respect to
Vb, and set it to zero;
dLb dVb¼
X2
j¼1 1 2
d dVb
tr Rb;j
1
VTbRb;jVb
ln det VTbRb;jVb
h i
:
ð8Þ
Thus, one solution for (8) is when (see [27] for more details)
Vb ¼pffiffiffi2 Rb;1 1
Rb;1þRb;2 1
Rb;2
y
0:5
; ð9Þ
whereydenotes the pseudoinverse of the matrix.Vbis the optimal linear transformation matrix computed for thebth filter in the FB-DSA algorithm. Therefore, Vb linearly transforms the EEG data of thebth filter from the evalua-tion session to the corresponding calibraevalua-tion session, such that the distribution difference between these sessions is minimized. As expected, in the case that the calibration and the evaluation data have similar distributions, (i.e., the average covariance matrices of the corresponding classes are equal),Vb is the identity matrix.
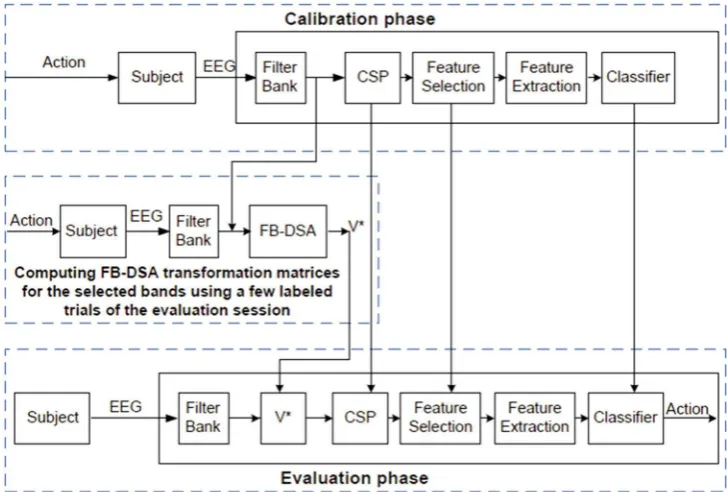
The architecture of the proposed FB-DSA algorithm in the FBCSP framework is demonstrated in Fig. 1. In the calibration phase, the FBCSP algorithm is used to train a subject-specific model using PM or MI data. In the eval-uation phase, the new trials from each band-pass filter are optimally transformed by their corresponding FB-DSA transformation matrix computed using a few past EEG trials of the evaluation session (i.e., 20 trials in this study). Subsequently, the transformed FB-DSA trials are directly applied to the corresponding CSP filters and the classifier
[image:5.595.180.544.456.702.2]trained in the calibration phase. To avoid irrelevant com-putation, it suffices to compute the FB-DSA transformation matrices only for the frequency bands which have features selected for the classification.
3 Experiments
3.1 Subjects
This study recruited 18 healthy subjects and seven hemiparetic stroke patients. Ethics committee approval was obtained from the institution’s Domain Specific Review Board, National Healthcare Group, Singapore. Informed consent were obtained from all the participants prior the study enrollment. One of the stroke patients could not commit to the whole study. Thus, the corre-sponding data were excluded. The experiments performed for both the stroke and healthy subjects were based on those previously practised for EEG-based MI-BCI in stroke rehabilitation [5]. From among the healthy sub-jects, two subjects chose to perform MI and PM of the left hand while the remaining 16 subjects chose to per-form on the right hand. For four patients, the stroke affected their left hand, while the right hand was affected in the remaining two patients.
3.2 Data description
3.2.1 Dataset collected from the healthy subjects
EEG from 27 channels was collected. The subjects were instructed to minimize physical movements and eye blinking throughout the EEG recording process. For each subject, EEG data were collected without feedback in two measurement sessions conducted on separate days. For the first day, four runs of EEG data were collected. In the first two runs, the subjects were instructed to perform MI of the chosen hand and background rest condition. Subsequently, in the next two runs, the subjects engaged in PM of the chosen hand using the haptic knob robot [34], and back-ground rest condition. Figure2 shows the experimental setup to collect EEG data, as the haptic knob robot is used to move the subject’s left hand.
The subjects were instructed to perform kinesthetic MI of the chosen hand during the first two runs. The subjects were also instructed to perform mental counting during the background rest condition. In the last two runs, the subjects were asked to relax while the move-ment of the chosen hand was performed using the haptic knob robot [34]. The instructions were on the computer screen in each trial. As shown in Fig.3, each trial lasted for 12 s, as the subject was first prepared with a cue for
2 s, then an ‘‘action’’ command instructed the subject for 4 s, and finally the subject was asked to rest for 6 s. Each run comprised of 40 trials of either MI or PM, and 40 trials of background rest condition. Considering the EEG set up time, the practice time, and the rest time between the blocks, the session on the first day took around an hour and 45 min. The EEG data from the first and second runs were used to calibrate a subject-specific model referred to as the MI model, and subsequently the EEG data from the third and fourth runs were used to calibrate a subject-specific model referred to as the PM model.
In the second day of this study, three runs of the EEG data were collected without feedback from each subject while performing MI of the chosen hand and background rest condition. Each run again comprised of 40 trials of MI and 40 trials of background rest condition. The session on the second day took around an hour and a half in total. The EEG data collected from these three runs were used to evaluate the calibrated models from the first day.
Before calibrating the subject-specific models, 10 10-fold cross-validation accuracies of the first two runs as well as the last two runs recorded on the first day were
Fig. 2 Experimental setup to collect EEG data from passive movement of the left hand using the haptic knob robot [34] for calibrating the EEG-based motor imagery BCI
[image:6.595.309.543.57.234.2] [image:6.595.306.541.290.373.2]calculated to find those subjects performing either MI or PM at chance level. Using the inverse of the binomial cumulative distribution function with 95 % confidence, the accuracy on the respective action at chance level is approximately 43–57 %. Hence, those subjects whose PM or MI data have 1010-fold cross-validation accuracies between 43 and 57 % can be excluded as their data are not proper enough for calibrating a model. The results showed that two subjects from the 18 aforementioned subjects performed MI and PM at chance level. Hence, these two subjects were removed, and the remaining 16 subjects were used for this study.
3.2.2 Dataset collected from the stroke patients
Table 1 provides more clinical information about the six stroke patients. The protocol used for EEG recording from the stroke subjects was very similar to that used for the healthy subjects. The minor differences are as follows: During the experiments, the patients performed either MI or PM of the stroke affected hand rather than the chosen hand. In addition, in the second day of this study, two runs of the EEG data were recorded from each subject while performing MI of the affected hand and rest condition without feedback. Similar to the healthy subjects, the EEG data recorded on the second day were used to evaluate the subject-specific MI and PM models calibrated using the data collected on the first day.
Before calibrating the subject-specific models, 10 10-fold cross-validation accuracies of the first two runs, as well as the last two runs recorded on the first day were used to ensure that the stroke patients performed neither PM nor MI at chance level. Consequently, the study was performed using all the 6 stroke patients.
3.3 Data processing
In this study, the FBCSP [28] algorithm was used to train the subject-specific models. First, EEG data segments from 0.5 to 2.5 s after the onset of the visual cue were used for the analysis, as a range which has been demonstrated to be effective for BCI applications [31]. Subsequent processing was carried out as described in steps 1–4, Sect.2.1. It is noted that Chebyshev Type II was used for band-pass
filtering, and for each applied CSP, m=2 pairs of the spatial filters (i.e., four filters in total) were used as sug-gested in [28]. Finally, the LDA classifier was employed in the classification step.
4 Results
4.1 Comparing the classification results
In this subsection, the performances of the subject-specific PM and MI calibration models in detecting MI versus the rest condition were examined. Further, the proposed FB-DSA algorithm was used to reduce the dissimilarities between the MI and PM data. In the FB-DSA algorithm, to classify each new trial from the evaluation session, V in (9) was computed using the immediate past 20 trials (i.e 10 trials from each class). It should be noted that the first 20 trials of the evaluation session were only used for the adaptation, and no classification was performed on these trials. The results therefore were obtained using the reminder of the evaluation session.
4.1.1 Healthy subjects
Table 2 presents the classification accuracies of detecting MI versus the rest condition for the 16 healthy subjects, using the different calibration models. The results in Table2 show that the calibration model using MI (MIcs) yielded, on average, higher classification accuracy (i.e., 67.44 %) compared to the calibration model using PM (PMcs) (i.e., 65.13 %) when no adaptation was applied. This result is supportive of the findings of the previous studies [24,35], which suggest that robot-assisted PM can be used for calibrating MI-based BCI for healthy subjects. Interestingly, in some subjects the PM models considerably outperformed the MI models (e.g.,H6). On the other hand, the results for some other exhibit a deterioration of more than 8 % in the classification accuracy when the models were calibrated using PM instead of MI (e.g.,H3,H8,H10,
H12andH14).
[image:7.595.181.544.631.692.2]Table 2 shows that the proposed FB-DSA algorithm improved the classification accuracy of the PM models by an average of 4.65 %. The results also show that the PM model adapted by the FB-DSA algorithm performed better
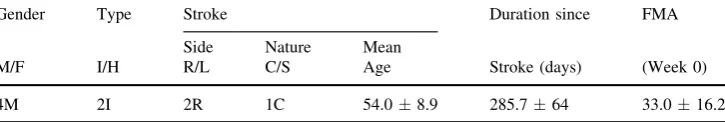
Table 1 Demographic and clinical information forN=6 stroke subjects who participated in this study
Gender Type Stroke Duration since FMA
Side Nature Mean
M/F I/H R/L C/S Age Stroke (days) (Week 0)
4M 2I 2R 1C 54.08.9 285.764 33.016.2
than the MI model with no adaptation by an average of 2.34 %. Furthermore, the MI models adapted by FB-DSA only slightly outperformed the PM models adapted by FB-DSA (i.e., on average\0.8 %).
Performing a two-way repeated-measures ANOVA test with model (No-adap vs. FB-DSA) and task (MI vs. PM) as the within-subject independent variables revealed a sig-nificant main effect of Model on the classification accura-cies [Fð1;15Þ ¼8:82;p¼0:005]. Interestingly, no
significant main effect was found for Task
[Fð1;15Þ ¼0:85;p¼0:37]. Moreover, the interaction
between Model and Task was also insignificant
[Fð1;15Þ ¼0:87;p¼0:37].
4.1.2 Stroke patients
Table3 presents the classification accuracies of detecting MI versus the rest condition for the six stroke patients, obtained by the different calibration models. Similar to the healthy subjects, the results show that the calibration model using MI (MIcs) outperformed the calibration model using PM (PMcs) in terms of the classification accuracy. The results demonstrate that the PM model adapted by FB-DSA outperformed the MI model by an average of 4.54 %. The results also show that the MI models adapted by FB-DSA performed on average 1.5 % better than the PM models adapted by FB-DSA.
Similar to the previous section, a two-way repeated-measures ANOVA test with model (No-adap vs. FB-DSA) and task (MI vs. PM) as the within-subject independent variables was performed on the classification results obtained from the stroke patients. Interestingly, a signifi-cant main effect of Model on the classification accuracies [Fð1;15Þ ¼8:82;p¼0:038] was observed. Moreover, no significant main effect was found for Task [Fð1;15Þ ¼
2:93;p¼0:15]. The interaction between Model and Task was also insignificant [Fð1;15Þ ¼0:75;p¼0:43].
We also performed a 3-way mixed design ANOVA with model (No-adap vs. FB-DSA) and task (MI vs. PM) as the within-subject independent variables and group (healthy vs. stroke subjects) as the between subject independent
variable. The results showed a significant main effect of Model on the classification results [Fð1;20Þ ¼16:88; p¼0:001]. Interestingly, the interaction between Model and Group tended to be significant [Fð1;20Þ ¼3:75; p¼0:06]. This indicates a significant larger increase in the accuracy of the stroke group compared to the healthy group when applying adaptation. As a result, the big drop in the performance of PM model compared to the MI model in the stroke patients was compensated after applying the proposed adaptation algorithm. On the contrary, the main effect of Task [Fð1;20Þ ¼3:28;p¼0:09], the interaction between Group and Task [Fð1;20Þ ¼0:67;p¼0:42], and
the interaction between Task and Model
[Fð1;20Þ ¼1:45;p¼0:24] were not significant.
4.1.3 Comparing with two existing non-adaptive algorithms:
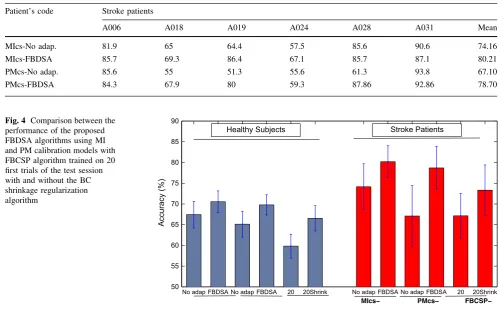
In this part, the performance of the proposed FBDSA algorithm is compared with two existing non-adaptive algorithms that are computationally as efficient as the proposed algorithm. In the first approach, the FBCSP algorithm was trained using only the first 20 trials of the test session that were previously used only for adaptation. This calibration model is called FBCSP-20. In the second approach, again the first 20 trials of the test session were used for training a FBCSP model, whereas the covariance matrices for computing CSP were estimated using the BC shrinkage algorithm [36]. This calibration model is called FBCSP-20Shrink. BC shrinkage is a computationally effi-cient algorithm to estimate covariance matrices without requiring time-consuming cross-validation procedures. Interestingly, BC shrinkage is shown to be very effective when the number of samples is limited [36]. To apply the BC shrinkage algorithm, as suggested in [36], for each subject, the average of the class covariances of the other subjects was used as the shrinkage target.
[image:8.595.55.546.95.184.2]Figure4 shows that the proposed FBDSA algorithm trained using either the MI or PM data outperformed the FBCSP-20 and FBCSP-20Shrink algorithms. The paired t-tests on the healthy group showed that FBCSP-20
Table 2 Classification accuracies of the motor imagery sessions for healthy subjects using motor imagery calibration models without and with adaptation (denoted as MIcs-No adap., and MIcs-FBDSA) and
passive movement calibration models without and with adaptation (denoted as PMcs-No adap., and PMcs-FBDSA)
Subject Healthy subjects
H1 H2 H3 H4 H5 H6 H7 H8 H9 H10 H11 H12 H13 H14 H15 H16 Mean
MIcs-No adap. 59.4 51.3 75.2 54.8 94.5 52.7 48.9 63.1 64.6 58.7 76.1 82.9 68.3 77.9 75.4 75 67.44
MIcs-FBDSA 61.5 66.5 86.7 63.9 89.5 54.5 57.3 64.3 60.9 63.2 76.4 76.4 75.4 77.7 80 74.5 70.55
PMcs-No adap. 63.6 54.6 51.3 57.0 92.8 62.9 51.0 54.4 58.3 50 80.3 74.2 75.8 66.2 73.7 75.8 65.13
performed significantly worse than MIcs-No adap [tð15Þ ¼ 3:85;p¼0:002], MIcs-FBDSA [tð15Þ ¼
4:82;p\0:001], PMcs-No adap [tð15Þ ¼ 6:26;p¼
0:007], and PMcs-FBDSA [tð15Þ ¼ 3:14;p\0:001].
Furthermore, MIcs-FBDSA [tð15Þ ¼ 2:63;p¼0:019] and PMcs-FBDSA [tð15Þ ¼ 2:27;p¼0:038] signifi-cantly performed better than FBCSP-20Shrink. In the stroke group, the paired t-test showed that FBCSP-20
performed significantly worse than MIcs-FBDSA
[tð5Þ ¼ 4:3;p¼0:008], and PMcs-FBDSA
[tð5Þ ¼ 3:29;p¼0:002]. Moreover, a significant differ-ence between FBCSP-20Shrinkage and PMcs-FBDSA was observed [tð5Þ ¼ 2:59;p¼0:04[, whereas the difference between FBCSP-20Shrinkage and MIcs-FBDSA tended to be significant [tð5Þ ¼ 2:39;p¼0:06].
4.1.4 Discussion on the classification results
Our results show a potential mismatch between the col-lected PM data in the calibration session and the colcol-lected MI data in the evaluation session. This mismatch may have arisen due to differences in the EEG patterns produced during PM and those produced during MI. Other interses-sion variations may also be responsible (e.g., task
involvement, attention, placement or impedance of the electrodes etc), leading to deterioration in the BCI performance.
Our results show that for the healthy subjects the MI models on average performed 2.31 % better than the PM models (see Table 2), whereas this difference increased to 7.06 % in the stroke patients. Indeed, for the stroke patients although the PM model performed at a level better than chance, the average 7.06 % drop in the performance compared to the MI model suggests that PM as utilized could not be an acceptable substitute for an MI calibration step. However, when the proposed FB-DSA algorithm is applied to the PM model, the results indicate a compelling compensatory effect.
[image:9.595.46.547.88.400.2]Our patients in our informal talks confirmed that per-forming passive movement was less mentally fatiguing for them. Thus, when no previous data are available for a studied patient, we suggest using PM data for calibration and the proposed FB-DSA algorithm for adaptation, resulting in a less tired patient for the actual BCI thera-peutic interaction. Furthermore, since PM exercises are a part of normal stroke rehabilitation [25], PM data can be collected in a previous physical therapy session. Otherwise, if there are some previously collected MI data belonging to
Table 3 Classification accuracies of the motor imagery sessions for stroke patients using motor imagery calibration models without and with adaptation (denoted as MIcs-No adap., and MIcs-FBDSA) and
passive movement calibration models without and with adaptation (denoted as PMcs-No adap., and PMcs-FBDSA)
Patient’s code Stroke patients
A006 A018 A019 A024 A028 A031 Mean
MIcs-No adap. 81.9 65 64.4 57.5 85.6 90.6 74.16
MIcs-FBDSA 85.7 69.3 86.4 67.1 85.7 87.1 80.21
PMcs-No adap. 85.6 55 51.3 55.6 61.3 93.8 67.10
PMcs-FBDSA 84.3 67.9 80 59.3 87.86 92.86 78.70
No adap FBDSA No adap FBDSA 20 20Shrink No adap FBDSA No adap FBDSA 20 20Shrink 50
55 60 65 70 75 80 85 90
Accuracy (%)
Healthy Subjects Stroke Patients
MIcs− PMcs− FBCSP−
the same patient, our results suggest using the available MI data for calibration along with the proposed FB-DSA for reducing inter-session variations.
It is noted that our conclusions are limited to the data collected from only 6 stroke subjects. Thus, there is a need to further investigate our findings with larger cohorts.
4.2 Disparity between PM and MI data in stroke and healthy subjects
The results in4.1motivated us to investigate whether the disparity between the PM and MI data is stronger in the stroke subjects compared to the healthy subjects.
4.2.1 Event-related spectral perturbation
In the first investigation, the grand mean event-related spectral perturbation (ERSP) [37], time locked to the cue time, was used to compare the PM and MI tasks for the healthy and stroke subjects. ERSP is a 2-D (frequency-by latency) image of average changes in the spectral power (in dB) from a baseline. Calculating an ERSP typically
requires computing the power spectrum over a sliding latency window, then correcting baseline by subtracting the pre-stimulus power spectrum, and finally averaging across all the data trials.
Figure5 presents the ERSP images obtained by grand averaging the data recorded from channel C3 for the right hand tasks and the data recorded from channel C4 for the left hand tasks. The ERSP images were plotted using the
newtimeffunction in EEGLAB toolbox [38]. In the MI and PM ERSP images, red indicates enhancement of activity (increase of power) with respect to the pre-cue baseline (i.e., starting from 200 ms before the cue), and blue indi-cates suppression of activity with respect to the pre-cue baseline. All the non-green pixels of the MI and PM ERSP images show significant (two-tailed permutation test,
p\0:01) post-stimulus increases or decreases (see color
scale) in the spectral power compared to the averaged 200-ms pre-stimulus spectral power. In the PM minus MI ERSP images, red indicates higher activity (power) in PM com-pared to MI, and blue indicates higher activity in MI compared to PM. All the non-green pixels of the PM minus MI ERSP images show the areas that the spectral powers
Fig. 5 The event-related spectral perturbation (ERSP) images for the passive movement (PM), motor imagery (MI) and their differences, forathe 16 healthy andbsix stroke subjects. The ERSP images were plotted at the corresponding activated motor regions (ie. channels C3 and C4 forrightandlefthand tasks, respectively). Thedashed lines denote the cue time. In MI and PM ERSP images, thenon-green
[image:10.595.85.515.354.647.2]are significantly different between MI and PM (two-tailed permutation test,p\0:01).
Figure5a shows that both PM and MI tasks significantly increased the mu power (i.e 8–13 Hz) in the healthy sub-jects. However, the increase in power in MI is slightly greater compared to PM. This could be due to the very simple passive movement used in this study, whereas the imagined motor movements over the MI task were most-likely more complicated. In the same line, Fig.5b shows that the PM and MI tasks yielded significant increase in the mu and beta (i.e., 13–30 Hz) powers. In the stroke patients, PM yielded considerably stronger enhancements in the mu and beta powers compared to the MI task. Interestingly, PM also yielded an enhancement in the theta power (i.e., 4–8 Hz).
The last ERSP image in Fig.5a shows that the PM and MI signals obtained from the healthy subjects were sig-nificantly different in some time/frequency points, partic-ularly 1 s after the cue. The last ERSP image in Fig.5b reveals that the differences between PM and MI were much stronger in the stroke patients compared to the healthy subjects (see the scale). Importantly, the mu power was significantly different between the PM and MI data in the stroke patients.
4.2.2 KL divergence between PM and MI data
In the second investigation, the KL divergence between the PM and MI data filtered by the most discriminative fre-quency band (i.e., subject-specific) was calculated for each subject as given in (6). The reason behind this investigation is that in the applied FBCSP algorithm the features obtained by the most discriminative frequency band are used for classification. As mentioned in Sect.2.1, the most discriminative frequency band is the one generating the
feature with the highest mutual information. Indeed, unlike the ERSP images, this method measures the disparity between the PM and MI data using all (or a group) of channels.
Figure6 compares the KL divergence between the PM and MI data in the healthy and the stroke subjects. Each star corresponds to a subject. The boxplots of the obtained results were also depicted to ease the comparison between the healthy and stroke subjects. In Fig.6a the KL diver-gence was obtained using all the 27 channels, while in Fig.6b only 6 channels in the motor cortex area were used to obtain the KL divergence (i.e C3, CP3, CF3, C4, CP4, CP3). The Y-axes of Fig.6 have been drawn in the log scale to be more presentative.
Using all the channels, Fig. 6a shows that the difference between the PM and MI data is on average larger in the stroke subjects compared to the healthy subjects. However, according to the independent samplesttest, the difference between the results of these two groups was not statistically significant [tð20Þ ¼1:86;p¼0:07], since there were a few healthy subjects with high KL divergences between their PM and MI data. Indeed, the obtained KL values measured not only the inherent dissimilarities between the PM and MI data but also other inter-session variations (e.g task involvement, electrode impedance) that may not be negli-gible. Supporting this fact, our investigation showed that in one of the healthy subjects an EEG channel became loose at the middle of the PM session, and consequently caused a large KL divergence between the PM and MI data. Thus, to reduce the effect of other inter-session non-stationarities, in Fig.6b we focused on the motor cortex area, and obtained the KL divergence using only six channels (i.e., C3, CP3, CF3, C4, CP4, CP3). The results in Fig.6b showed that in the stroke subjects the difference between the PM and MI data recorded over the motor cortex area was statistically
Healthy Stroke
102 102
101
101
KL divergence between PM and MI
Different groups of subjects Disparity between PM and MI data,
calculated using all the channels
(a)
Healthy Stroke
KL divergence between PM and MI
Different groups of subjects Disparity between PM and MI data, calculated using 6 channels (C3,CP3,CF3,C4,CP4,CF4)
(b)
Fig. 6 Comparing the disparity between PM and MI data in the stroke and healthy subjects obtained by the KL divergence. To calculate the KL divergenceaused all the channels, andbused six
[image:11.595.116.484.53.219.2]stronger compared to the healthy subjects (i.e independent samplesttest,tð20Þ ¼2:14;p¼0:04).
4.2.3 Discussion on the disparity between PM and MI
According to the study presented by Gala´n et al. [39], the lack of sensory feedback in the MI data might cause some fundamental differences between MI and PM. To further investigate this issue, the ERSP images for centro-parietal electrodes which are closer to the sensorimotor cortex (i.e., CP3 for the right hand tasks and CP4 for the left hand tasks) were plotted. The ERSP images were relatively similar to the ones in Fig.5 confirming the available dif-ferences between the PM and the MI data over the senso-rimotor cortex. Due to the limited space these ERSP images are not included in the paper.
According to Fig.5, it appears that most of the inter-esting different activities between the PM and MI data is in the mu band. In order to find which frequencies are more different between MI and PI, we looked at the data space adaptation matrices (Vb) calculated for the different fre-quency bands. If the MI and PM for a specific frefre-quency band are similar, the Vb matrix is close to the identity matrix. To measure the differences between PM and MI in each frequency band, the Frobenious norm betweenVband the identity matrix was calculated askVb IkF, whereIis the identity matrix andk:kF denotes the Frobenious norm. Interestingly, the results showed that for all the stroke patients the mu rhythm had the largest difference between the PM and MI data. Besides, the theta rhythm was observed as the second largest different frequency band in 4 out of 6 patients. Several studies reported the theta enhancement during working memory, memory decoding and retrieval process. A recent study also reported the theta enhancement during the initiation of movement, and linked it to spatial exploration and self-direction learning [40]. This initial interesting findings should be further explored using a large number of stroke patients in future.
In the healthy subjects, mu, alpha, and the lower beta (i.e., 12–16 Hz) showed the largest difference between PM and MI for 8, 4 and 2 subjects, respectively. For the remaining two subjects the 28–32 Hz band and the 36–40 Hz band presented the largest difference. Thus, our results suggest that in most of the subjects the main dis-criminative frequency bands between PM and MI were mu and theta, respectively. However, since the proposed FB-DSA adaptation is a very computationally fast algorithm, it might not be worth to just apply the adaptation algorithm on one or two bands.
In summary, our results in Sect.4.2suggest that due to a stronger difference observed between the PM and the MI data in the stroke patients, there might be an increased need
to use adaptive algorithms such as the proposed FB-DSA algorithm in BCI-based stroke rehabilitation calibrated from PM data.
4.3 Impact of FB-DSA on the feature space
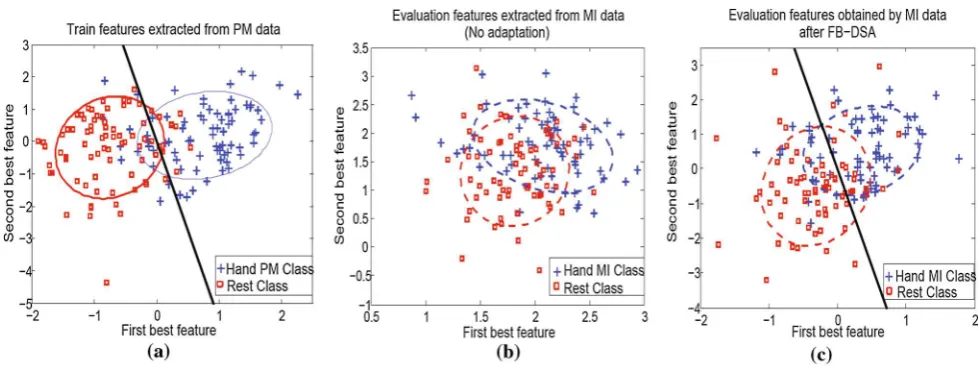
To better understand the impact of the proposed FB-DSA algorithm on the classification accuracies of MI-BCIs calibrated using passive data, the training features and the evaluation features before and after applying the FB-DSA algorithm were plotted for the patient A019. Adapting the PM model of this patient by the proposed FB-DSA algorithm resulted in the highest improvement in the classification accuracy, which was 28.75 % (see Table 3).
Figure7a shows the train features of the PM model extracted from the PM data. Figure7b, c, respectively show the evaluation features of the PM model extracted from the MI data before and after applying the FB-DSA algorithm. For ease of visualization only two features which had the highest mutual information on the train data were plotted. Moreover, the features were plotted after the normalization process. The blue crosses and the red squares denote the features of the hand MI/PM and the rest class respectively. The black line represents the LDA hyperplane obtained using the training data. Figure7shows that there were big changes between the distributions of the training features and the evaluation features before applying FB-DSA, that resulted in the inferior classification accuracy. In contrast, the differences between the train and the evalua-tion features after the proposed FB-DSA algorithm were considerably reduced. The FB-DSA algorithm not only compensated the shift in the feature spaces but also increased the discrimination between the two classes of the evaluation features. Thus, the classification accuracy was substantially improved.
4.4 Number of trials for adapting the PM model by FB-DSA
trials of the evaluation sessions (i.e., 15 trials from each class) were only used for computing the FB-DSA trans-formation matrices, and the classification was performed on the remaining 210 trials of the evaluation sessions.
Figure8shows that increasing the number of trials used in the FB-DSA algorithm up to around 20 (i.e., 10 trials from each class) improved the average classification accuracy of both the PM and MI models. This improve-ment would be due to better estimations of the covariance matrices in (9) using more trials. In contrast, a further increase in the number of trials to 30 caused a decrease in the average accuracy. This could be due to the fact that increasing the number of trials reduces the influence of the recent trials in computing Vb. Figure8 also shows that
when six trials or more were used to compute the FB-DSA transformation matrices, the PM model adapted by FB-DSA averagely outperformed the MI model with no adaptation.
In a BCI-based stroke rehabilitation, it would be desir-able if we could provide appropriate feedback to the patient from the very beginning. Overall, our results suggest that the BCI-based stroke rehabilitation session with appropri-ate feedback can be started after collecting just a few trials (e.g., only 3 trials from each class). This is achieved by a subject-specific model calibrated from PM data that is continually adapted using the proposed FB-DSA algorithm. As such, before collecting 20 evaluation trials (i.e., 10 trials from each class), the PM model classifies an upcoming trial using the FB-DSA transformation matrices computed from all the previous trials. After reaching 20 trials, to classify each new trial, the FB-DSA transformation matrices are computed using the immediate past 20 trials.
5 Conclusion
This paper investigated the effectiveness of calibrating EEG-based motor imagery BCIs using passive movement. For this purpose, a new algorithm called FB-DSA was proposed to linearly transform the filter bank band-passed MI data, such that the distribution difference between the MI and PM data is minimized. The proposed algorithm was evaluated using data from six stroke patients and 16 heal-thy subjects. The design of this study for both the stroke and healthy subjects was based on the use of motor ima-gery-based BCI for stroke rehabilitation [5]. The EEG data were collected during MI or PM of the chosen hand versus
Fig. 7 Distributions of the two best features obtained by the PM calibration model, for: Patient A019.aThe train features extracted from the PM data, subsequently b and c The evaluation features extracted from the MI data before and after adapting by the proposed
FB-DSA algorithm. Theblue crossesand thered squaresdenote the features of the hand MI/PM and the rest class respectively. Theblack linerepresents the LDA hyperplane obtained by the train data
5 10 15 20 25 30
66 68 70 72 74 76 78 80
Results obtained from 6 Stroke Patients
Number of Trials used used for Computing FB−DSA matrix
Average Classification Accuracy (%)
MIcs−No daptation PMcs−No adaptation MIcs−FBDSA PMcs−FBDCA
[image:13.595.52.542.55.239.2] [image:13.595.54.284.311.460.2]the rest condition for the healthy subjects, and the stroke affected hand versus the rest condition for the patients.
Our results suggest using PM data for calibration and the proposed FB-DSA algorithm for adaptation when no pre-vious data are available for a studied patient. Importantly, collecting PM data for calibration leads to a less mentally tired patient for the actual BCI therapeutic interaction. Furthermore, since PM exercises are a part of normal stroke rehabilitation, PM data can be collected in a previ-ous physical therapy session. On the other hand, if there are some previously collected MI data belonging to the same patient, our results suggest using the available MI data for calibration along with the proposed FB-DSA for reducing inter-session variations. We also provided some analytical evidence suggesting that the disparity between the MI and PM data could be significantly stronger in the stroke patients compared to the healthy subjects. Thus, there might be an increased need to use adaptation algorithms such as the proposed FB-DSA algorithm in BCI-based stroke rehabilitation calibrated from PM.
Overall, the results showed that a BCI-based stroke rehabilitation session with appropriate feedback could be reliably started after collecting just a few trials (e.g., only 3 trials from each class). This could be achieved by using a subject-specific model calibrated from robot-assisted PM data that was continually adapted using the proposed FB-DSA algorithm.
Acknowledgments This work was supported by the Agency for Science, Technology and Research (A.STAR), Singapore. The authors would like to thank the participants and the entire research team at the Tan Tock Seng hospital rehabilitation center, as well as everybody who were involved in the data collection from the stroke patients.
Open Access This article is distributed under the terms of the Creative Commons Attribution 4.0 International License (http://crea tivecommons.org/licenses/by/4.0/), which permits unrestricted use, distribution, and reproduction in any medium, provided you give appropriate credit to the original author(s) and the source, provide a link to the Creative Commons license, and indicate if changes were made.
References
1. Birbaumer N (2006) Brain–computer-interface research: coming of age. Clin Neurophysiol 117:479–483
2. Wolpaw JR, Birbaumer N, McFarland DJ, Pfurtscheller G, Vaughan TM (2002) Brain–computer interfaces for communi-cation and control. Clin Neurophysiol 113:767–791
3. Ahangi A, Karamnejad M, Mohammadi N, Ebrahimpour R, Bagheri N (2013) Multiple classifier system for EEG signal classification with application to brain–computer interfaces. Neural Comput Appl 23(5):1319–1327
4. Hu S, Tian Q, Cao Y, Zhang J, Kong W (2012) Motor imagery classification based on joint regression model and spectral power. Neural Comput Appl 21(7):1–6. doi:10.1007/s00521-012-1244-3
5. Ang KK, Guan C, Chua KSG, Ang TB, Kuah CWK, Wang C, Phua KS, Chin ZY, Zhang H (2011) A large clinical study on the ability of stroke patients to use EEG-based motor imagery brain– computer interface. Clin EEG Neurosci 42:253–258
6. Pfurtscheller G, Muller-Putz GR, Scherer R, Neuper C (2008) Rehabilitation with brain–computer interface systems. Computer 41:58–65
7. Prasad G, Herman P, Coyle D, McDonough S, Crosbie J (2010) Applying a brain–computer interface to support motor imagery practice in people with stroke for upper limb recovery: a feasi-bility study. J Neuroeng Rehabil 7(1):60
8. Butler AJ, Page SJ (2006) Mental practice with motor imagery: evidence for motor recovery and cortical reorganization after stroke. Arch Phys Med Rehabil 87:2–11
9. Sharma N, Pomeroy VM, Baron J-C (2006) Motor imagery: a backdoor to the motor system after stroke? Stroke 37:1941–1952 10. Vries S, Mulder T (2007) Motor imagery and stroke
rehabilita-tion: a critical discussion. J Rehabil Med 39:5–13
11. Shenoy P, Krauledat M, Blankertz B, Rao RPN, Mu¨ller K-R (2006) Towards adaptive classification for BCI. J Neural Eng 3:13–23
12. Krauledat M, Schroder M, Blankertz B, Muller K (2007) Reducing calibration time for brain–computer interfaces: a clus-tering approach. Adv Neural Inf Process Syst 19:753–760 13. Krauledat M, Tangermann M, Blankertz B, Muller K (2008)
Towards zero training for brain–computer interfacing. PLoS One 3(8):2967
14. Arvaneh M, Guan C, Ang KK, Quek C (2012) Omitting the intrasession calibration in EEG-based brain–computer interface used for stroke rehabilitation. In: 34th annual conference of the IEEE engineering in medicine and biology society, pp 4124–4127 15. Fazli S, Popescu F, Danoczy M, Blankertz B, Muller K, Grozea C (2009) Subject independent mental state classification in single trials. Neural Netw 22:1305–1312
16. Arvaneh M, Robertson I, Ward TE (2014) Subject-to-subject adaptation to reduce calibration time in motor imagery-based brain–computer interface. In: 36th annual conference of the IEEE engineering in medicine and biology society, pp 6501–6504 17. Vidaurre C, Sannelli C, Mu¨ller K-R, Blankertz B (2011)
Machine-learning-based coadaptive calibration for brain–com-puter interfaces. Neural Comput 23(3):791–816
18. Li Y, Guan C, Li H, Chin Z (2008) A self-training semisuper-vised SVM algorithm and its application in an EEG-based brain– computer interface speller system. Pattern Recogn Lett 29(9):1285–1294
19. Vidaurre C, Schlo¨gl A, Cabeza R, Scherer R, Pfurtscheller G (2007) Study of on-line adaptive discriminant analysis for EEG-based brain–computer interfaces. IEEE Trans Biomed Eng 54:550–556
20. Satti A, Guan C, Prasad G, Coyle D (2010) A covariate shift minimisation method to alleviate non-stationarity effects for an adaptive brain–computer interface. In: 20th international con-ference on pattern recognition, pp 105–108
21. Krusienski DJ, Grosse-Wentrup M, Gala´n F, Coyle D, Miller KJ, Forney E, Anderson CW (2011) Critical issues in state-of-the-art brain–computer interface signal processing. J Neural Eng 8(2):025002
22. Pfurtscheller G, Neuper C (1997) Motor imagery activates pri-mary sensorimotor area in humans. Neurosci Lett 239:65–68 23. Alegre M, Labarga A, Gurtubay IG, Iriarte J, Malanda A, Artieda
J (2002) Beta electroencephalograph changes during passive movements: sensory afferences contribute to beta event-related desynchronization in humans. Neurosci Lett 331:29–32 24. Kaiser V, Kreilinger A, Mu¨ller-Putz GR, Neuper C (2011) First
25. Johnstone M (1983) Restoration of motor function in the stroke patient. Churchill Livingstone, London
26. Ang KK, Guan C, Chua KSG, Phua KS, Wang C, Chin ZY, Zhou L, Yin K, Tang C, Ephraim GJ, Kuah CWK (2013) A clinical study of motor imagery BCI performance in stroke by including calibration data from passive movement. In: 35th annual con-ference of the IEEE engineering in medicine and biology society, pp 6603–6606
27. Arvaneh M, Guan C, Ang KK, Quek C (2013) EEG data space adaptation to reduce inter-session non-stationarity in brain– computer interface. Neural Comput 25(8):2146–2171
28. Ang KK, Chin ZY, Wang C, Guan C (2012) Filter bank common spatial pattern algorithm on BCI competition IV datasets 2a and 2b. Front Neurosci 6:1–9
29. Blankertz B, Tomioka R, Lemm S, Kawanabe M, Mu¨ller KR (2008) Optimizing spatial filters for robust EEG single-trial analysis. IEEE Signal Process Mag 25:41–56
30. Ang KK, Chin ZY, Zhang H, Guan C (2011) Mutual information-based selection of optimal spatial–temporal patterns for single-trial EEG-based BCIs. Pattern Recogn 45(6):2137–2144 31. Tangermann M, Mu¨ller KR, Aertsen A, Birbaumer N, Braun C,
Brunner C et al (2012) Review of the BCI competition IV. Front Neurosci 6(55):1–31
32. Ramoser H, Mu¨ller-Gerking J, Pfurtscheller G (2000) Optimal spatial filtering of single trial EEG during imagined hand movement. IEEE Trans Rehabil Eng 8:441–6
33. von Bunau P, Meinecke FC, Kiraly FC, Mu¨ller K-R (2009) Finding stationary subspaces in multivariate time series. Phys Rev Lett 103(21):214101
34. Lambercy O, Dovat L, Gassert R, Burdet E, Chee Leong T, Milner T (2007) A Haptic knob for rehabilitation of hand func-tion. IEEE Trans Neural Syst Rehabil Eng 15(3):356–366 35. Ang KK, Guan C, Chua KSG, Ang BT, Kuah CWK, Wang C,
Phua KS, Chin ZY, Zhang H (2009) A clinical study of motor imagery-based brain–computer interface for upper limb robotic rehabilitation. In: 31st annual international conference of the IEEE engineering in medicine and biology society, pp 5981–5984 36. Bartz D, Mu¨ller KR (2014) Covariance shrinkage for autocorre-lated data. In: Advances in neural information processing sys-tems, pp 1592–1600
37. Makeig S (1993) Event-related dynamics of the EEG spectrum and effects of exposure to tones. Electroencephalogr Clin Neu-rophysiol 86:283–293
38. Delorme A, Makeig S (2004) EEGLAB: an open source toolbox for analysis of single-trial EEG dynamics including independent component analysis. J Neurosci Methods 134(1):9–21
39. Gala´n F, Baker MR, Alter K, Baker SN (2015) Degraded EEG decoding of wrist movements in absence of kinaesthetic feed-back. Hum Brain Map 36(2):643–654
![Fig. 2 Experimental setup to collect EEG data from passivemovement of the left hand using the haptic knob robot [34] forcalibrating the EEG-based motor imagery BCI](https://thumb-us.123doks.com/thumbv2/123dok_us/7808349.171562/6.595.306.541.290.373/experimental-collect-passivemovement-using-haptic-robot-forcalibrating-imagery.webp)