This is a repository copy of The conceptual foundations of Network-Based Diffusion
Analysis: choosing networks and interpreting results.
White Rose Research Online URL for this paper:
http://eprints.whiterose.ac.uk/116649/
Version: Accepted Version
Article:
Hoppitt, WJE orcid.org/0000-0003-0815-5720 (2017) The conceptual foundations of
Network-Based Diffusion Analysis: choosing networks and interpreting results.
Philosophical Transactions B: Biological Sciences, 372 (1735). ISSN 0962-8436
https://doi.org/10.1098/rstb.2016.0418.
© 2017 The Author(s). Published by the Royal Society. This is an author produced version
of a paper published in Philosophical Transactions B: Biological Sciences. Uploaded in
accordance with the publisher's self-archiving policy.
[email protected] https://eprints.whiterose.ac.uk/
Reuse
Items deposited in White Rose Research Online are protected by copyright, with all rights reserved unless indicated otherwise. They may be downloaded and/or printed for private study, or other acts as permitted by national copyright laws. The publisher or other rights holders may allow further reproduction and re-use of the full text version. This is indicated by the licence information on the White Rose Research Online record for the item.
Takedown
If you consider content in White Rose Research Online to be in breach of UK law, please notify us by
The conceptual foundations of Network-Based
Diffusion Analysis: choosing networks and
interpreting results
Will Hoppitt
School of Biology, Faculty of Biological Sciences,University of Leeds, Leeds LS2 9JT, United Kingdom orcid.org/0000-0003-0815-5720
Keywords: social learning, culture, social transmission, network-based diffusion analysis
Summary
Network-based diffusion analysis (NBDA) is a statistical technique for detecting the social transmission of behavioural innovations in groups of animals, including humans. The strength of social transmission is inferred from the extent to which the diffusion (spread) of the innovation follows a social network. NBDA can have two goals: a) to establish whether social transmission is occurring and how strong its effects are; and/or b) to establish the typical pathways of information transfer. The technique has been used in a range of taxa, including primates, cetaceans, birds and fish, using a range of different types of network. Here I investigate the conceptual underpinnings of NBDA, in order to establish the meaning of results using different networks. I develop a model of the social transmission process whereby observation of performance of the behaviour offers a na•ve individual the opportunity to learn that behaviour pattern for themselves. I then establish how NBDAs using different networks relate to this underlying process, and thus how we can interpret the results of each. My analysis shows that different network or networks are appropriate depending on the specific goal or goals of the study, and establishes how the parameter estimates yielded from an NBDA can be interpreted for different networks.
1.0 Introduction
In recent years, there has been a substantial interest in better understanding how and why non-human animals use social information (1-3), and particularly understanding if novel behaviour (innovations) can diffuse through populations as a result of social transmission (learning from others) (4). A capacity for social transmission has been demonstrated in many species using a traditional demonstrator-observer paradigm (5). In contrast, recent studies have focused on studying the diffusion of innovations in freely interacting groups of animals in the field (e.g. 6, 7) or in captivity (e.g. 8, 9), aiming to assess the importance of social transmission in the spread of behavior, and elucidate typical pathways of transmission. However, in many cases it can be challenging to determine whether the spread of innovations is caused by social transmission, or purely the product of asocial learning (see also (10)).
One approach to this problem is to use diffusion data: time-structured data on the spread of behaviour through a population or group. Network Based Diffusion Analysis (NBDA), is one such approach that infers social transmission if the spread of an innovation follows a social network (11, 12). For example, in 1980 a few humpback whales (Megaptera novaeangliae) were observed displaying a novel hunting behaviour, called Ôlobtail feedingÕ whereby they would strike the waterÕs surface with their tail before engaging in their usual bubble-feeding routine. This innovation diffused through the population over the course of the next 27 years. NBDA was used to show that the diffusion of the innovation followed a social network providing evidence that it spread by social transmission (6). In this case, and most applications of NBDA the social network used is a pre-established association network (e.g. 6, 13) that is assumed to reflect opportunities for learning between each pair of individuals (12). However, a number of different types of social network (e.g. based on
*Author for correspondence ([email protected]).
different types of interactions between individuals) can be constructed and used in an NBDA (14)
representing different hypothetical pathways about the pathways of social transmission. There are two main objectives a researcher might have in applying an NBDA: a) to establish whether social transmission is
occurring and how strong its effects are; and/or b) to establish the typical pathways of social transmission in a population, group or context, However, it is not currently well established how an NBDA using each of the various kinds of networks relates to the underlying process of social learning. Such a conceptual foundation to NBDA is required if researchers are to a) know what kinds of network can be validly used to accomplish each goal; and b) interpret the results of an NBDA using a particular type of network. In this paper, I develop such a conceptual foundation, by presenting a simple, but realistic model of the social learning process, whereby observation of performance of the behaviour offers a na•ve individual the opportunity to learn that behaviour pattern for themselves. I then use the model to assess the validity of different types of social network for each of the two goals, and establish how the results of an NBDA should be interpreted. I also use simulations to assess how error in the measured network impacts on the outputs of an NBDA, and assess whether error in a network influences the interpretation of the results.
2.0 Network-Based Diffusion Analysis
The basic NBDA model states that at time t an individual, i, learns a target innovation at rate:
�∀ � = �% 1 + � ∗ �∀∗�∗ � 1 − �∀ � , Eqn. 1
where �% is the baseline (asocial) rate of learning, �∀∗ is the social network connection from j to i, �∀ � is the
status of individual i: informed= 1 (has learned the target behaviour), or na•ve= 0, and s is a parameter, fitted to the data, estimating the strength of social learning relative to asocial learning. The ∗ �∀∗�∗ � term means
that individuals learn at a rate proportional to their connection to informed individuals, and the 1 − �∀ �
term means that only na•ve individuals can learn. If the diffusion follows the network closely, s is estimated to be large. The model can be fitted to data giving only the order in which individuals learn (Order of
Acquisition Diffusion Analysis or OADA) or the times at which they learn, in continuous time, or in discrete time periods (continuous/ discrete Time of Acquisition Diffusion Analysis or TADA) (11, 12). TADA has more statistical power, but OADA makes fewer assumptions about the time course of asocial learning (12). In all cases the model is compared to a null model in which there is no social transmission (s=0) to establish the strength of evidence for social transmission. Models can be fitted using maximum likelihood (11, 12) or Bayesian approaches (15, 16). In this paper, I use the former approach in simulations due to its reduced computational complexity. Code for implementing NBDA in the R statistical environment (17) , along with instructions can be found at https://lalandlab.st-andrews.ac.uk/freeware/.
The basic NBDA model given in Eqn. 1 has been expanded so that potentially confounding variables can be included and statistically controlled for (12) and so that it can account for a non-constant rate of asocial learning (18). Franz and Nunn (19) have investigated the effect of inaccuracies in the times of acquisition data, and Whalen and Hoppitt (16) have shown that NBDA is robust to departures from the assumption of a linear relationship between �∀ � and �∀∗. However, little work has been done on the effect of inaccuracies in the
social network itself. Consequently, in this paper I assess the effect of various types of inaccuracies that might affect the recording of the social network �∀∗. But first, I develop a model of social learning that is more realistic than the model underlying NBDA (Eqn. 1), at the mechanistic level, and use this to establish the conceptual foundations for NBDA.
3.0 A Realistic Model of Social Transmission
Here I develop a simple model of the social transmission process, that is mechanistically realistic in groups of non-human animals, i.e. observation of performance of the behaviour offers a na•ve individual the
opportunity to learn that behaviour pattern for themselves. The model, and NBDA itself, may also be
�∀∗= �∀∗�/0123:∀∗, Eqn. 2
where �∀∗ is the rate at which i observes j. We can further break the model down to:
�∀∗= �∗�89::∀∗�/0123:∀∗, Eqn. 3
where �∗ is the rate at which j performs the behaviour, once they have learned it, and �89::∀∗ is the probability
that a given performance of the behaviour by j is observed by i. Thus, the rate at which a na•ve individual acquires the novel behaviour to their repertoire, at a given time, t, will be:
�∀ � = �%+ ∗ �∀∗�∗ � = �%+ ∗ �∗�89::∀∗�/0123:∀∗�∗ � , Eqn. 4
where �% is the rate of asocial learning, and �∗ � gives the status of individual j at time t (1= informed, 0=
na•ve). This corresponds closely to the basic NBDA model given in Eqn. 1, where
��∀∗=
;<=
>? =
≅=ΑΒΧD:<=ΑΕΦΓΗΙ:<=
>? . Eqn. 5
s is fitted to the data and scales the rate of social transmission relative to the rate of asocial learning, �%. This is
because in Eqn. 1 the rate of transmission from j to i is given by �%��∀∗, whereas in Eqn. 4 this is given by �∀∗,
or, equivalently, �∗�89::∀∗�/0123:∀∗. Consequently, the more closely a social network, �∀∗, approximates �∀∗, (scale
aside) the better it will tend to predict the order and time of diffusion in an NBDA. However, the exact meaning of the s parameter, estimated by the NBDA, will depend on exactly what network �∀∗ is used (e.g.
association versus interaction networks), as will the meaning of the model itself, when compared to models using alternative social networks. One of the key goals of this paper is to establish how an NBDA should be interpreted when different types of network are used.
Thus far, I assume that social transmission occurs via observation, whereas instead it could occur when i encounters the products of jÕs behaviour, as has been observed in a number of case of non-human social learning (e.g. 21). In such cases the model might still apply: here instead �∀∗ is the rate at which i encounters
the products of jÕs behaviour, and �∀∗ is the probability of learning the behaviour from each encounter. In the
remainder of the paper I refer to cases where social transmission occurs via observation, but analogous logic applies to cases where the transmission pathway does not operate via direct observation.
As noted above, there are two main objectives a researcher might have in applying an NBDA. Aim 1 is to establish whether social transmission is occurring and how strong its effects are. For this goal, a researcher ideally requires a social network that captures the opportunities for social transmission as directly as possible. Intuitively, the extent to which the diffusion follows such a network then reflects the importance of social transmission relative to asocial learning. Aim 2 is to determine the particular types of relationship that are important in providing the opportunity to observe and learn. Here, each network can be seen as a competing hypothesis, with the aim of NBDA being to establish which one best approximates the patterns of
transmission among individuals (�∀∗). Given that part of this goal is to determine the types of relationship that
determine opportunities to learn, a network that provides a direct quantification of such opportunities is not a useful predictor variable. In this paper, I will examine each aim in turn, and with reference to my simple model of the transmission process, look at the kind of networks that might be used to address each question.
I also assess the effects error in the measured social network has on estimates of the importance of social transmission (i.e. Aim 1). It is well known that sampling of animal interactions and associations can be incomplete, often because animals are missed during a given sampling period (22). In some cases, incomplete sampling is likely to result in random noise applied to the network. However, of more concern is the
4.0 NBDA Aim 1: Detecting and quantifying social transmission
Here the goal is to assess the strength of evidence that social transmission is operating, and to estimate the effect social transmission has, with confidence intervals providing a plausible range. There are two main types of network that could be used, depending on how closely the diffusion process was observed and
documented.
4.1 Observation networks
In an ideal case, a researcher would know exactly when the innovation was performed, by whom, and who observed each performance. Whilst such cases might seem rare, it is possible to attain data close to this level of resolution in cases where the target behaviour is only performed in a specific location that can be monitored closely. For example, Hobaiter et al. (7) applied NBDA to show evidence of social transmission of a tool using innovation, moss sponging, in a group of chimpanzees. Moss sponging is the use of pieces of moss as sponges to obtain water from holes in trees (differing from the usual use of folded leaves), and the initial spread was documented at a single water hole. A similar situation may be easy to achieve empirically using a novel artificial foraging task (e.g. 25) which can be monitored closely by the researcher.
At first glance, one might attempt to fit a model in which �/0123:∀∗ is modelled directly- however, this model
deviates from the form of the standard NBDA. A standard NBDA assumes that transmission occurs at a rate that is proportional to a network connection between two individuals, whereas the model specified in section 3.0 assumes there is a probability of learning from each discrete observation event. Furthermore, in order to fit a model in which �/0123:∀∗ is estimated directly, we need to be able to ascertain whether learning has
occurred as a result of a given observation event. The only way we have to infer this, is by observing i perform the behaviour themselves. Therefore, one has to address the question of how long after observing the
behaviour i will perform it, given learning has occurred. A practical solution is to use an NBDA that approximates this process, by creating a dynamic observation network. I define a dynamic observation network, �∀∗(�), as giving the number of times i has observed j performing the behaviour prior to time t.
Hobaiter et al. (7) extend the NBDA model to allow use of a dynamic network. This model assumes that social transmission occurs at a rate that is proportional to the number of times the behaviour has been observed in the past. This model is perhaps less realistic than that specified above, since it seems improbable that an individual can continue to learn an innovation as a result at observing it at some time in the past, and that the effect of all such observations on the rate of learning would be cumulative. But the model might be used to approximate the case where �/0123:∀∗= �/0123 is constant across individuals.
An alternative is to use a static network, where �∀∗ gives the number of times i observed j up until the point at
which i learned the behaviour (7). However, a static observation network does not fully allow for the time course of observations. For example, imagine a group of three individuals: A, B, and C. A learns the behavior first. Next, B observes A performing the behavior three times and then learns the behavior. Finally, C observes A performing the behavior four times and subsequently learns the behavior last. A static network would represent the network as having links of strength 3 from A to B and 4 to C, so an NBDA model based on this network would predict that C was more likely to learn second. In reality, we might expect B to be more likely to learn second, because B observed A performing the behavior first. A dynamic network allows us to
incorporate this information into the NBDA. Supporting this, Hobaiter at el. (7) found that an NBDA using a dynamic observation network had substantially more power than an NBDA using a static observation network.
Use of an observation network has the advantage that even when there is no social structure in the population, social transmission can be inferred if the chance order in which individuals observe the behaviour predicts the order of diffusion (this is illustrated in the simulation below). If �/0123 = 0, then we would not expect the
diffusion to follow the observation network, and we would expect the s parameter in the NBDA not to be significantly greater than 0. Likewise, the greater �/0123 is, the greater our estimate of s will be, although s
does not give an estimate of �/0123. However, one can use the estimate of s to estimate the proportion of learning events that occurred by social transmission (as opposed to asocial learning), allowing an interpretable measure of social transmission to be obtained. For each acquisition event, e, at time te, one calculates the
probability of social transmission as:
�:8Μ∀1/,0= ��∀∗ �0 �∗ �0 1 + ��∀∗ �0 �∗ �0 Eqn. 6
then take the mean of �:8Μ∀1/,0 across acquisition events to estimate the proportion that occurred via social
To test the performance of observation networks I simulated data from the model specified in Eqn. 3 (see Supplementary Material for details). I found that type 1 error rate was appropriate if slightly conservative, with the null hypothesis being rejected in 3.1% of cases when �/0123:∀∗= 0. Power increased rapidly as �/0123:∀∗
increased, showing that the dynamic network NBDA is able to detect social transmission occurring by the more realistic model even in the absence of any social structure (see Fig. S1a in the Supplementary Material; power is increased in the presence of underlying social structure see Fig. S2). However, the model did tend to slightly overestimate the proportion of events that occurred by social learning, with the true value lying above the 95% confidence intervals in more than 5% of simulations (see Fig. S1b).
A concern with use of a dynamic observation network arises if the target behaviour is performed in a specific location or locations. For example, the moss sponging documented by Hobaiter et al. (2014) was performed at a particular water hole. In these cases, a recorded observation for i may simply indicate that i was in the area appropriate for performing/learning the behaviour, and thus have been more likely to learn the target behaviour in the near future. Such an effect may look like social transmission in the NBDA. Hobaiter et al. (7) address this problem by including a variable giving each individualÕs exposure to the relevant location in the NBDA, and thus statistically controlling for it. Ideally exposure would be included as a time-varying variable (e.g. proportion of time spent in the target area each day) to allow for the possibility that patterns of changing exposure correlate with patterns of observation.
In conclusion, if detailed data are available on when the target behaviour is performed, by whom, and who observed each performance, use of a dynamic observation network is the most direct way to detect and quantify the effects of social transmission.
4.2 Association networks
In most cases, researchers will not be able to document every performance and observation of the target innovation, but have a good idea of the order in which (and potentially times at which) individuals learned the target behaviour. In such cases, one can use an association network, where �∀∗ represents the proportion of
time i spends associating with j (See (22, 26, 27) for reviews of techniques for estimating association networks). The assumption is that individuals can only learn from one another when they are associating, thus the rate of transmission from j to i, �∀∗, will be proportional to �∀∗. For this logic to be valid, the criterion for i to be
recorded as associating with j has to be specified at the appropriate spatial scale (28). Individuals recorded as associating must be within a range at which observation can occur, whereas individuals not recorded as associating must tend to be at a distance at which observation is not possible. This is the case in Allen et al.Õs (6) aforementioned humpback whale study, where the study was conducted over an area of approximately 1000 square miles. In contrast, other studies on captive groups of birds (8, 29) have used a criterion for association based on proximity (e.g. nearest neighbour) within an enclosure of a few square meters- meaning that dyads not recorded as associating are still able to observe one anotherÕs behaviour. The discussion in this section pertains to the former kind of association network, whereas I return to the interpretation of the second kind, which I refer to as Ôsmall-scale association networksÕ in section 5.2. Note that if patterns of association are known to change over the course of the diffusion, a dynamic association network �∀∗(�) could be used.
In an NBDA using an appropriate association network, �∀∗ is an estimate of �89::∀∗, with �∗= � and �/0123:∀∗=
�/0123 assumed to be approximately constant across individuals (though variation in learning rates can be
modelled using individual covariates (8)). Therefore, from Eqn. 5, the s parameter can be taken as an estimate of ��/0123 �%, the rate at which information is transmitted from an informed to a na•ve individual during
periods when they are associating, relative to the rate of asocial learning.
Alternatively, there may be variation in �∗, which is implicitly assumed to be constant in the standard NBDA.
However, if data is available on the rate at which each individual performs the behaviour once they have learned it, this can be used to weight the association network and account for this variability (13). Here, �∀∗ is
replaced by �∗�∀∗ where the transmission weight �∗ is an estimate of �∗. This means that the meaning of the s
parameter is now changed. From Eqn. 4, in a weighted NBDA s now estimates �/0123:∀∗ �%, i.e. the probability
of learning each time i observes j perform the target behaviour, relative to the rate of asocial learning. However, the estimated proportion of events can still be calculated from Eqn. 6 by replacing �∀∗ with �∗�∀∗,
Note that transmission weights can be used with other types of networks too, where there is measured variation in performance rate (see Section 5.4).
4.3 Effects of error in the social network
Error could potentially arise in both dynamic observation networks and, as outlined above, in association networks. Here I conduct simulations to assess the effect of such error on the detection of social transmission and the estimates of its importance using NBDA. Full details of the simulations outlined below are provided in the Supplementary Material. Note that the purpose of the simulations presented in this paper is not to draw general inferences about the power of NBDA for given values of s, or the relative power of OADA and TADA, which depend on sample size, network structure and whether asocial learning occurs at a constant rate (18). Rather, the aim is to see how NBDA responds to errors in network structure.
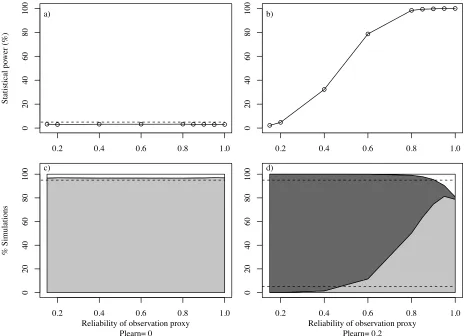
When using an observation network researchers do not know for sure when an observation has occurred, since it is difficult to know what a subject is attending to (especially with non-human animals). In reality, some kind of proxy is used- such as: individuals within 1m, with head orientated towards the performer and with an unobstructed view (7). Potentially, individuals recorded as observers might not really have been observers, and some observers might have been missed (e.g. if they are outside the threshold distance). Critics of the use of observation networks might suggest that this uncertainty renders the results unreliable. I re-ran the simulations and analyses described in section 4.1, varying the degree of error in the network: i.e. the probability an individual recorded as an observer, really was an observer (�89:|Θ89:). For all values of �89:|Θ89:,
the type 1 error rate remained approximately constant at 2.9-3.3%, showing that error in identifying observers does not increase the risk of a spurious social transmission effect (see Fig. 1a,c). Instead, power to detect social transmission was reduced as �89:|Θ89: decreased (see Fig. 1b), accompanied by a tendency to underestimate
the proportion of events occurring by social transmission (see Fig. 1d). This counteracts the tendency of the dynamic network NBDA to overestimate the importance of social transmission. Only when observers are identified with very high reliability (which is probably unachievable in practice) are overestimates produced. This means that researchers using a dynamic observation network should consider their estimates to be slightly conservative if good data on observers is available, and highly conservative if only a crude proxy for observation can be obtained.
[Fig. 1 about here]
Next I investigate the robustness of an NBDA using an association network when �∀∗ is not a perfect estimate
of �89::∀∗. First I assess how the method is affected when the �∀∗ has random noise, perhaps as a result of
sampling error when collecting association data. Alternatively this could be due to variation in �/0123:∀∗,
causing �∀∗ not to be directly proportional to �∀∗. I simulated diffusion data from Eqn. 5. I then simulated an
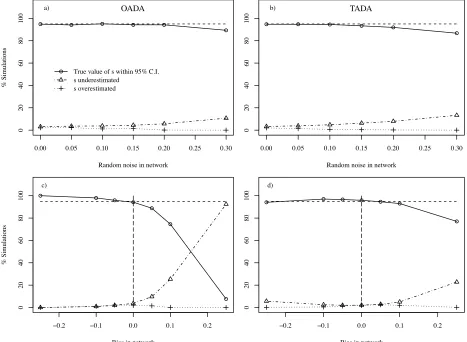
association network as ÔrecordedÕ by the researcher, by adding random noise to the network before it was input into the NBDA (OADA and continuous TADA variants). For all levels of noise, the type 1 error rate remained <5%, showing that random noise in the network does not does not result in an increased risk of detecting a spurious social transmission effect. As expected, power increases with increasing values of s, and is greater for TADA than for OADA. In the OADA power was reduced as network noise increased, however this effect was not seen in the TADA (see Fig. S3a-b). When no noise was present, 95% confidence intervals for s contained the true value 95-98% of the time, showing these to be appropriate or slightly too wide. However, as noise increased, both OADA and TADA showed a tendency to underestimate the true value of s (see Fig 2a-b). Overall, this means that if a researcher suspects there is random noise in their association network: a positive result for social transmission can still be trusted, and 95% confidence intervals for s may be conservative (underestimate s). The same is true for the estimated proportion of events by social transmission (Eqn. 6) since this is calculated from s.
[Fig.2 about here]
Another possibility is that there is systematic bias in the network. If all connections in the network are
overestimated or underestimated by the same factor, this has little effect on the analysis, since it merely scales the network. If network connections are overestimated, s will be estimated as smaller than its true value and vice versa. However, the proportion of learning events estimated to have occurred by social transmission will be unchanged, as will the fit of the model to the data. A potentially more serious concern is when
larger values of �∀∗ tend to be over-estimated, and smaller values underestimated, or vice versa. This could
�∀∗+ �∀∗− 0.5 ×����, where bias< 0 means small network connections are overestimated relative to large
ones and bias> 0 means large network connections are overestimated relative to small ones.
In all cases type 1 error rate remained <5% showing that bias in the network does not result in an increased risk of detecting a spurious social transmission effect. There was little effect on statistical power in either the OADA or the TADA (see Fig. S3c-d). When small network connections were overestimated relative to large ones (bias<0), 95% C.I.s contained the true value of s in >95% of cases, suggesting the 95% were too broad (underestimated the level of precision) (see Fig. 2c-d). In contrast, when large network connections tended to be overestimated relative to small ones (bias> 0) the 95% C.I.s tended to underestimate the true value of s, sometimes to a severe extent. e.g. In an OADA when s= 4 and bias= 0.25, in 92.4% of simulations the true value was below the 95% C.I. There is no indication that bias can result in confidence intervals that are too narrow, or a tendency to overestimate s. Overall, if a researcher suspects bias in the network it means their estimates of s are likely to be conservative, either in terms of estimated precision (bias< 0) or the estimated value of s (bias> 0).
None of the sources of noise or bias considered here inflated the type 1 error rate, and statistical power was usually not badly reduced. In some cases, confidence intervals were found to be conservative in terms of precision (too broad) or because they tended to underestimate s. It is worth noting that if the aim is to
compare rates of social transmission across diffusions (e.g. across species or contexts) it is important to ensure that association networks are quantified in a consistent manner, so any sources of noise and bias are consistent across diffusions and do not generate a spurious difference in social transmission rates.
5.0 NBDA Aim 2: Establishing the typical pathways of information transfer
Another aim a researcher might have in an NBDA is to elucidate the typical pathways of diffusion, by comparing the fit of alternative NBDA models using different networks. The objective here may be to
determine the particular types of relationship that are important in providing the opportunity to observe and learn. For example, in their study of common ravens (Corvus corax) Kulahci et al. (30) found that a social network based on affiliative interactions (e.g. allo-preening and food sharing) predicted the spread of novel foraging behaviour better than networks based on aggressive interactions and proximity. Alternatively, NBDA can be used to assess different hypotheses regarding social learning strategies (i.e. from whom do animals learn?) (2) or directed social learning (31). The implicit aim is to identify the network that best approximates �∀∗. The logic is that the more closely the network approximates �∀∗, the more closely the
diffusion will tend to follow the network, as quantified by AICc. (Alternatively, Whalen and Hoppitt (16) show that the Watanabe Akaike Information Criterion WAIC can be used in a Bayesian NBDA). This logic is supported by the simulations conducted in section 4. For each set of simulations AICc tended to be lower (better) for the networks that more closely approximated �∀∗, with differences becoming more pronounced as
the strength of social learning increased (see Fig. S6-7 in the Supplementary Material).
A researcher might have the combined aim of detecting and quantifying social transmission, but also making inferences about the typical pathways of diffusion. If so, the researcher can include a model with no social transmission (s= 0) in their model comparison. If no network results in an AICc that is substantially lower than that yielded from the asocial model, there is little evidence for social transmission following any of the
networks studied. If there is evidence for social transmission, the best fitting model can be used to generate estimates of the strength of social transmission, on the basis that this model is likely to best approximate the true �∀∗. There are a number of types of network that could be used the elucidate the typical pathways of
information transfer, here I discuss them in turn.
5.1 Observation networks
I showed above that a network giving the pattern of observations that occurred during the course of a diffusion is a direct and powerful way to detect and quantify social transmission. However, if the goal is to find a network that approximates �∀∗, then an observation network will usually be of little use when used as a
predictor in an NBDA. Part of the goal here is to find a network that predicts the pattern of observations that is likely to occur during a diffusion (i.e. approximate �∗�89::∀∗). The pattern of observations that happened to
occur in a specific diffusion, when used as a predictor, cannot tell us anything about what aspects of social structure influence patterns of observations in general. Therefore, it will usually make little sense to use an observation network in an NBDA for this purpose. Instead a researcher might ask if another network, N, is correlated with the observation network, and thus assess the case that the relationships quantified in N are important in determining opportunities for observation. If N is strongly correlated with the observation network, and has good predictive power (low AICc relative to other networks) in an NBDA, it suggests that N approximates the pathway of diffusion (�∀∗) well, and it does so, at least in part because it predicts the pattern
transmission occurs via observation of the target innovation, as opposed to an alternative, mutually exclusive pathway, such as exposure to the products of behaviour. In this case, an NBDA model using an observation network could be compared to a model with a network representing that alternative pathway.
5.2 Association and proximity networks
Proximity networks are derived from data on the spatial relationships among individuals: members of a dyad who are commonly in close proximity have strong connections between them (28). These include association networks, which quantify the proportion of time members of a dyad spend together. In section 4.2 above I argued that an association network based on data collected on an appropriate spatial scale is an estimate of
�89::∀∗. This leads to an interpretation of s as the rate at which information is transmitted from an informed to a
na•ve individual during periods when they are associating, relative to the rate of asocial learning. However, proximity networks are often collected on a small spatial scale, such that the individuals always remain in close proximity, such as groups housed in captivity (e.g. 8, 30) , e.g. by quantifying which individuals tend to be nearest neighbours, or within 5 body lengths. In such cases, association or relative proximity is not a necessary condition for observation to occur, e.g. an animal could quite easily observe an individual that is not its nearest neighbor, or within 5 body lengths. Consequently, for such small-scale proximity networks, there is no logical guarantee that �∀∗ will estimate �89::∀∗. Instead, use of a proximity network in an NBDA represents
the hypothesis that individuals that are often in spatial proximity to one another will learn from one another more frequently than individuals that are usually spatially separated. It may be that another type of network (see below) may predict �∀∗ better than a proximity network (e.g. 30). Even in cases where a proximity or
association network is a good estimate of �∗�89::∀∗, another network may approximate �∀∗ better if it better
captures variation in �/0123:∀∗.
A question arises as to whether researchers should use association data that is collected during the course of the diffusion, or whether they should use data collected during a different period. For example, in their study on squirrel monkeys, Cladiere et al. (32) constructed an association network based on the amount of time dyads spent together in the area of the foraging task and thus were able to observe one another solving the task (though they did not use this for an NBDA, their aims were similar). Intuitively, such a Ôdiffusion-specific networkÕ provides a better proxy for the observation network than association data collected during the weeks, months or years preceding the diffusion. For this reason, such data is likely to be more powerful for detecting and quantifying the effects of social transmission. However, for the same reasons as for the observation network, the diffusion-specific network is of little utility for an NBDA aiming to elucidate the general pathways of diffusion in the population. The diffusion-specific network will reflect the chance patterns of observation that happened to occur in the diffusion, and therefore cannot tell us anything about what aspects of social structure influence patterns of observations in general. Consequently, a diffusion-specific association network is suitable for detecting and quantifying social transmission, but not for establishing the typical pathways of information transfer.
5.3 Interaction networks
Researchers often construct social networks based on the rate at which each dyad interacts, or show a particular type of interaction (e.g. grooming, fights) (14). In animal social network analysis in general, this is often considered to be a more direct way of quantifying patterns of interactions among animals, with
proximity/ association networks providing an indirect proxy for interaction rate (14). However, when used in an NBDA, interaction networks represent a hypothesis that a particular interaction type predicts the rate at which individuals learn from one another. As such there is no reason to think of interaction networks as being preferable to proximity networks a priori for an NBDA. Instead, alternative networks can be compared against one another as competing hypotheses using AICc. Once a supported model is found, a researcher may wish to use this to quantify the importance of social transmission. The s parameter obtained will estimate the rate of social transmission per unit connection relative to the rate of asocial learning. Thus, s will be dependent on the scale of the network, and potentially difficult to interpret. Therefore, I suggest researchers transform their estimate of s into an estimated proportion of events that occurred by social transmission using Eqn. 6.
5.4 Model networks
Instead of using social networks derived from association, proximity or interaction data, a researcher could construct a network representing a hypothesis about the pathway of diffusion that is theoretically derived. For example, a hypothesis that individuals only learn from high prestige individuals (33) could be represented by a network, �∀∗, that has �∀∗= 1 when j is a high prestige individual and �∀∗= 0 otherwise (I use �∀∗ to
represent a model network to distinguish it from the association network, �∀∗, below). This model could be
tested against a model with a homogeneous network (all �∀∗=1) to test for a prestige bias in learning, or
evolved social learning strategies (2, 34, 35) in contexts and species where empirical tests (e.g. 36, 37-39) cannot be run.
In an NBDA, a copying bias could be manifested in �∗, �89:: ∀∗,�/0123: ∀∗ or some combination of the three. For
illustration, imagine we have an evolved strategy Ôcopy individuals of high prestigeÕ. This may be
implemented as a tendency to observe high prestige individuals more often, resulting in large values of �89:: ∀∗
when j has high prestige. Alternatively, or in addition, individuals may be more likely to copy behaviour after they observe it being performed by a high prestige individual, resulting in in large values of �/0123: ∀∗ when j
has high prestige. A similar copying bias might result if high prestige individuals tend to perform the
behaviour more once they have learned it (high �∗). This is unlikely to be a result of an evolved social learning
strategy, but nonetheless, would result in a similar bias in favour of learning from high prestige individuals- i.e. high values of �∀∗ when j has high prestige.
Therefore, if a researcher uses a binary network representing a particular copying bias, and finds it is supported, this provides evidence of a bias in �∀∗, which could be a result of bias in any combination of �∗,
�89:: ∀∗ and �/0123: ∀∗. The s parameter obtained will provide an estimate of the rate of transmission averaged
across all relevant dyads (i.e. average �∀∗ �% given �∀∗= 1). However, the analysis could be broken down
further to investigate where the bias lies. If a researcher has transmission weights �∗ providing a good
estimate of �∗ (see section 4.2), they can test whether �∗ tends to be higher for the target class (e.g. high
prestige) of individuals, to assess whether there is bias resulting from performance rate. They can then include
�∗ in the the NBDA: if copying bias still remains, it suggests there is bias in �89:: ∀∗ and/or �/0123: ∀∗. The s
parameter now estimates the average of �89::∀∗�/0123:∀∗ �% given �∀∗= 1. If the researcher has an association network, they can test whether �∀∗ is correlated with the binary model network, e.g. whether �∀∗ tends to be
higher when j has high prestige, thus testing for a bias in �/0123:∀∗. The researcher can then include �∀∗ in the
NBDA. A social network with connections of strength �∀∗�∀∗ with transmission weights �∗ represents the
hypothesis that there is (strong) copying bias in �/0123:∀∗. This can be compared to a weighted model using the
unaltered association matrix �∀∗, representing the hypothesis of no copying bias in �/0123:∀∗. The s parameter
obtained from an NBDA using the network �∀∗�∀∗ with transmission weights estimates �/0123:∀∗ �% given �∀∗=
1. As yet there are no studies utilizing this approach to detecting and breaking down biases in �∀∗ (but see (40)
for a similar approach).
5.5 Multiple networks
The approaches described above allow researchers to test which of a specified set of social networks best approximates �∀∗. An alternative approach is to acknowledge that social transmission might follow more than
one pathway, but do so at different rates. To this end, one can input multiple networks into an NBDA, each with a separate s parameters estimated for each network (41). The NBDA model then becomes:
�∀ � = �% 1 + Ξ �Ξ ∗ �Ξ,∀∗�∗ 1 − �∀ , Eqn. 7
where �Ξ,∀∗ is the kth social network, and �
Ξ estimates the rate of social transmission through that network. This
model can be compared to one in which s parameters are constrained, e.g. �Ψ= �Ζ, to test for evidence of a
difference in transmission rate between different pathways. It can also be compared to models in which there is no transmission along a specific pathway, e.g. �Ψ= 0 to test for evidence of social transmission along that
pathway.
It is important to note that there are two ways a researcher might then quantify and compare the importance of social transmission in the different networks. The �Ξ parameters estimate the relative strength of social
transmission per unit of network connection. The exact interpretation of �Ξ depends on the type of network, as
shown above. In addition, a researcher can estimate the proportion of events occurring by social transmission through each network, N, by modifying Eqn. 6 as follows:
�:8Μ∀1/,0= �[�[,∀∗ �0 �∗ �0 1 + Ξ �Ξ�Ξ,∀∗ �0 �∗ �0 , Eqn. 8
and taking the mean across all acquisition events. Unlike �Ξ, this figure will also take into account the strength
and number of connections in each network, in estimating the influence of each network on the diffusion. See (41) for further discussion of how to quantify the influence of each network in a multi-network NBDA.
prestige individuals socially transmit the target behaviour. It is perhaps more realistic to assume that all individuals socially transmit the behaviour, and test whether high prestige individuals do so at a higher rate. One network, �Ψ,∀∗ would contain binary connections only from high prestige individuals, whereas another
network �Ζ,∀∗ would contain binary connections from all other individuals. If a model with �Ψ> �Ζ is favoured
over a model with �Ψ= �Ζ, then it provides evidence of a prestige bias in �∀∗. The source of this bias could then be investigated in an analogous manner to that described in section 5.4.
Farine et al. (42) used multi-network NBDA to analyze the pathways by which juvenile zebra finches (Taeniopygia guttata) socially learn foraging skills. Half of the juveniles had been exposed to the avian stress hormone corticosterone (CORT) earlier in life, mimicking the effects of developmental stress. Farine et al. hypothesized that different social learning strategies would be used by finches that had experienced developmental stress (CORT) than those that had not. They constructed 8 different association networks representing transmission from 1) adults to adults; 2) juveniles to adults; 3) parents to CORT offspring; 4) adults to unrelated CORT juveniles; 5) all juveniles to CORT juveniles; 6) parents to non-CORT offspring; 7), adults to unrelated non-CORT juveniles; and 8) all juveniles to control juveniles. They then compared the predictive power of models combining different combinations of these networks. The results suggested that all individuals learned exclusively from adults. Furthermore, they found evidence of a different social learning strategy between non-CORT treated juveniles and CORT treated juveniles. The former category relied more on social transmission from their parents (bigger estimate of s for network 6 than network 7) whereas the latter relied more (almost exclusively) on social transmission from unrelated adults (bigger s for network 4 than network 3). This case study illustrates the potential of multi-network NBDA to quantify the relative importance of different pathways of information transmission.
5.6 Other approaches
Given its potential role as a tool for testing for transmission biases and social learning strategies, NBDA can be compared to experience-weighted attraction models. McElreath et al. (43) adapted these models to infer specific social learning strategies given data on the choices individuals make, and the choices they observe others making. This approach is similar to an NBDA, as it is used in section 5, insofar as both use time series of data to make inferences about pathways of learning. However, NBDA is solely concerned with the acquisition of novel behaviour (innovations) to the repertoire. In contrast, experience-weighted attraction models are concerned with the choices made by individuals when faced with a number of different behavioural options (e.g. a number of ways to solve a foraging task), and whether they adopt particular social learning strategies in making these choices. Thus the approaches answer subtly different, and potentially complementary
questions. Some combination of the two methods might also be useful: an experience-weighted attraction model might incorporate network data to account for who is likely to have observed each performance of the target behaviours. It seems likely that experience-weighted attraction models will have more power than NBDA to detect social learning strategies from detailed data (accurate dynamic observation networks), since they take into account the repeated behaviour of individuals, rather then the first time they perform a novel behavioural trait. However, NBDA may be applicable to sparser datasets (e.g. using only association data).
6.0 Conclusion
In summary, an NBDA can have two goals: 1) to detect and quantify social transmission from diffusion data, and/or 2) to make inferences about the typical pathways of diffusion and information transfer in a given species or context. Some types of social network are only generally appropriate for the first of these goals. In this paper, I have attempted to establish the conceptual foundations of NBDA, by showing how an NBDA using each type of network links to the underlying process of learning. I showed that the precise meaning of the estimate of the key parameter, s, depends on the type of network that is used. However, I suggested that quantifying the proportion of learning events that occurred by social transmission can be used as an
additional measure that transfers more easily across analyses using different networks. I showed that observation networks and association networks are robust to violations of the assumptions implicit in the NBDA model, and that such violations are not a cause to suspect a spurious positive result for social transmission. However, under some circumstances, biases can arise in estimates of the importance of social transmission, which social learning researchers should be aware of when interpreting their results. Finally, I suggested how NBDA might be used to detect social transmission biases and social learning strategies using diffusion data. Thus, NBDA might prove a valuable addition to social learning researchersÕ toolkit, in
elucidating the taxonomic distribution of such strategies, and their relationship to the emergence of traditions and culture in natural settings.
Additional Information
I am grateful to Sonja Wild, Damien Farine and Elli Leadbeater for valuable discussions about the practical applications of NBDA and the effects of error in social networks.
Competing Interests
I have no competing interests.
Funding
The work was funded by the ERC grant BeeDanceGap (638873).
References
1.
Heyes CM. Social-Learning in Animals - Categories and Mechanisms. Biol Rev. 1994;69(2):207-31. 2. Laland KN. Social learning strategies. Learning & Behavior. 2004;32(1):4-14.3. Laland KN, Galef BG, editors. The question of animal culture. Cambridge MA: Harvard University Press; 2009.
4. Reader SM. Distinguishing social and asocial learning using diffusion dynamics. Learning & Behavior. 2004;32(1):90-104.
5. Hoppitt W, Lalalnd KN. Social learning: An introduction to mechanisms, methods and models. Princeton: Princeton Univeristy Press; 2013.
6. Allen J, Weinrich M, Hoppitt W, Rendell L. Network-Based Diffusion Analysis Reveals Cultural Transmission of Lobtail Feeding in Humpback Whales. Science. 2013;340(6131):485-8.
7. Hobaiter C, Poisot T, Zuberbuehler K, Hoppitt W, Gruber T. Social Network Analysis Shows Direct Evidence for Social Transmission of Tool Use in Wild Chimpanzees. Plos Biology. 2014;12(9).
8. Boogert NJ, Reader SM, Hoppitt W, Laland KN. The origin and spread of innovations in starlings. Anim Behav. 2008;75:1509-18.
9. Atton N, Hoppitt W, Webster MM, Galef BG, Laland KN. Information flow through threespine stickleback networks without social transmission. Proceedings of the Royal Society B-Biological Sciences. 2012;279(1745):4272-8.
10. Duboscq J, Romano V, MacIntosh A, Sueur C. Social Information Transmission in Animals: Lessons from Studies of Diffusion. Frontiers in Psychology. 2016;7.
11. Franz M, Nunn CL. Network-based diffusion analysis: a new method for detecting social learning. Proceedings of the Royal Society B-Biological Sciences. 2009;276(1663):1829-36.
12. Hoppitt W, Kandler A, Kendal JR, Laland KN. The effect of task structure on diffusion dynamics: Implications for diffusion curve and network-based analyses. Learning & Behavior. 2010;38(3):243-51.
13. Aplin LM, Farine DR, Morand-Ferron J, Sheldon BC. Social networks predict patch discovery in a wild population of songbirds. Proc Biol Sci. 2012;279(1745):4199-205.
14. Croft DP, James R, Krause J. Exploring Animal Social Networks. Oxford: Princeton University Press; 2008.
15. Nightingale G, Boogert NJ, Laland KN, Hoppitt W, Krause J, James R, et al. Quantifying diffusion in social networks: a Bayesian approach. Animal Social Networks. 2015:38-52.
16. Whalen A, Hoppitt WJE. Bayesian Model Selection with Network Based Diffusion Analysis. Frontiers in Psychology. 2016;7.
17. R Core Team. R: A Language and Environment for Statistical Computing. 2.10.1 ed. Vienna: R Foundation for Statistical Computing; 2017.
18. Hoppitt W, Kandler A, Kendal J, Laland K. The effect of task structure on diffusion dynamics: Implications for diffusion curve and network-based analyses. Learning & Behavior. 2010;38(3):243-51. 19. Franz M, Nunn CL. Investigating the impact of observation errors on the statistical performance of network-based diffusion analysis. Learning & Behavior. 2010;38:235-42.
20. Centola D, Macy M. Complex contagions and the weakness of long ties. Am J Sociol. 2007;113(3):702-34.
21. Terkel J. Cultural Transmission in the Black Rat - Pine-Cone Feeding. Advances in the Study of Behavior, Vol 24. 1995;24:119-54.
22. Hoppitt W, Farine DR. Association Indices For Quantifying Social Relationships: How To Deal With Missing Observations Of Individuals Or Groups. bioRxiv. 2017:117044.
23. Cairns SJ, Schwager SJ. A Comparison of Association Indexes. Anim Behav. 1987;35:1454-69.
24. Lusseau D, Whitehead H, Gero S. Incorporating uncertainty into the study of animal social networks. Anim Behav. 2008;75:1809-15.
25. van de Waal E, Renevey N, Favre CM, Bshary R. Selective attention to philopatric models causes directed social learning in wild vervet monkeys. Proceedings of the Royal Society B-Biological Sciences. 2010;277(1691):2105-11.
26. Whitehead H. Analyzing Animal Societies: qunatitative methods for vertebrate social analysis. London: University of Chicago Press; 2008.
28. Farine DR. Proximity as a proxy for interactions: issues of scale in social network analysis. Anim Behav. 2015;104:E1-E5.
29. Boogert NJ, Nightingale GF, Hoppitt W, Laland KN. Perching but not foraging networks predict the spread of novel foraging skills in starlings. Behavioural Processes. 2014;109:135-44.
30. Kulahci IG, Rubenstein DI, Bugnyar T, Hoppitt W, Mikus N, Schwab C. Social networks predict selective observation and information spread in ravens. Royal Society open science. 2016;3(7):160256. 31. Coussi-Korbel S, Fragaszy D. On the relation between social dynamics and social learning. Anim Behav. 1995;50:1441-53.
32. Claidiere N, Messer EJE, Hoppitt W, Whiten A. Diffusion Dynamics of Socially Learned Foraging Techniques in Squirrel Monkeys. Current Biology. 2013;23(13):1251-5.
33. Henrich J, Gil-White FJ. The evolution of prestige: freely conferred deference as a mechanism for enhancing the benefits of cultural transmission. Evol Hum Behav. 2001;22(3):165-96.
34. Rendell L, Fogarty L, Hoppitt WJE, Morgan TJH, Webster MM, Laland KN. Cognitive culture: theoretical and empirical insights into social learning strategies. Trends Cogn Sci. 2011;15(2):68-76. 35. Henrich J, McElreath R. The evolution of cultural evolution. Evol Anthropol. 2003;12:123-35. 36. Webster MM, Laland KN. Social learning strategies and predation risk: minnows copy only when using private information would be costly. Proc Biol Sci. 2008;275(1653):2869-76.
37. Pike TW, Kendal JR, Rendell LE, Laland KN. Learning by proportional observation in a species of fish. Behav Ecol. 2010;21(3):570-5.
38. Pike TW, Laland KN. Conformist learning in nine-spined sticklebacks' foraging decisions. Biol Lett. 2010;6(4):466-8.
39. Morgan TJH, Rendell LE, Ehn M, Hoppitt W, Laland KN. The evolutionary basis of human social learning. Proceedings of the Royal Society B-Biological Sciences. 2012;279(1729):653-62.
40. Kendal R, Hopper LM, Whiten A, Brosnan SF, Lambeth SP, Schapiro SJ, et al. Chimpanzees copy dominant and knowledgeable individuals: implications for cultural diversity. Evolution and Human Behavior. 2015;36(1):65-72.
41. Farine DR, Aplin LM, Sheldon BC, Hoppitt W. Interspecific social networks promote information transmission in wild songbirds. Proceedings of the Royal Society B-Biological Sciences. 2015;282(1803). 42. Farine DR, Spencer KA, Boogert NJ. Early-Life Stress Triggers Juvenile Zebra Finches to Switch Social Learning Strategies. Curr Biol. 2015;25(16):2184-8.
43. McElreath R, Bell A, Efferson C, Lubell M, Richerson P, Waring T. Beyond existence and aiming outside the laboratory: estimating frequency-dependent and pay-off-biased social learning strategies. Philos T R Soc B. 2008;363:3515-28.
Figure and table captions
Figure 1. Performance of NBDA (OADA variant) using a dynamic observation network, when there is error in identifying observers. The top panels show type 1 error rate (a) and statistical power for �/0123:= 0.2 (b) as a
function of the reliability of the observation proxy. The bottom panels show the proportion of simulations for which the real proportion of social transmission events was within the 95% C.I. (light grey), underestimated (dark grey) or overestimated (white) for �/0123:= 0 (c) and �/0123:= 0.2 (d). Results were similar for the TADA
variant of NBDA.
Figure 2. Performance of NBDA using an association network when there was noise (top panels) or bias (bottom panels) in the network. The plots show the proportion of simulations in which the true value of the s
parameter (giving the strength of social transmission) was within the 95% C.I. (circles), overestimated (crosses) or underestimated (triangles). The horizontal dashed line shows 95%: ideally the true value should be within the 95% C.I. 95% of the time. The left panels show the performance of the OADA variant of NBDA, the right panels show the performance of the TADA variant. Positive bias means that large network connections are overestimated relative to smaller one, whereas negative bias means small network connections are
Figure 1
0.2 0.4 0.6 0.8 1.0
0
20
40
60
80
100
S
ta
ti
st
ic
al
po
w
er (%)
a)
0.2 0.4 0.6 0.8 1.0
0
20
40
60
80
100
Reliability of observation proxy Plearn= 0
% S
im
ul
at
ions
c)
0.2 0.4 0.6 0.8 1.0
0
20
40
60
80
100 b)
0.2 0.4 0.6 0.8 1.0
0
20
40
60
80
100
Reliability of observation proxy Plearn= 0.2
Figure 2
0.00 0.05 0.10 0.15 0.20 0.25 0.30
0
20
40
60
80
100
Random noise in network
% S
im
ul
a
ti
ons
OADA
a)
True value of s within 95% C.I. s underestimated
s overestimated
−0.2 −0.1 0.0 0.1 0.2
0
20
40
60
80
100
Bias in network
% S
im
ul
a
ti
ons
c)
0.00 0.05 0.10 0.15 0.20 0.25 0.30
0
20
40
60
80
100
Random noise in network
TADA
b)
−0.2 −0.1 0.0 0.1 0.2
0
20
40
60
80
100