EC COMMODITIES IMPORTS FROM
THE DEVELOPING COUNTRIES
1976-1987
Theme External trade
eurostat
OFICINA ESTADÍSTICA DE LAS COMUNIDADES EUROPEAS DE EUROPÆISKE FÆLLESSKABERS STATISTISKE KONTOR STATISTISCHES AMT DER EUROPÄISCHEN GEMEINSCHAFTEN ΣΤΑΤΙΣΤΙΚΗ ΥΠΗΡΕΣΙΑ ΤΩΝ ΕΥΡΩΠΑΪΚΩΝ ΚΟΙΝΟΤΗΤΩΝ STATISTICAL OFFICE OF THE EUROPEAN COMMUNITIES OFFICE STATISTIQUE DES COMMUNAUTÉS EUROPÉENNES ISTITUTO STATISTICO DELLE COMUNITÀ EUROPEE
BUREAU VOOR DE STATISTIEK DER EUROPESE GEMEENSCHAPPEN SERVIÇO DE ESTATÍSTICA DAS COMUNIDADES EUROPEIAS
L-2920 Luxembourg - Tél. 43011 - Télex: Comeur Lu 3423
B-1049 Bruxelles, bâtiment Berlaymont, rue de la Loi 200 (bureau de liaison) - Tél. 2351111
Las publicaciones de Eurostat están clasificadas por temas y por series. La clasificación se encuentra al final de la obra. Para mayor información sobre las publicaciones, rogamos se pongan en contacto con Eurostat.
Para los pedidos, diríjanse a las oficinas de venta cuyas direcciones figuran en la página interior de la contracubíerta.
Eurostats publikationer er klassificeret efter emne og serie. En oversigt herover findes bag i hæftet. Yderligere oplysninger om publikationerne kan fås ved henvendelse til Eurostat.
Bestilling kan afgives til de salgssteder, der er anført på omslagets side 3.
Die Veröffentlichungen von Eurostat sind nach Themenkreisen und Reihen gegliedert. Die Gliederung ¡st hinten in jedem Band aufgeführt. Genauere Auskünfte über die Veröffentlichungen erteilt Eurostat. Ihre Bestellungen richten Sie bitte an die Verkaufsbüros, deren Anschriften jeweils auf der dritten Umschlagseite der Veröffentlichungen zu finden sind.
Οι εκδόσεις της Eurostat ταξινομούνται κατά θέμα και κατά σειρά. Η ακριβής ταξινόμηση αναφέρεται στο τέλος κάθε έκδοσης. Για λεπτομερέστερες πληροφορίες σχετικά με τις εκδόσεις, μπορείτε να απευθύνεσθε στην Eurostat.
Για τις παραγγελίες μπορείτε να απευθύνεσθε στα γραφεία πώλησης, των οποίων οι διευθύνσεις αναγράφονται στη σελίδα 3 του εξωφύλλου.
Eurostat's publications are classified according to themes and series. This classification is indicated at the end of the publication. For more detailed information on publications, contact Eurostat.
Orders are obtainable from the sales offices mentioned on the inside back cover.
Les publications de l'Eurostat sont classées par thème et par série. Cette classification est précisée à la fin de l'ouvrage. Pour des informations plus détaillées sur les publications, contactez l'Eurostat.
Pour les commandes, adressez-vous aux bureaux de vente dont les adresses sont indiquées à la page 3 de la couverture.
Le pubblicazioni dell'Eurostat sono classificate per tema e per serie. Tale classificazione è precisata alla fine dell'opera. Per informazioni più dettagliate sulle pubblicazioni rivolgersi all'Eurostat.
Per eventuali ordinazioni rivolgersi a uno degli uffici di vendita i cui indirizzi figurano nella 3a pagina della copertina.
De publikaties van Eurostat zijn ingedeeld naar onderwerp en serie. Deze indeling is achter in het boek opgenomen. Voor nadere informatie over de publikaties kunt u zich wenden tot Eurostat.
Gelieve bestellingen op te geven bij de verkoopbureaus, waarvan de adressen op bladzijde 3 van de omslag zijn vermeld.
As publicações do Eurostat estão classificadas por tema e por série. Esta classificação está indicada no fim da obra. Para mais informações sobre as publicações é favor contactar Eurostat.
This study was carried out by C. Tsoutsoplides and A. Zivoder for the OSCE in Luxembourg.
Luxembourg: Office for Official Publications of the European Communities 1990
ISBN 92-826-1624-X
Catalogue number: CA-57-89-112-EN-C
© ECSC-EEC-EAEC, Brussels · Luxembourg, 1990
Reproduction is authorized, except for commercial purposes, provided the source is acknowledged
A. The EC as Importer of Commodities 1
B. The Composition of EC Imports of Commodities 5
C. Diversification of the EC Sourcing of Commodities 5
CI. Regional Breakdown of the EC Commodity Sourcing 8
C2. Regional Breakdown of the EC Commodity Sourcing by Broad Economic Category 8
C2.a. Agricultural Raw Materials 8
C2.b. Commodities for Final Consumption 9
C2.C Industrial Raw Materials 9
C3. The Relative Importance of the EC as Commodity Importer from Class 2 10
C4. EC Import Specialisation by Regions 11
C5. EC Commodity Sourcing from Different Class 2 Income Groups 12
PART TWO: ANALYSIS BY INDIVIDUAL COMMODITIES 28
A. Primary Commodities for Food and Beverages Industry 28
B. Semi-Processed Commodities for Food and Beverages Industry 29
C. Food and Beverages for Household Consumption 29
D. Mining Primary Industrial Raw Materials 29
E. Agricultural Primary Industrial Raw Materials 30
F. Mining Semi-Processed Industrial Raw Materials 30
G. Agricultural Semi-Processed Industrial Raw Materials 31
PART THREE: EC IMPORTS OF COMMODITIES FROM CLASS 2 BY STAGES OF
PROCESSING 43
A. EC Commodities Imports from Class 2 by Stages of Processing 43
B. EC Commodities Imports by Stages of Processing from Different Class 2 Regions 43
Bl. ACP 43
B2. LA20 45
B3. Class 2 Asia 45
B4. Mediterranean 46
B5. LLDCs 47
PART FOUR: EC IMPORTS OF COMMODITIES FROM INDIVIDUAL LDCs 57
A. Imports from Latin American LDCs 57
B. Imports from ACPs 59
C. Imports from Asian LDCs 60
D. Imports from Mediterranean Accords LDCs 61
PART FrVTC: EC IMPORTS OF PRIMARY FUELS AND LUBRICANTS 68
METHODOLOGICAL ANNEX i
SUMMARY AND CONCLUSIONS
This study uses an original
definition of "commodities"
based on the UNCTAD hst of commodities
and edited according to suggestions of the EC Commission interested services and a minimum
threshold for value of commmodities imported by the EC. Moreover, some semi-processed goods,
that possess such "commodities" characteristics as no notable product differentiation and reasonably
low value added involving rather straightforward and standardised processing techniques, were
added.
The EC suppliers among Less Developed Countries (LDCs) are broken down into four groups (ACP,
Mediterranean LDCs, Asian LDCs and Latin American LDCs) according to the type of their
bilateral development cooperation links with the Community. At some points in the discussion a
classification according to the LDCs' income criteria ( OPEC, NICs, Middle Income LDCs, LLDCs)
is also used.
The product classification used is SITC
Rev.
1. Moreover, the commodities are divided into seven
groups using United Nations' Broad Economic Categories definition. Fuels and lubricants are treated
briefly in a separate part of this study due to the difference in the nature of international trade in
these commodities.
The main findings of the study are:
PART ONE
The EC is the major commodities importer among the industrialised countries.
Half its commodities imports come from the LDCs. Indeed, EC imports from the LDCs tend to
concentrate on commodities, a concentration that was significantly increased since 1976.
The value of EC commodities imports from the LDCs exhibited a modest increasing trend from 1978
to 1984 and a decrease in the subsequent three years. This pattern is not unlike that of the evolution
of the value of the commodities imports of the rest of the industrialised world.
When taking note of these developments however, one should bear in mind that:
-The dollar appreciated vis-a-vis the ECU up to 1985 only to fall in 1986 and 1987.
-The unit values of the most important commodities imported by the EC showed a decrease in the
second half of the 1980's.
Half the EC commodities imports from the LDCs are
food and beverages
and the other half
industrial raw materials.
A third of the EC commodities imports from the LDCs are
primary
commodities for food and beverages industry
Latin America
is the most important commodities supplier among developing regions, providing
some 20% of total 1987 EC commodities imports, followed by the
ACPs
(17%) and the
Asian LDCs
(11%).
consumption (1/4), mining primary industrial raw materials (1/5) and agricultural semi-processed
industrial raw materials (1/5).
Half the EC 1987 total imports of semi-processed commodities for food and beverages industry came
from the ACPs.
Both the ACPs and the Asian LDCs supplied some 16% of total 1987 EC imports of agricultural
primary industrial raw materials.
The ACPs and Latin America supplied about 15% of total 1987 EC imports mining semi-processed
industrial raw materials.
The EC is the leading LDCs' export market for commodities, absorbing in 1987 half the industrialised
countries imports of commodities from the LDCs. The EC in fact specialises in the import of every
group of commodities from the developing world.
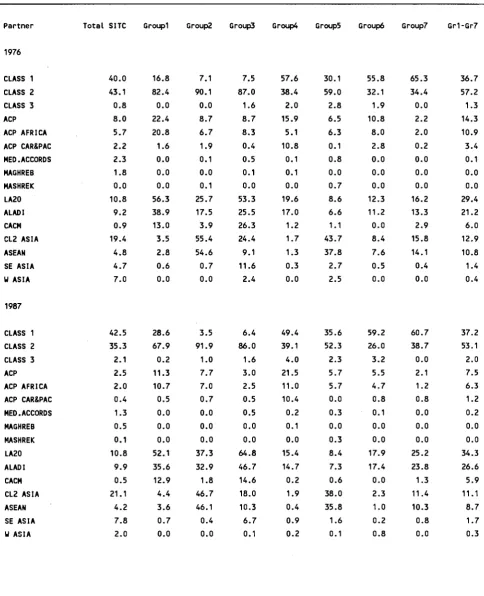
Examining the EC commodity sourcing from different developing regions according to their income it
transpires that middle income LDCs provided some 2/3 of the EC total commodities imports, while a
fifth originated in the NICs. The OPEC countries and the Least Developed Countries (LLDCs)
supplied 7.9% and 6.4% of the 1987 total EC commodities imports.
PART TWO
Coming to the examination of EC imports of individual commodities from the LDCs, one notices that
only coffee accounts for 15.8% of total 1987 EC commodity imports. Their second most important
commodity imported from the LDCs is vegetable oil residues accounting for almost 7% in 1987. Part
two provides information about the evolution of the value, volume and unit value of the imports
during the 1976-1987 period of thirty individual products imported by the EC from the LDCs.
PART THREE
A classification of about a fourth of the commodities imported by the EC into two or three stages of
processing shows that two thirds of these imports were products with the lowest level of processing
(stage 1) while the most processed (stage 3) represented just 10% of them. In 1976, for all the three
stages the main supplier were the ACPs; by 1987, ACPs remained the most important supplier only
for stage two commodities. The LLDCs tend only to supply commodities with the least value added.
PART FOUR
Considering EC commodities imports from individual LDCs one notices that Brazil alone accounted
for 17% of the EC commodities imports from the LDCs; Ivory Coast, Malaysia, Argentina and
Colombia in the 5% region; Indonesia, Chile and Thailand in the 4% region; Zaire and Cameroon in
the 3% region and Israel, Morocco, Peru and Philippines in the 2% region.
PART FIVE
The EC is the major commodity importer in the world. In 1987 the EC imported 50 billions of ECU
worth of commodities (A. 1.1, Illustration 1.1). The USA imported about 19 billions of ECU (A.1.2),
Japan about 27 billions of ECU (A.1.3) and the rest of the DCs about 17 billions of ECU (A.1.4). In
fact, not only the EC alone accounts for half the industrialised countries' commodities imports from
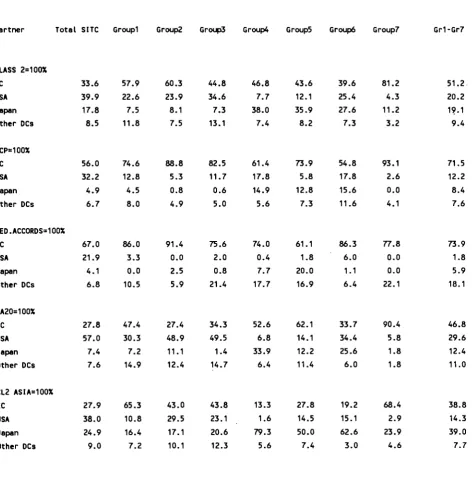
Class 2 but it is also the major importer in all commodities groups (Table 1.1).
The evolution of the commodities imports of all industrial economies presented a similar pattern.
There was a modest tendency for increase from 1976 to 1984 and a subsequent modest decrease. This
however, seems to follow the pattern of the evolution of the exchange rate of the dollar vis-a-vis the
ECU, especially between 1980 and 1984.
The predominance of the EC as a commodity importer does not only relate to its overall size as an
importer, but it emanates from the very needs of its economies. Indeed, commodities imports in 1987
represented slightly less than a fourth of total EC imports (Table 1.2). By comparison, commodities
represented a mere 7.8% of the total 1987 imports of the USA (Table 1.3) 16.6% of total Japanese
imports (Table 1.4) and 16.9% of the rest of the DCs 1987 imports (Table 1.5).
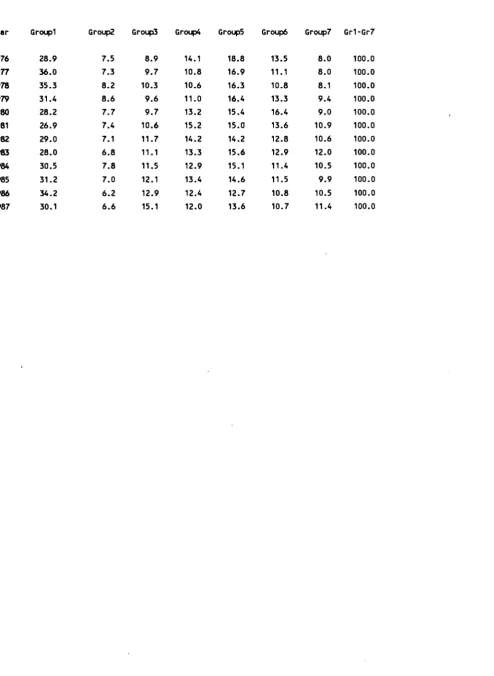
The EC has always had a great emphasis on commodities imports ranging between a fourth and a
fifth of its total imports throughout the 1976-1987 period. (Illustration 1.2)
In the case of Japan, the share of commodities in its total imports fluctuated between 19.4% (in 1979)
and 12.4% (in 1981) only to find itself in 1987 slightly lower than its 1976 level. The share of
commodities in the rest of the DCs imports fluctuated between 15% and 25% starting from 20% in
1976.
On the other hand, the share of commodities imports in the USA was halved from its 14.5% level in
1976 registering the most impressive reduction of all DCs in an already rather modest share of
commodities in its total imports. What is noticeable is that while the percentage share of imports of
all commodities groups were halved or reduced even more drastically, those of food and beverages
for household consumption actually increased. This could point to the tentative explanation that the
USA has turned more towards processing on the location where the resources are produced, possibly
through US multinationals. Another explanation for the falling of the share of commodities in total
US imports, is the increase in manufactured imports from sources such as Japan or the NICs.
During the first half of the 1980's the unit values of commodities (if we can use as a proxy for
commodities according to our definition, SFTC 0+1 + 2 + 4) exhibited an increase in the 40%-50%
region, but in 1986 and 1987 came down to its 1980 level. The 1987 unit values of EC commodities
imports from Extra EUR 12 and the Mediterranean region maintained an increase over the 1980
levels of 10% and 15% respectively. An explanation for their deviation from the pattern could be in a
difference in their supply structure, whereby they provided a greater share of commodities with
relatively greater value added.
The volume of EC commodities imports on the other hand, exhibited the opposite trends. Between
1979 and 1881 a falling trend may be observed which was subsequent reversed. By 1987, the Latin
American and the LLDCs suppliers had increased their volume over 1980 in the region of 20%, the
other Class 2 suppliers in the region of 12%, with extra EUR 12 as a whole remaining stable.
(Illustration 1.3)
The heavy emphasis of EC imports on commodities, illustrates the fact that the EC is relatively
resource-starved in many commodities.
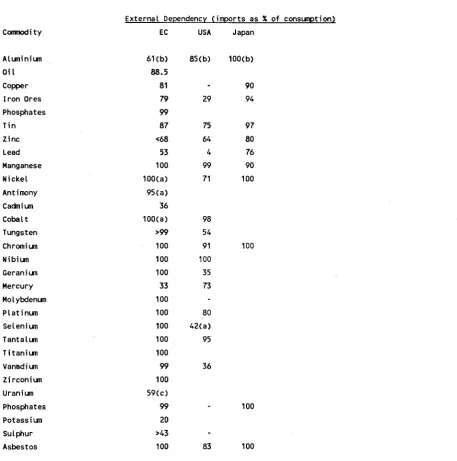
UNCTAD in its publications regularly provides a measure of the EC, USA and Japanese levels of
external dependency (Table 1.6). Although the UNCTAD definition of commodities differs from the
one adopted here, the information provided is of great interest.
All three economies level of external dependency in primary products is much higher than their
overall level of external dependency; in the case of Japan rising to more than five times as much.
In the first four parts of the analysis "commodities" exclude fuels and lubricants that are examined
1975 1977 197» 1979 1900 19B1 19B2 1 9 » 19B4 1 9 » 19B5 19B7
Ξ Other DCs
USA
Π Japan
EC
2 9
2 0
-X
1 3
1 Q
-1B76 1077 1B7B 1B7B 1BBD 1BB1 1BBZ 1BBJ 1BB4 1ΒΠ5 1BB6 1BB7
I
130-r
120--Q
110-->
100-
-90
Med.
sf
/ / /
¿f
"•••Cx" .*'
ACP
, '
m.S
w- -*- -— . . - * " '
' ...
/Par
Eastl
H 1 1 h
H H
1979 1 9 » 1991 19B2 1 9 » 19 »4 1 9 » 1 9 »
19B7
Note: 1980=100.0
Turning now to particular industries one can note the following:
The sector where the EC has the greatest degree of external dependency is mining and quarrying
activities (86% for 1984-5). Its greatest dependency on Third World sources however is in the "coal,
petroleum and natural gas" item (38%) where its level of overall external dependency is 57%; it is
worth underlining however, as it becomes apparent in the fifth part of this study, that the bulk of this
dependency on Class 2 is in petroleum and to a lesser degree natural gas. In agriculture the EC
imported in 1984-5 about a fifth of its requirements, half of it from the Third World. In all three of
these industries the EC is more externally dependent than the USA but less than Japan.
The degree of the EC, USA and Japanese external dependency for a number of important
commodities was presented by Hager and Noekle (Table 1.8). As it appears, not only there exists a
high degree of external dependency for most of the commodities examined, but this is in most cases
higher than that of the USA and only similar or lower than Japan.
EC commodities imports from Class 2 face none or very small tariff barriers, as a result of bilateral
(Mediterranean Accords), regional (Lomé Convention), or global (GSP) preferential agreements.
B. THE COMPOSITION OF EC IMPORTS OF COMMODITIES
An important feature of the composition of the EC imports from Class 2 throughout the 1976-1987
period, is that food and beverages (Groups 1+2+3)
2and industrial raw materials (Groups
4+5+6+7) each command approximately half the share (calculated from Table 1.7).
On the contrary, industrial raw materials accounted for three quarters the EC commodities imports
from Class 1 both in 1976 and 1987 (calculated from Table A.l.l).
Three observations transpire from examining the structure of EC commodities imports from Class 2
(Table 1.7, Illustration 1.4):
The group that dominates the EC imports from Class 2 is primary commodities for food and
beverages industry (Group 1), which represents a third of total commodity imports. By comparison,
primary commodities for food and beverages industry accounted for only 14% of EC commodities
imports from Class 1 in 1987.
The share of food and beverages for household consumption (group 3) increased from 9% in 1976 to
15% in 1987. Between these dates the absolute value of EC imports of this commodity group from
Class 2 increased by 2.3 times, which is what roughly happened with imports from Class 1.
The share of all industrial raw materials, except agricultural semi-processed industrial raw materials
(Group 7) fell during the 1979-1987 period.
Overall, it may be concluded, that although the relative share of food and beverages and industrial
raw materials imported by the EC from Class 2 remained rather stable over the 1979-1987 period,
there was an increasing concentration on food and beverages for household consumption in the first
case and an increasingly even share among the various groups of the second (Illustration 1.4).
C. DIVERSIFICATION OF THE EC SOURCING OF COMMODITIES
Class 2 plays a more important role as an EC supplier when it
comes to commodities. While in 1987
it supplied less than a third of total EC imports, it was the source of half the EC imports of
commodities. In fact the situation in 1976 was rather different, with Class 2 representing
approximately 47% of both total EC imports and EC imports of commodities (Table 1.9) thus
increasing the concentration of EC imports from Class 2 on commodities (Illustration 1.5).
2
40 τ
»
-
30--a
»■
01
c
□a
zo-
15-
105
-1
S=í :K=MÍS S s
m m W
m
W&j
1976 1977 1975 1979
19»
1901
190-2 19»
1954 19»
19»
1957
3 D
-
20-I D ·
+
+
+
+
3 4 5
Commodity Groups
corresponding shares of Class 2 in the rest of the DCs imports illustrate its smaller overall weight in
these markets. Class 2 supplied a mere 10% of its overall imports and 28% of its commodities
imports (Table 1.12).
CI. Regional Breakdown of the EC Commodity Sourcing
The different geographical orientation of the various DCs with respect to the different developing
regions that is observed in their overall imports also biases their sourcing of commodities from
Class 2.
In 1987 Latin America was the most important broad Class 2 region as a supplier of commodities to
the EC (Table 1.9), the USA (Table 1.10) and the rest of the DCs (Table 1.12), with the exception of
Japan (Table 1.11) whose most important supplier were the Asian LDCs.
Latin America supplied 5.6% of the EC's total imports in 1987, which is a third of the Asian LDCs'
share. By contrast, their share of the EC imports of commodities (20.5%) was almost double that of
the Asian LDCs (11.4%).
Latin America's predominance as a commodity supplier is even more pronounced in the USA import
market. While the Asian LDCs (21.1%) had double the Latin America's share (10.8%) in USA's
overall imports in 1987, Latin America's share of USA commodities imports (34.3%) is three times
the Asian LDCs share (11.1%).
Latin America's share of the Japanese import market (4%) was ten times smaller than that of the
Asian LDCs (40%) in 1987. It is thus not surprising that the share of commodities that Japan imports
from Latin America are half (10.2%) the share of that from Asian Class 2 (21.5%).
The share of Latin America in the rest of the DCs imports in 1987 was a mere 1.9% while that in
commodities is 14.5%. The Asian LDCs' share in their commodities imports (6.8%) was almost the
same as that in their total imports (6.6%).
The EC's relatively greater emphasis on imports from the ACPs and the Mediterranean LDCs is also
illustrated in its imports of commodities. The ACPs are the second most important broad Class 2
region as a commodity supplier to the EC, accounting for 16.6% of its commodities imports in 1987.
For USA Japan and the rest of the DCs it is the third most important supplying well under a fifth of
their imports of commodities in 1987. Although the Mediterranean LDCs are the smallest Class 2
commodities supplier for all DCs, its share in the EC import market is markedly greater than that in
the USA Japan and the other DCs. This is not only understandable in terms of the relatively smaller
geographical distance, but also in terms of historically established commercial links. The role of tariff
preferences is negligible when it comes to commodities imports where the preference margin is
minimal or non-existent.
Comparing the 1987 with the 1976 picture, this most important change in terms of the geographical
orientation of the EC commodities imports is the increase in the share of LA20. The same change
took place with regard to the USA imports, although while in that case the increase in the LA20 share
took place at the expense of that of the ACPs, in the case of the EC the increase took place at the
expense of imports from Class 1. Class 2 Asia increased its share in Japanese commodities imports at
the expense of Class 1.
C2. Regional Breakdown of the EC Commodity Sourcing by broad economic category
C2.a. Agricultural raw materials
A third of the EC imports of primary commodities for food and beverages industry (group 1) in 1987
came from LA20, a quarter from the ACPs and a fifth from the Asian Class 2. The share of Class 2 as
a whole increased from 61% in 1976 to 70% in 1987.
More than half the USA's imports of primary commodities for food and beverages industry in 1987
came from Latin America, a tenth from Africa and a mere 4.4% from the Asian LDCs.
American LDCs.
The USA geographical structure is markedly different. Almost half the 1987 imports of
semi-processed commodities for food and beverages industry came from the ASEAN and a third from
ALADI, with Africa supplying a mere 7%.
This is similar to the Japanese structure, where some 40% of the 1987 imports of semi-processed
commodities for food and beverages industry came from ASEAN, 13% from Latin America and less
than 2% from the ACPs.
For the rest of the DCs, 18% came from ASEAN, 11% from Latin America and 8% from the ACPs.
C2.b. Commodities for final consumption
A quarter of the EC's imports of food and beverages for household consumption (group 3) in 1987
came from Latin America, a fifth from the Asian LDCs and about 13% from both the ACPs and the
Mediterranean LDCs. Most notable is the share coming from the Mediterranean Accords LDCs
other than Maghreb and Mashrek. Since 1976 a dramatic increase in the LA20 share took place at
the expense of the share of all other regions.
As much as two thirds of the USA imports of food and beverages for household consumption come
from Latin America, a fifth from Asian LDCs and only 3% from the ACPs.
A third of Japan's imports of food and beverages for household consumption come from the Asian
LDCs, with ALADI providing some 4%.
A fifth of the rest of the DCs imports of food and beverages for household consumption come from
Latin America, a tenth from Class 2 Asia and 6.2% from the Mediterranean.
Once again one may notice a clear bias among different DC regions favouring geographically closer
sources.
C2.C Industrial raw materials
A fifth of the EC's imports of mining primary industrial raw materials (group 4) in 1987 came from
LA20, 13.5% from the ACPs, 6.3% from the Mediterranean LDCs (4.7% from Maghreb) and a mere
3% from the Asian LDCs. Once more, since 1976 Latin America increased its share of the EC import
market at the expense of the other regions.
Contrary to expectations, the ACPs supplied a fifth of the 1987 USA imports of mining primary
industrial raw materials (equally divided between Africa and the Carribean and Pacific) while 15%
come from ALADI and only less than 2% from Asian LDCs.
Almost 23% of Japan's imports of mining primary industrial raw materials in 1987 came from the
Asian LDCs, 18.4% from ALADI and 4.3% from the ACPs, with 3.6% actually originating in the
Carribean and Pacific.
Some 8% of the rest of the DCs imports of mining primary industrial raw materials in 1987 came
from Latin America and around half as much from each of Class 2 Asia, the ACPs and the
Mediterranean Accords.
The ACPs and Asian LDCs each supplied about 16% of the EC's 1987 imports of agricultural
primary industrial raw materials (group 5). The Latin American share was uncharacteristically low
at 8%, while that of the Mediterranean LDCs was 2.4%. Both the ACPs and the Asian LDCs
increased their share since 1976.
The Asian LDCs supplied as much as 38% of the 1987 USA imports of agricultural primary industrial
raw materials (some 36% originating in the ASEAN). The Latin America only provided 8.4% and
Africa 5.7%.
Less than 12% of the rest of the DCs 1987 imports of agricultural primary industrial raw materials
came from the Asian LDCs, some 4% from the ALADI and Africa and about 2% from the
Mediterranean Accords LDCs.
The ACPs and Latin America supplied 14.4% and 14.8% respectively of the 1987 EC imports of
mining semi-processed industrial raw materials (group 6). The Asian LDCs represented a mere
2.6% of EC imports and the Mediterranean LDCs 1.6%. The overall Class 2 share suffered a
substantial reduction from its 1976 level, most of illustrating a fall in the ACPs and Asian LDCs
share.
The ALADI provided 17.4% of the USA 1987 imports of mining semi-processed industrial raw
materials, the ACPs 5.5% and the Asian LDCs a mere 2.3%.
Some 16% of Japan's 1987 imports of mining semi-processed industrial raw materials came from
ALADI, 12% from the Asian LDCs and 6% from Africa.
Some 7% of the rest of the DCs imports of mining semi-processed industrial raw materials in 1987
came from the ACPs (as much as 5.2% from the Carribean and the Pacific) and 6% from Latin
America.
A fifth of the 1987 EC imports of agricultural semi-processed industrial raw materials (group
7)came from Latin America. The Asian LDCs supplied 13.7%, while Africa provided less than 4%.
What is noticeable is the increase in Latin America's share since 1976.
Almost a quarter of the USA imports of agricultural semi-processed industrial raw materials in 1987
came from ALADI, a tenth from ASEAN and as little as 2% from the ACPs.
Interestingly enough, some 30% of Japan's imports of agricultural semi-processed industrial raw
materials came from ASEAN and only 2.3% from ALADI.
About 5% of the rest of the DCs 1987 imports of agricultural semi-processed industrial raw materials
came from ASEAN and 2.4% from ALADI.
Latin America showed the greatest increase in its share of EC commodities imports between 1976
and 1987, thus acquiring the position of greatest importance as an EC commodity supplier relatively
to the other developing regions. This development was due to sharp increases in the share of food
and beverages for household consumption and agricultural semi-processed industrial raw materials.
On the other hand, the fall of ACP from the first position is attributed to a fall in the share of all
categories except agricultural primary industrial raw materials.
The comparatively greater increase in Latin America's importance as a USA commodity supplier
over the 1976-1987 period, also owed a lot to a spectacular increase in the share of semi-processed
commodities for food and beverages industry where in the case of EC imports Latin America's share
actually registered a sharp decrease.
The virtual halving of the ACP's share in USA commodities imports was due to a collapse of their
share in most of the sectors.
The Asian LDCs share of Japanese imports registered the greatest increase over the 1976-1987
period. This was due to the increase in the share of primary commodities for food and beverages
industry, semi-processed commodities for food and beverages industry and food and beverages for
household consumption, with the last one being the sharpest, against a background of falling shares in
all other sectors and most notably in agricultural primary industrial raw materials.
The most impressive increase in Latin America's share of Japanese commodities imports over the
1976-1987 period, was noticed in mining semi-processed industrial raw materials.
C3. THE RELATTVE IMPORTANCE OF THE EC AS COMMODITY IMPORTER FROM CLASS 2
market for all Class 2 commodity exporters.
It is immediately apparent that the bias that different regions have for the EC import market is also
illustrated in the case of commodities.
Indeed, in the cases of the ACPs and the Mediterranean LDCs that the EC represented 56% and
67% respectively in the DCs imports from these regions, it represents in the cases of total
commodities imports as much as 71.5% and 73.9% respectively. In the cases of LA20 and Class 2
Asia where the EC represents 28% of the DCs imports, its share in the total commodities imports is
47% and 39% respectively.
It is however worth noticing that the sheer size of the EC as a commodity importer places it at a more
important position than the USA with regards to commodities imports from LA20 and at the same
level of importance with Japan with regard to commodities imports from Class 2 Asia.
Indeed, while the EC is the most important import market in all commodity groups for the ACPs and
the Mediterranean LDCs, it is also the most important importer in four out of the seven commodities
categories for LA20 and Class 2 Asia.
C4. EC Import Specialisation bv Regions
The specialisation indicator illustrates the degree to which a certain importer specialises in importing
a particular product from the source under examination. This indicator was calculated for the EC
(Table 1.13) USA (TAble 1.14) Japanese (Table 1.15) and other DCs (Table 1.16) imports of all
commodities and the seven generic economic categories defined, for a number of regional sources.
While the EC specialises in the import of all economic categories from Class 2, it counter-specialises
in their import from Class 1 and only specialises (in fact even more than in the case of Class 2) in
the import of semi-processed industrial raw materials from Class 3.
The EC specialises in importing commodities from Class 2 more than the USA but considerably less
than the rest of the DCs. Japan in fact counter-specialises in the import of commodities from Class 2
while it specialises in imports of commodities from Class 1, which is the opposite from the case of the
EC, the USA and the other DCs.
All DCs, to various degrees, specialise in the imports of commodities from the ACPs, Latin America
and the ASEAN. In addition, Japan specialises in the imports of commodities in Mashrek, while the
rest of the DCs in all Mediterranean regions.
All DCs specialise in the imports of primary commodities for food and beverages industry from the
ACPs and Latin America. The degree of specialisation is much greater in the case of the "rest of the
DCs". Moreover the EC and the "other DCs" also specialise in the import of primary commodities for
food and beverages industry from ASEAN.
All DCs specialise in the imports of semi-processed commodities for food and beverages industry
from the ACPs and the ASEAN. While the EC and the other DCs also specialise in the imports of
commodities in CACM and the USA in all Latin American regions, Japan and the other DCs seem to
have an emphasis in the import of semi-processed commodities for food and beverages industry in
the cases of Latin American LDCs outside ALADI and the CACM.
The EC has an emphasis in the import of food and beverages for household consumption in the cases
of the ACPs, Latin America, ASEAN and the Mediterranean partners outside Maghreb and
Mashrek. The USA has such a specialisation only in the case of Latin America and the ASEAN, while
Japan only in the case of ASEAN.
The EC specialises in the import of mining primary industrial raw materials in the cases of the
ACPs, Maghreb and ALADI. The pattern of USA specialisation is similar except for Maghreb. Japan
only shows a specialisation in imports of mining primary industrial raw materials in the case of
ASEAN. Lastly, the rest of the DCs specialise in all cases except CACM and Class 2 Asia.
AU DCs specialise in the imports of mining semi-processed industrial raw materials in the cases of
the ACPs and ALADI. It is interesting to note however, that while Japan shows no trade in this
economic category with the Carribean and Pacific Lomé members, the DCs other than the EC, USA
and Japan reveal an extraordinary degree of specialisation there.
All DCs specialise in the import of agricultural semi-processed industrial raw materials from
ASEAN. TTlie EC and the USA and other DCs also specialise in the case of ALADI, while Japan
specialises in the case of CACM.
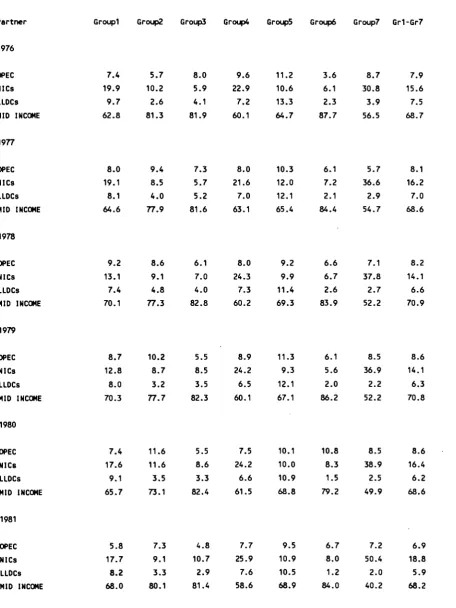
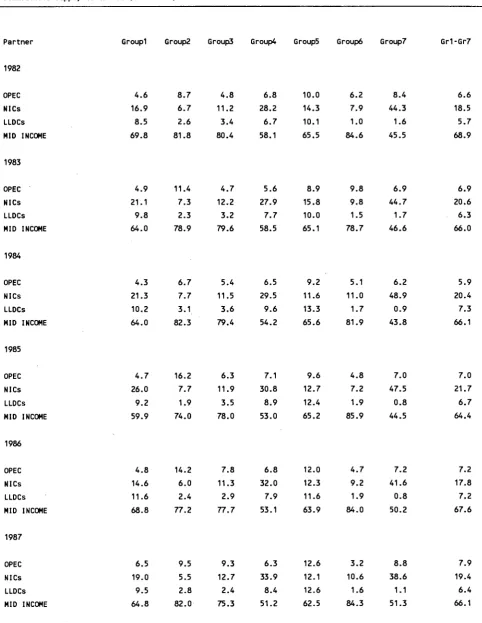
C5. EC Commodity Sourcing from different Class 2 Income Groups
The regional pattern of the EC commodity sourcing from the Third World may also be examined in
terms of the level and source of income of the supplying LDCs. In Table 1.17 the percentage share
the EC imports in each of the seven commodities categories and their total, by the OPEC, the NICs,
the LLDCs and the middle income LDCs is presented.
Some two thirds of the ECs total commodity imports come from the middle income LDCs. In 1987
the NICs provided a fifth of the total which is an increase from their 1976 15.6% share. The OPEC
and the LLDCs are at the same level providing 7.9% and 6.4% respectively in 1987.
The middle income LDCs were most important suppliers in semi-processed commodities for food
and beverages industry and mining semi-processed industrial raw materials at over 80% of the total
and weaker in mining primary industrial raw materials and mining semi-processed industrial raw
materials at 51 % of the total EC imports in 1987.
The NICs are stronger in mining primary industrial raw materials and mining semi-processed
industrial raw materials where in 1987 supplied 34% and 38.6% of the total respectively. On the
other hand they are relatively weak suppliers of semi-processed commodities for food and beverages
industry where they commanded a mere 5.5% share in 1987.
Table 1.1: Industrialised Countries Commodity Imports: X shares by developing regions origin (1987)
Partner Total SITC Group! Group2 Group3 Group4 Group5 Groupo Group7 Gr1-Gr7
CLASS 2=100X EC
USA Japan Other DCs
ACP=100X EC USA Japan Other DCs
MED.ACCORDS=100X EC
USA Japan Other DCs
LA20=100X EC USA Japan Other DCs
CL2 ASIA=100X EC
USA Japan Other DCs
33.6 39.9 17.8 8.5
56.0 32.2 4.9 6.7
67.0 21.9 4.1 6.8
27.8 57.0 7.4 7.6
27.9 38.0 24.9 9.0
57.9 22.6 7.5 11.8
74.6 12.8 4.5 8.0
86.0 3.3 0.0 10.5
47.4 30.3 7.2 14.9
65.3 10.8 16.4 7.2
60.3 23.9 8.1 7.5
88.8 5.3 0.8 4.9
91.4 0.0 2.5 5.9
27.4 48.9 11.1 12.4
43.0 29.5 17.1 10.1
44.8 34.6 7.3 13.1
82.5 11.7 0.6 5.0
75.6 2.0 0.8 21.4
34.3 49.5 1.4 14.7
43.8 23.1 20.6 12.3
46.8 7.7 38.0 7.4
61.4 17.8 14.9 5.6
74.0 0.4 7.7 17.7
52.6 6.8 33.9 6.4
13.3 1.6 79.3 5.6
43.6 12.1 35.9 8.2
73.9 5.8 12.8 7.3
61.1 1.8 20.0 16.9
62.1 14.1 12.2 11.4
27.8 14.5 50.0 7.4
39.6 25.4 27.6 7.3
54.8 17.8 15.6 11.6
86.3 6.0 1.1 6.4
33.7 34.4 25.6 6.0
19.2 15.1 62.6 3.0
81.2 4.3 11.2 3.2
93.1 2.6 0.0 4.1
77.8 0.0 0.0 22.1
90.4 5.8 1.8 1.8
68.4 2.9 23.9 4.6
51.2 20.2 19.1 9.4
71.5 12.2 8.4 7.6
73.9 1.8 5.9 18.1
46.8 29.6 12.4 11.0
Table 1.2: Percentage share of EC commodity imports from Extra EUR 12 (1976-1987) Year 1976 1977 1978 1979 1980 1981 1982 1983 1984 1985 1986 1987 Total Site 100.0 100.0 100.0 100.0 100.0 100.0 100.0 100.0 100.0 100.0 100.0 100.0 Groupl 6.9 9.9 9.1 7.4 5.4 4.6 5.2 5.9 6.9 7.2 9.3 7.1 Group2 1.7 2.0 2.1 2.0 1.4 1.2 1.2 1.4 1.8 1.6 1.7 1.5
Group3 Group4 Group5 Groupo Group7
2.1 2.6 2.6 2.2 1.8 1.8 2.1 2.3 2.6 2.8 3.5 3.5 3.3 2.9 2.7 2.6 2.5 2.6 2.5 2.8 2.9 3.1 3.4 2.8 4.4 4.6 4.2 3.8 2.9 2.5 2.5 3.3 3.4 3.4 3.4 3.2 3.2 3.0 2.8 3.1 3.1 2.3 2.3 2.7 2.6 2.7 2.9 2.5 1.9 2.2 2.1 2.2 1.7 1.8 1.9 2.5 2.4 2.3 2.8 2.7 Gr1-Gr7 23.8 27.5 25.9 23.6 19.3 17.1 18.0 21.2 22.9 23.3 27.4 23.5
Table 1.3: Percentage Share of USA commodity imports from the world (1976-1987)
Year 1976 1977 1978 1979 1980 1981 1982 1983 1984 1985 1986 1987 Total Site 100.0 100.0 100.0 100.0 100.0 100.0 100.0 100.0 100.0 100.0 100.0 100.0 Groupl 6.1 6.8 6.4 5.0 3.9 2.9 3.3 3.0 2.9 3.2 3.9 2.3 Group2 1.3 1.3 0.7 0.9 0.6 0.5 0.5 0.5 0.7 0.7 0.6 0.5
Group3 Group4 Group5 Groupo Group7
Table 1.4: Percentage Share of Japanese Commodity Imports from the world (1976-1987)
YEAR Total SITC Groupl Group2 Group3 Group4 Group5 Groupo Group7 Gr1-Gr7
1976 1977 1978 1979 1980 1981 1982 1983 1984 1985 1986 1987
100.0 100.0 100.0 100.0 100.0 100.0 100.0 100.0 100.0 100.0 100.0 100.0
2.0 3.0 2.0 1.9 1.1 0.9 1.1 1.6 1.7 1.7 2.6 1.7
1.5 1.0 0.7 0.8 0.7 0.5 0.5 0.5 0.5 0.4 0.4 0.4
0.7 0.8 0.8 0.6 0.4 0.5 0.5 0.6 0.6 0.8 1.2 1.1
6.1 5.7 5.2 5.1 4.8 4.3 4.4 4.5 4.1 4.2 4.9 4.3
5.3 5.0 6.7 7.5 5.1 3.8 3.9 3.8 3.8 3.4 4.2 4.9
1.8 1.9 2.6 2.8 2.4 2.2 2.4 2.8 3.1 2.7 2.8 3.3
0.3 0.3 0.3 0.4 0.3 0.1 0.2 0.3 0.2 0.3 0.4 0.7
18.0 18.0 18.6 19.4 15.2 12.4 13.3 14.3 14.4 13.8 16.8 16.6
Table 1.5: Percentage Share of Other DCs Commodity Imports from the world (1976-1987)
YEAR Total SITC Groupl Group2 Group3 Group4 Group5 Groupo Group7 Gr1-Gr7
1976 1977 1978 1979 1980 1981 1982 1983 1984 1985 1986 1987
100.0 100.0 100.0 100.0 100.0 100.0 100.0 100.0 100.0 100.0 100.0 100.0
7.9 10.9 9.9 8.2 5.8 4.6 5.0 5.6 5.8 5.9 9.1 5.7
0.8 1.1 1.0 1.1 0.8 0.5 0.6 0.8 0.7 0.9 0.8 0.7
3.3 3.9 4.0 . 3.6 2.6 2.6 2.9 3.2 3.3 3.6 4.1 4.0
2.5 2.4 2.6 2.5 2.7 2.4 2.3 2.7 2.0 2.0 2.0 1.7
2.6 2.8 3.0 2.8 2.0 2.0 1.8 2.2 2.2 2.1 2.4 2.3
2.7 2.1 2.4 2.2 2.6 2.0 2.1 2.3 2.1 2.2 1.9 1.8
0.8 0.8 0.6 0.6 0.5 0.4 0.4 0.4 0.4 0.4 0.4 0.4
[image:23.595.49.502.423.630.2]Table 1.6: EC, USA and Japan External Dependency (Imports as a percentage of Apparent Consumption); in parenthesis dependency on Class 2
ITEMS YEARS EC USA Japan
Agriculture
Coa I,Pet roleum,Nat.gas
Other mining, quarrying
Primary Products
Food,Beverages,Tobacco
Ferrous,non-ferrous metals
Total Industries
1980-1 1982-3 1984-5
1980-1 1982-3 1984-5
g 1980-1 1982-3
1984-5
1980-1 1982-3 1984-5
1980-1 1982-3 1984-5
tals 1980-1 1982-3 1984-5
1980-1 1982-3 1984-5
Handbook of International
20.22(9.82) 18.32(8.69) 20.07(10.65)
63.49(52.03) 61.06(45.82) 56.81(37.65)
92.99(25.62) 76.58(27.45) 86.09(28.49)
44.22(30.11) 40.74(26.71) 39.64(23.52)
4.91(2.19) 4.85(2.22) 4.66(2.26)
9.91(2.56) 7.92(1.99) 8.10(1.99)
17.31(7.57) 16.97(7.07) 17.33(6.44)
7.95(6.62) 7.43(6.08) 7.95(6.32)
37.84(35.43) 31.83(27.02) 24.07(19.92)
56.46(25.10) 63.60(28.91) 68.25(27.67)
25.11(22.33) 20.93(17.06) 16.97(13.18)
3.32(1.32) 2.89(1.04) 3.10(1.21)
5.01(1.35) 5.91(1.26) 6.06(1.74)
9.14(5.11) 8.73(4.31) 9.98(4.52)
Trade and Development Statistics 1987
31.17(11.73) 30.06(11.08) 29.81(10.70)
97.20(86.26) 97.09(82.73) 96.75(81.82)
92.12(45.24) 92.01(44.27) 91.61(42.94)
65.64(46.37) 65.06(42.36) 61.51(30.16)
4.48(1.23) 3.92(0.95) 3.53(0.94)
4.48(1.77) 4.31(1.92) 4.78(2.12)
13.07(7.90) 12.84(7.47) 11.59(6.36)
Supplement, Nei Notes: Classification used in the table (Rev.2):
Agriculture: 001, 031, 041, 042, 043, 044, 045, 051, 054, 071, (072-072.3), 074, 075, 121, 21, 22, (23-231.2), 241, 242, 244, 261, 262, 263, 264, 265, 29, 41
Coal, crude petroleum, natural gas: 321, 331, 341 Other mining and quarrying: 27, 281, 283, 285, 286, 667
Food, beverages and tobacco: 01, 02, 032, 046, 047, 048, 052, 053, 055, 06, 072.3, 073, 08, 09, 11, 122 ferrous and non-ferrous metals: 282, 284, 67, 68
Table 1.7: Percentage share of each product group of EC imported commodities (1976-1987)
Year Groupl Group2 Group3 Group4 Group5 Groupo Group7 Gr1-Gr7
1976
1977
1978 1979 1980 1981 1982 1983
1984 1985
1986 1987
28.9
36.0 35.3
31.4
28.2
26.9
29.0
28.0
30.5
31.2
34.2
30.1
7.5 7.3 8.2 8.6 7.7 7.4 7.1 6.8 7.8 7.0 6.2 6.6
8.9 9.7 10.3
9.6 9.7
10.6
11.7 11.1 11.5
12.1 12.9 15.1
14.1 10.8
10.6
11.0 13.2 15.2 14.2
13.3
12.9 13.4 12.4 12.0
18.8
16.9 16.3
16.4
15.4 15.0 14.2
15.6
15.1 14.6 12.7 13.6
13.5 11.1
10.8 13.3 16.4 13.6 12.8
12.9
11.4 11.5 10.8 10.7
8.0 8.0 8.1 9.4 9.0
10.9 10.6 12.0 10.5
9.9
10.5 11.4
Table 1.8 : EC, USA and Japan level of external dependency for selected commodities (1978)
Commodity
External Dependency (imports as X of consumption) EC USA Japan
Aluminium Oil Copper Iron Ores Phosphates Tin Zinc Lead Manganese Nickel Antimony Cadmium Cobalt Tungsten Chromium N ibi urn Geranium Mercury Molybdenum Platinum Selenium Tantalum Titanium Vanadium Zirconium Uranium Phosphates Potassium Sulphur Asbestos
61(b) 88.5 81 79 99 87 <68 53 100 100(a) 95(a) 36 100(a) >99 100 100 100 33 100 100 100 100 100 99 100 59(c) 99 20 >43 100
85(b)
-2975 64 4 99 71
98 54 91 100 35 73
-80 42(a) 9536
-83100(b)
90 94
97 80 76 90 100
100
100
100
Source: Hager and Noekle (1980) Community-Third World: The Challenge of Interdependence EC Commission, Brussels. The source used by Hager and Noekle (1980) was CCE Perspectives d' evolution structurelles d'ici 1980 doc. de travail, 16 Février 1979.
Notes: The figures represent the 1974-1976 average for the EC, 1974 for the USA and 1972 for Japan. Consumption includes second fusion products.
(a)excluding waste material.
(b)including imported bauxite, alumina and metal. The US figures come from "Mineral development of the eighties- prospects and problems- BNAC 1976". The figures for Japan are taken from the report of the US Council on International Economic Policy "Critical Imported Materials", December 1974.
Table 1.9: Percentage Share of the EC Imports of each group of commodities by origin (1976 and 1987)
Partner Total SITC Groupl Group2 Group3 Group4 Group5 Groupo Group7 Gr1-Gr7
Table 1.10: Percentage Share of USA Imports of each product group of commodities by origin (1976 and 1987)
Partner Total SITC Groupl Group2 Group3 Group4 Group5 Groupo Group7 Gr1-Gr7
Table 1.11: Percentage Share of Japanese Imports of each product group of commodities by origin (1976 and 1987)
Partner Total SITC Groupl Group2 Group3 Group4 Group5 Groupé Group7 Gr1-Gr7
Table 1.12: Percentage Share of Other DCs Imports of each product group of commodities by origin (1976 and 1987)
Partner Total SITC Groupl Group2 Group3 Group4 Group5 Groupo Group7 Gr1-Gr7
Table 1.13: Specialisation of the EC Imports of each product group of commodities in 1987 from:
Partner Groupl Group2 Group3 Group4 Group5 Groupo Group7 Gr1-Gr7
CLASS 1 CLASS 2 CLASS 3 ACP ACP AFRICA ACP CAR&PAC MED.ACCORDS MAGHREB MASHREK LA20 ALADI CACM CL2 ASIA ASEAN SE ASIA U ASIA 0.44 2.22 0.43 5.71 5.84 4.38 0.07 0.02 0.04 5.82 5.45 15.95 0.66 3.27 0.10 0.04 0.16 2.61 0.75 9.81 7.07 38.69 0.21 0.11 0.59 1.32 1.17 1.42 1.47 7.16 0.43 0.03 0.49 2.13 0.45 2.76 2.17 8.94 2.85 1.24 0.08 4.81 3.69 20.34 1.25 1.61 0.90 0.38 0.84 1.37 0.35 2.92 2.65 5.69 1.47 1.83 0.53 3.84 4.13 0.53 0.18 0.13 0.12 0.05 0.85 1.29 1.01 3.43 3.73 0.21 0.57 0.01 2.15 1.44 1.42 0.83 0.96 2.90 0.84 0.28 0.93 1.08 1.18 3.11 2.93 5.03 0.39 0.25 1.19 2.63 2.79 0.04 0.16 0.59 0.06 0.08 0.85 1.19 1.41 0.83 0.90 0.14 0.01 0.00 0.02 3.56 3.86 0.52 0.83 4.26 0.14 0.00 0.70 1.61 0.80 3.59 3.43 5.23 0.72 0.45 0.68 3.64 3.53 6.19 0.69 2.46 0.33 0.12
Table 1.14: USA Specialisation of each product group of commodities imported in 1987 from
Partner Groupl Group2 Group3 Group4 Group5 Groupo Group7 Gr1-Gr7
CLASS 1 CLASS 2 CLASS 3 ACP ACP AFRICA ACP CAR&PAC MED.ACCORDS MAGHREB MASHREK LA20 ALADI CACM CL2 ASIA ASEAN SE ASIA U ASIA 0.67 1.92 0.13 4.52 5.38 1.05 0.02 0.02 0.11 4.79 3.59 5.54 0.21 0.87 0.09 0.01 0.08 2.60 0.51 3.09 3.50 1.45 0.00 0.00 0.00 3.43 3.32 3.64 2.21 10.80 0.06 0.00 0.15 2.44 0.75 1.20 1.25 1.01 0.42 0.10 0.48 5.96 4.72 28.78 0.86 2.42 0.86 0.05 1.16 1.11 1.88 8.60 5.52 20.99 0.16 0.27 0.00 1.42 1.49 0.52 0.09 0.11 0.13 0.10 0.84 1.48 1.08 2.31 2.87 0.05 0.26 0.01 2.31 0.78 0.74 1.33 1.80 8.39 0.21 0.05 1.39 0.74 1.54 2.23 2.38 1.63 0.11 0.03 0.20 1.65 1.76 0.00 0.11 0.25 0.04 0.39 1.43 1.10 0.02 0.85 0.64 1.66 0.00 0.00 0.00 2.32 2.40 2.75 0.54 2.41 0.11 0.00 0.88 1.51 0.97 3.02 3.14 2.55 0.16 0.06 0.41 3.16 2.69 11.63 0.53 2.04 0.23 0.16
Table 1.15: Japan Specialisation of each product group of commodities imported in 1987 from
Partner Groupl Group2 Group3 Group4 Group5 Groupo Group7 Gr1-Gr7
CLASS 1 CLASS 2 CLASS 3 ACP ACP AFRICA ACP CAR&PAC MED.ACCORDS MAGHREB MASHREK LA20 ALADI CACM CL2 ASIA ASEAN SE ASIA W ASIA 1.96 0.54 0.72 3.84 5.08 1.49 0.00 0.00 0.00 3.28 2.79 9.56 0.18 0.26 0.43 0.00 1.03 1.04 1.47 1.58 1.08 2.57 0.14 0.00 0.47 3.18 1.14 0.00 1.03 2.93 0.21 0.00 1.30 0.90 1.51 0.35 0.50 0.07 0.68 0.39 0.00 1.04 1.04 0.41 0.91 1.73 0.45 0.04 1.44 1.02 0.13 3.91 0.92 9.52 1.22 2.11 2.20 4.53 4.82 0.03 0.57 0.94 1.01 0.08 1.54 0.74 1.39 2.50 1.99 3.44 1.13 0.01 4.57 0.39 0.33 2.90 0.72 1.97 0.23 0.00 1.23 0.75 2.21 5.31 8.12 0.00 0.04 0.00 0.03 3.97 4.17 0.00 0.30 0.59 0.16 0.17 1.80 0.71 0.58 0.01 0.00 0.02 0.00 0.00 0.00 0.62 0.62 1.36 0.74 1.71 0.25 0.00 1.51 0.78 1.17 3.31 3.33 3.27 0.65 0.45 1.90 2.50 2.47 4.02 0.54 1.21 0.42 0.05
Table 1.16: Other DCs Specialisation of each product group of commodities in 1987 from:
Partner Groupl Group2 Group3 Group4 Group5 Groupé Group7 Gr1-Gr7
7.4 19.9 9.7 62.8
5.7 10.2 2.6 81.3
8.0 5.9 4.1 81.9
9.6 22.9 7.2 60.1
11.2 10.6 13.3 64.7
3.6 6.1 2.3 87.7
8.7 30.8 3.9 56.5
7.9 15.6 7.5 68.7
8.0 19.1 8.1 64.6
9.4 8.5 4.0 77.9
7.3 5.7 5.2 81.6
8.0 21.6 7.0 63.1
10.3 12.0 12.1 65.4
6.1 7.2 2.1 84.4
5.7 36.6 2.9 54.7
[image:33.595.46.503.154.763.2]8.1 16.2 7.0 68.6
Table 1.17: Percentage share of Class2 regions -by level of income- in different groups of commodities supply to the EC (1976-1987)
Partner Groupl Group2 Group3 Group4 Group5 Groupé Group7 Gr1-Gr7
1976
OPEC NICs LLDCs MID INCOME
1977
OPEC NICs LLDCs MID INCOME
1978
OPEC NICs LLDCs MID INCOME
1979
OPEC NICs LLDCs MID INCOME
1980
OPEC NICs LLDCs MID INCOME
1981
OPEC NICs LLDCs MID INCOME
9.2 13.1 7.4 70.1
8.6 9.1 4.8 77.3
6.1 7.0 4.0 82.8
8.0 24.3 7.3 60.2
9.2 9.9 11.4 69.3
6.6 6.7 2.6 83.9
7.1 37.8 2.7 52.2
8.2 14.1 6.6 70.9
8.7 12.8 8.0 70.3
10.2 8.7 3.2 77.7
5.5 8.5 3.5 82.3
8.9 24.2 6.5 60.1
11.3 9.3 12.1 67.1
6.1 5.6 2.0 86.2
8.5 36.9 2.2 52.2
8.6 14.1 6.3 70.8
7.4 17.6 9.1 65.7
11.6 11.6 3.5 73.1
5.5 8.6 3.3 82.4
7.5 24.2 6.6 61.5
10.1 10.0 10.9 68.8
10.8 8.3 1.5 79.2
8.5 38.9 2.5 49.9
8.6 16.4 6.2 68.6
5.8 17.7 8.2 68.0
7.3 9.1 3.3 80.1
4.8 10.7 2.9 81.4
7.7 25.9 7.6 58.6
9.5 10.9 10.5 68.9
6.7 8.0 1.2 84.0
7.2 50.4 2.0 40.2
Table 1.17 (continued) : Percentage share of Class2 regions -by level of income- in different groups of commodities supply to the EC (1976-1987)
Partner Groupl Group2 Group3 Group4 Group5 Groupé Group7 Gr1-Gr7
1982
OPEC NICs LLDCs MID INCOME
4.6 16.9 8.5 69.8
8.7 6.7 2.6 81.8
4.8 11.2 3.4 80.4
6.8 28.2 6.7 58.1
10.0 14.3 10.1 65.5
6.2 7.9 1.0 84.6
8.4 44.3 1.6 45.5
6.6 18.5 5.7 68.9
1983
OPEC NICs LLDCs MID INCOME
4.9 21.1 9.8 64.0
11.4 7.3 2.3 78.9
4.7 12.2 3.2 79.6
5.6 27.9 7.7 58.5
8.9 15.8 10.0 65.1
9.8 9.8 1.5 78.7
6.9 44.7 1.7 46.6
6.9 20.6 6.3 66.0
1984
OPEC NICs LLDCs MID INCOME
4.3 21.3 10.2 64.0
6.7 7.7 3.1 82.3
5.4 11.5 3.6 79.4
6.5 29.5 9.6 54.2
9.2 11.6 13.3 65.6
5.1 11.0 1.7 81.9
6.2 48.9 0.9 43.8
5.9 20.4 7.3 66.1
1985
OPEC NICs LLDCs MID INCOME
4.7 26.0 9.2 59.9
16.2 7.7 1.9 74.0
6.3 11.9 3.5 78.0
7.1 30.8 8.9 53.0
9.6 12.7 12.4 65.2
4.8 7.2 1.9 85.9
7.0 47.5 0.8 44.5
7.0 21.7 6.7 64.4
1986
OPEC NICs LLDCs MID INCOME
4.8 14.6 11.6 68.8
14.2 6.0 2.4 77.2
7.8 11.3 2.9 77.7
6.8 32.0 7.9 53.1
12.0 12.3 11.6 63.9
4.7 9.2 1.9 84.0
7.2 41.6 0.8 50.2
7.2 17.8 7.2 67.6
1987
OPEC NICs LLDCs MID INCOME
6.5 19.0 9.5 64.8
9.5 5.5 2.8 82.0
9.3 12.7 2.4 75.3
6.3 33.9 8.4 51.2
12.6 12.1 12.6 62.5
3.2 10.6 1.6 84.3
8.8 38.6 1.1 51.3
[image:34.595.70.553.138.762.2]Table 1.18: Unit value and Volume Indices of EC Imports of Food, Beverages and Tobacco, Crude Inedible Materials, Animal and Vegetable Oils (SITC 0+1+2+4) 1979-1988
YEAR Extra EUR12 Class 2 ACP LA20 Far East LLDC Med
Unit Value Indices 1979
1980 1981 1982 1983 1984 1985 1986 1987 1988
Volume Indices 1979
1980 1981 1982 1983 1984 1985 1986 1987 1988
Note: 1980=100.0
Source: EUROSTAT, C3, Trend Database. Luxembourg. 91.0
100.0 113.5 117.8 125.0 144.5 142.0 121.2 110.7 118.3
92.9 100.0 108.2 113.6 122.9 143.9 140.4 120.1 103.6 108.2
96.4 100.0 102.9 109.6 118.6 143.3 145.4 123.6 102.8 100.2
91.7 100.0 112.3 119.0 127.3 145.3 137.2 121.4 100.6 109.9
92.3 100.0 106.6 108.1 122.3 147.6 136.3 109.9 102.7 106.6
95.1 100.0 108.0 116.0 124.9 152.3 153.0 130.7 103.6 101.4
87.6 100.0 113.6 115.4 119.7 132.7 143.2 122.5 115.6 119.1
101.5 100.0 94.6 95.0 95.0 96.1 99.2 98.4 102.9 104.5
103.9 100.0 97.7 99.8 100.3 105.5 112.6 110.0 113.5 117.6
102.7 100.0 96.0 98.5 97.4 103.1 103.9 109.6 111.4 112.4
104.4 100.0 98.6 101.3 105.1 113.1 128.6 115.1 120.3 129.2
102.7 100.0 96.2 100.3 94.9 92.0 102.5 105.5 112.5 114.8
113.1 100.0 93.2 92.8 103.0 116.0 112.5 118.0 118.6 118.1
PART TWO: ANALYSIS BY INDIVIDUAL COMMODITIES
Table 2.1 presents a ranking of the thirty most important individual commodities imported by the EC
in 1987 from Class 2. In Table 2.2 these thirty products are ranked according to the increase of their
values in the 1976-1987 period. These products are examined here individually under their
corresponding generic category.
These thirty products accounted for 85.8% of the EC imports from Class 2 in 1987. Each category
however, is represented by a very different weight. The five primary commodities for food and
beverages industry examined here account for as much as 28.6% of total EC commodities imports in
1987, the five agricultural primary industrial raw materials for 15.5%, the six food and beverages
commodities for household consumption for 12.6%, the five mining primary industrial raw materials
for 9.5%, the five mining processed industrial raw materials for 8.6%, the one agricultural
semi-processed industrial raw material for 6.9% and the three semi-semi-processed commodities for food and
beverages industry for a mere 4.1%.
A. PRIMARY COMMODITIES FOR FOOD AND BEVERAGES INDUSTRY (Group 1)
The individual primary commodities for the food and beverages industry included among the thirty
most important individual commodities imported by the EC from the Third World in 1987 were:
coffee, cocoa beans raw and roasted, fresh and dry roots and tubers, soya beans excluding flour and
fresh and frozen bovine meat.
Coffee
(0711) is the single most important individual commodity imported by the EC from Class 2
accounting for between 15% and 22% over the 1976-1987 period, of the total EC commodities
imports from there. Although the actual quantities imported did not change very much during the
1976-1987 period, a considerable volatility in prices (doubled within a year in 1977 fell back to close
its 1976 levels in 1981, doubled again by 1986 and fell to the 1981 levels in 1987) made for the ups and
downs in the actual value of coffee imported.
Cocoa beans
(0721) prices also exhibited volatility while the quantities imported did not react as
much. Indeed, their unit value almost doubled in 1977, peaked in 1978 at 216% its 1976 value,
dropped to 143% in 1983, peaked again at 223% its 1976 level and fell back at the 1983 levels by 1987.
Accordingly their share of the EC commodities imports fluctuated between about 4% (1976) and
almost 8% (1978).
The EC imported in 1987 more than twice as much
fresh and dry
roots
and
tubers (05481) as it did in
1976. Their unit value fell in 1977 and 1978, increased up to 1984 and subsequently came down to a
1987 level that is 22% more than their 1976 level. In 1987 it represented some 3.2% of total EC
commodities imports.
Both the amounts of soya beans (2214) imported by the EC and their unit values exhibited
considerable volatility. Quantities imported increased by 46% up to 1979 but collapsed to a third of
the quantities imported in 1976 by 1982. They subsequently increased to twice the 1976 level. Unit
values increased up to 1984 and fell well below (84%) their 1976 level by the end of the period. In
1987 soya beans represented some 3% of the EC commodities imports.
There were three individual semi-processed commodities for the food and beverages industry
included among the thirty most important individual commodities imported by the EC from the Third
World in 1987: raw beet and cane sugar, groundnut and peanut oil and molasses.
In 1987 the
EC
imported some 8 1 % the ammount of
raw beet and cane sugar
(0611) that they
imported in 1976 while the unit value had an increase of 42.6% and it accounted for 2.5% of total EC
commodities imports.
Up to 1985 the EC imported less
groundnut and peanut oil
(4222) than in 1976 only to import 2 1 %
more in 1987. Meantime its unit value increased up to 153% in 1984 only to fall at 82% its 1976 level
in 1987. It represents around 1% the EC commodities imports.
Molasses
(0615) represent less than 1% of the EC imports of commodities. In 1987 the quantities
imported were 50% more and its unit value 44% more than its 1976 level.
C. FOOD AND BEVERAGES FOR HOUSEHOLD CONSUMPTION (Group
3Ì
The individual food and beverages for household consumption commodities included among the
thirty most important individual commodities imported by the EC from the Third World in 1987
were: fresh bananas plantains, fresh and frozen fruits, tea, fresh fruit not elsewhere specified,
oranges, tangerines, etc. and edible fresh or dry nuts.
The quantities of
fresh bananas, plantains
(0513) that the EC imported from Class 2 remained at
similar levels throughout the 1976-1987 period, the unit values however, had doubled by 1984. In 1987
fresh bananas plantain accounted for 4.5% of total EC commodities imports from Class 2.