PREVALENCE OF THYROID DYSFUNCTION IN TYPE 2
DIABETIC AND NON DIABETIC POPULATION
Submitted in partial fulfilment of Requirements for
M.D. DEGREE BRANCH I
GENERAL MEDICINE
OF
THE TAMILNADU DR.M.G.R. MEDICAL UNIVERSITY
CHENNAI
CERTIFICATE
This is to certify that this dissertation entitled “PREVALENCE
OF THYROID DYSFUNCTION IN TYPE 2 DIABETIC AND NON
DIABETIC POPULATION” submitted by Dr. K.MANIKANDAN
appearing for M.D. Branch I - General Medicine Degree examination in
MAY-2019 is a bonafide record of work done by him under my direct
guidance and supervision in partial fulfilment of regulations of the
TamilNadu Dr. M.G.R. Medical University, Chennai. I forward this to the
TamilNadu Dr.M.G.R. Medical University, Chennai, Tamil Nadu, India.
Prof.Dr.S.USHALAKSHMI, M.D., FMMC., Prof.Dr.S.TITO, M.D
Professor of Medicine, Director I/C and Professor, Institute of Internal Medicine, Institute of Internal Medicine, MMC & RGGGH, MMC & RGGGH, Chennai- 600 003. Chennai- 600 003.
Prof.Dr.R.JAYANTHI, M.D., FRCP.,
DECLARATION
I solemnly declare that the dissertation titled “PREVALENCE OF
THYROID DYSFUNCTION IN TYPE 2 DIABETIC AND NON
DIABETIC POPULATION” is done by me at Madras Medical College
& Rajiv Gandhi Govt. General Hospital, Chennai during 2018 under the
guidance and supervision of Prof.Dr.S.USHALAKSHMI., M.D. The
dissertation is submitted to The Tamilnadu Dr.M.G.R. Medical
University towards the partial fulfilment of requirements for the award of
M.D. Degree (Branch I) in General Medicine.
DR. K.MANIKANDAN,
Place: M.D.General Medicine,
Date: Postgraduate student,
Institute of Internal Medicine
Madras Medical College
Chennai 600003
ACKNOWLEDGEMENT
I would like to thank our beloved Dean, Madras Medical College,
Prof.Dr.R.JAYANTHI, M.D., for her kind permission to use the
hospital resources for this study.
I would like to express my sincere gratitude to my beloved
Professor and Director (I/C), Institute of Internal Medicine
Prof.Dr.S.TITO, M.D., for his guidance and encouragement.
With extreme gratitude, I express my indebtedness to my beloved
Chief and teacher Prof.Dr.S.USHALAKSHMI,M.D., for his motivation,
advice and valuable criticism, which enabled me to complete this work.
I am extremely thankful to Assistant Professors of Medicine
Dr.M.SHARMILA, M.D., and Dr.S.APARNA, M.D., for their
co-operation and guidance. I thank all Professors, Assistant Professors,
and Post- graduates of Institute of biochemistry, diabetology, medical
endocrinology for their valuable support in the analysis.
I am immensely grateful to the generosity shown by the patients
who participated in this study.
ABBREVIATIONS
T3
TRIIODOTHYRONINE
T4
THYROXINE
TSH
THYROID STIMULATING HORMONE
FBS
FASTING BLOOD GLUCOSE
PPBS POST PRANDIAL BLOOD GLUCOSE
DM
DIABETES MELLITUS
MODY
MATURITY-ONSET DIABETES OF THE YOUNG
IFG
IMPAIRED FASTING GLUCOSE
IGT
IMPAIRED GLUCOSE TOLERANCE
BMI
BODY MASS INDEX
GDM
GESTATIONAL DIABETES MELLITUS
CONTENTS
SERIAL
No.
TITLE
PAGE
NO.
1.
INTRODUCTION
1
2.
AIMS AND OBJECTIVES
3
3.
REVIEW OF LITERATURE
4
4.
MATERIALS AND METHODS
27
5.
OBSERVATION AND RESULTS
31
6.
DISCUSSION
77
7.
CONCLUSION
82
8.
LIMITATIONS OF STUDY
83
9.
BIBLIOGRAPHY
84
10.
ANNEXURE
PROFORMA
96
MASTER CHART
INSTITUTIONAL ETHICS COMMITTEE
APPROVAL CERTIFICATE
99
PLAGIARISM SCREENSHOT
PLAGIARISM CERTIFICATE
INFORMATION SHEET
CONSENT FORM
1
INTRODUCTION
Diabetes mellitus is a common endocrine disorder which involves multiple organ systems and leads to significant morbidity and mortality due to its accompanying complications.
The metabolic dysregulation associated with Diabetes mellitus causes secondary pathophysiologic changes in multiple organ systems that impose a tremendous burden on the individual with diabetes and on the health care system.2
Diabetes mellitus has been defined as "A metabolic syndrome characterised by chronic hyperglycaemia and disturbance of carbohydrate, fat and protein metabolism associated with absolute or relative deficiency in insulin secretion and or insulin action".
Much has been accomplished in the field of diabetes but what has been troubling one and all are the large macrovascular and micro vascular complications of diabetes involving kidneys, eyes, blood vessels, nerves and heart. Thyroid diseases are also a common endocrinopathy seen in the adult population.
The present work is a modest attempt to study the prevalence of thyroid disorders in patients with type2 Diabetes mellitus.
2
Diabetes mellitus is classified on the basis of the pathogenic process that leads to hyperglycemia, as opposed to earlier criteria such as age of onset or type of therapy. There are two broad categories of DM,designated as type 1 and type 2. There is also increasing recognition of other forms of diabetes in which the pathogenesis is better understood.
Type 1 DM is the result of complete or near-total insulin Deficiency and Type 2 DM is a heterogeneous group of disorders characterized by variable degrees of insulin resistance, impaired insulin secretion, and increased glucose production.
3
AIM OF THE STUDY
1. To study the prevalence of thyroid disorders in patients with type 2 diabetes mellitus and non diabetic population.
2. To study the distribution of thyroid disorders in patients with type 2 diabetes mellitus regarding age, sex, duration of diabetes, type of treatment, family history of diabetes mellitus.
4
REVIEW OF LITERATURE
Diabetes mellitus is characterised by chronic hyperglycemia with disturbances of carbohydrate, fat, and protein metabolism due to defects in insulin secretion, insulin action, or both1. The metabolic dysregulation
associated with Diabetes mellitus causes many secondary pathophysiologic changes in multiple organ systems that impose a tremendous burden on the individual with diabetes and on the health care system.2
PROBLEM STATEMENT
A recent study by the World Health Organization (WHO) estimated that the worldwide prevalence of diabetes in 2002 was 170 million, with the number predicted to grow upto 366 million or more by 2030. The major underlying causes are thought to be due to sedentary lifestyle, the consumption of non-traditional foods, and a genetic predisposition to the disease. India has the largest number of people suffering from diabetes mellitus.
United Nations in 2006 stated that “diabetes is a chronic, debilitating and costly disease associated with severe complications, which poses severe risks for families, Member States and the entire world.7
HISTORY
Diabetes is as old as medicine. Early evidence of description of symptoms of diabetes recorded in the Ebers papyrus, 1550 B.C.8 Arateus
5
“liquefaction of the flesh and bones into urine”. In Greek this word means 'to run through' that describes 'unquenchable thirst' seen in association with this disease. Shushruta (Circa 600AD) noted this disease in Ayurveda and described it as "Madhumeha". 10
In 1869, Paul Langerhans, published in his dissertation on pancreatic histology described “clumps of cells,” which were named the islets of Langerhans shortly after his death.11,12 In 1889, Minkowski and Von Mering,
in Strassburg, Germany, discovered the central role of the pancreas in diabetes.13 In 1910, Jean de Meyer suggested that the pancreatic secretion
lacking in diabetic state to be called as “Insulin” to denote its origin from insulae of Langerhans.14 Banting and Charles Best in 1921, extracted insulin
from dog's pancreas.15
The first chemical application of insulin was on 14 year old Leon and Thompson, a patient of diabetic ketoacidosis in January 1922 in Canada. This discovery revolutionized the management of diabetes. Oral hypoglycaemic drugs were introduced by Frank and Fuchs in 1955.8
DESCRIPTION OF DIABETES MELLITUS
When fully expressed, diabetes is characterized by fasting hyperglycemia, but the disease can also be recognized during less overt stages, mostly by the presence of glucose intolerance.
6
sufficient to cause pathologic functional changes may quite often be present for a long time before the diagnosis is made.1
Patients may revert to having impaired glucose regulation or even normal glycemia, particularly in recent-onset type 2 diabetes.16
In type 1 diabetes, after a short period of insulin treatment, there may be a variable period when insulin is no longer required for survival and glucose tolerance may improve, the so-called honeymoon period. Eventually such patients do need insulin treatment for survival.17
ETIOLOGIC CLASSIFICATION OF DIABETES MELLITUS
I.Type 1 diabetes (beta cell destruction, usually leading to absolute insulin deficiency)
A. Immune-mediated B. Idiopathic
II. Type 2 diabetes (may range from predominantly insulin resistance with relative insulin deficiency to a predominantly insulin secretory defect with insulin resistance)
III. Other specific types of diabetes
7
1. Hepatocyte nuclear transcription factor (HNF) 4α (MODY 1) 2. Glucokinase (MODY 2)
3. HNF-1α (MODY 3)
4. Insulin promoter factor-1 (IPF-1; MODY 4) 5. HNF-1β (MODY 5)
6. NeuroD1 (MODY 6) 7. Mitochondrial DNA
8. Subunits of ATP-sensitive potassium channel 9. Proinsulin or insulin
10. Other pancreatic islet regulators/proteins such as KLF11, PAX4, BLK, GATA4, GATA6, SLC2A2 (GLUT2), RFX6, GLIS3
B. Genetic defects in insulin action 1. Type A insulin resistance 2. Leprechaunism
8
C. Diseases of the exocrine pancreas—pancreatitis, pancreatectomy, neoplasia, cystic fibrosis, hemochromatosis, fibrocalculous pancreatopathy, mutations in carboxyl ester lipase
D. Endocrinopathies—acromegaly, Cushing’s syndrome, glucagonoma, pheochromocytoma, hyperthyroidism, somatostatinoma,
aldosteronoma.
E. Drug- or chemical-induced—glucocorticoids, vacor (a rodenticide), pentamidine, nicotinic acid, diazoxide, β-adrenergic agonists, thiazides, calcineurin and mTOR inhibitors, hydantoins, asparaginase, α-interferon, protease inhibitors, antipsychotics (atypicals and others), epinephrine.
F. Infections—congenital rubella, cytomegalovirus, coxsackievirus. G. Uncommon forms of immune-mediated diabetes—“stiff-personsyndrome, anti-insulin receptor antibodies
H. Other genetic syndromes sometimes associated with diabetes- Wolfram’s syndrome, Down’s syndrome, Klinefelter’s syndrome, Turner’s syndrome, Friedreich’s ataxia, Huntington’s chorea, Laurence-Moon- Biedl syndrome, myotonic dystrophy, porphyria, Prader-Willi syndrome.
9
The majority of cases of diabetes fall into two broad etiopathogenetic categories, now called type 1 and type 2 diabetes.
TYPE 1 DIABETES MELLITUS
Type 1 diabetes is the form of the disease due primarily to β-cell destruction in which insulin is required for survival. It is characterized by the presence of anti-GAD, anti-islet cell, or antiinsulin antibodies, which reflects the autoimmune processes that have led to β-cell destruction.
TYPE 2 DIABETES MELLITUS
Type 2 diabetes is the most common form of diabetes. Insulin resistance and abnormal insulin secretion are central to the development of type 2 DM.2
Patients with type 2 diabetes usually have insulin resistance and relative, rather than absolute, insulin deficiency and are associated with progressive β-cell failure with increasing duration of diabetes.20 The risk of developing type 2 diabetes increases with age, obesity, physical inactivity and family history of diabetes.1 The disease can occur at any age and is now seen in children and
adolescents.21
Diagnostic criteria for the diagnosis of diabetes mellitus
•Symptoms of diabetes plus random blood glucose concentration ≥11.1 mmol/L (200 mg/dL) or
• Fasting plasma glucose ≥7.0 mmol/L (126 mg/dL) or
10
• 2-hr plasma glucose ≥11.1 mmol/L (200 mg/dL) during an oral glucose tolerance test.
Random - defined as without regard to time since the last meal. Fasting - defined as no caloric intake for at least 8 h.
Hemoglobin A1c test - should be performed in a laboratory using a method approved by the National Glycohemoglobin Standardization Program and correlated to the reference assay of the Diabetes Control and Complications Trial. hemoglobin A1c should not be used for diagnostic purposes.
OGTT - The test should be performed using a glucose load containing the equivalent of 75 g anhydrous glucose dissolved in water, not recommended for routine clinical use.
Note: In the absence of unequivocal hyperglycemia and acute metabolic decompensation,these criteria should be confirmed by repeat testing on a different day.
Source: Adapted from American Diabetes Association: Diabetes Care 37(Suppl 1):S14,2014.
11
one test but not the other).OGTT, although still a valid means for diagnosing DM, is not often used in routine clinical care.
The diagnosis of DM has profound implications for an individual from both a medical and a financial standpoint. Thus, abnormalities on screening tests for diabetes should be repeated before making a definitive diagnosis of DM, unless acute metabolic derangements or a markedly elevated plasma glucose are present.
IMPAIRED GLUCOSE TOLERANCE 1
Defined as 2 hours values in the oral glucose tolerance test (OGTT) between 140 and 199mg/dl (7.8 and 11.1 mmol/L). Glucose tolerance is above the conventional normal range but lower than the level diagnostic of diabetes. Persons with IGT have a high risk of developing diabetes and arterial disease. IGT is more frequent in obese persons and often is associated with hyperinsulinemia and insulin resistance.
IMPAIRED FASTING GLUCOSE 1
Defined as fasting plasma glucose concentrations of 100 to 125 mg/dL (5.6 to <7.0 mmol/L). IFG is also a stage of impaired glucose homeostasis with fasting glucose levels were above normal but below those diagnostic for diabetes.
Risk Factors for Type 2 Diabetes Mellitus
12
Obesity (BMI ≥25 kg/m2 or ethnically relevant definition for overweight)
Physical inactivity
Race/ethnicity (e.g., African American, Latino, Native American, Asian
American, Pacific Islander)
Previously identified with IFG, IGT, or an hemoglobin A1c of 5.7–6.4%
History of GDM or delivery of baby >4 kg (9 lb)
Hypertension (blood pressure ≥140/90 mmHg)
HDL cholesterol level <35 mg/dL (0.90 mmol/L) and/or a triglyceride level >250 mg/dL (2.82 mmol/L)
Polycystic ovary syndrome or acanthosis nigricans
History of cardiovascular disease.
SCREENING FOR DIABETES MELLITUS
The ADA recommends screening all individuals >45 years every 3 years and screening individuals at an earlier age if they are overweight (BMI >25 kg/m2 or ethnically relevant definition for overweight) and have one additional risk factor for diabetes.
ACUTE COMPLICATIONS OF DM2
13
with type 2 DM. Both disorders are associated with absolute or relative insulin deficiency, volume depletion, and acid-base abnormalities.
CHRONIC COMPLICATIONS OF DM 2
The vascular complications of DM are divided into microvascular (retinopathy, neuropathy, nephropathy) and macrovascular complications [coronary artery disease (CAD), peripheral arterial disease (PAD), cerebrovascular disease]. Nonvascular complications include problems such as gastroparesis, infections, and skin changes.
The microvascular complications of both type 1 and type 2 DM result from chronic hyperglycemia. Evidence implicating a causative role for chronic hyperglycemia in the development of macrovascular complications were inconclusive. Other factors (dyslipidemia and hypertension) also play important roles in macrovascular complications.
THYROID
14
The normal thyroid gland secretes sufficient amounts of the thyroid hormones triiodothyronine (T3) and tetraiodothyronine (T4, thyroxine) to normalize growth and development, body temperature, and energy levels.
Calcitonin, the second type of thyroid hormone, is important in the regulation of calcium metabolism.28
BIOSYNTHESIS OF THYROID HORMONES 27
Iodide, ingested from food, water, or medication, is rapidly absorbed from intestine and enters an extracellular fluid pool. Transport of iodide into the thyroid gland is by an intrinsic follicle cell basement membrane sodium/iodide symporter (NIS). At the apical cell membrane a second I- transport enzyme called pendrin is present. Iodide is oxidized by thyroidal peroxidase to iodine that rapidly iodinates tyrosine residues within the thyroglobulin molecule to form monoiodotyrosine (MIT) and diiodotyrosine (DIT). This process is called iodide organification.Two molecules of DIT combine within the thyroglobulin molecule to form L-thyroxine (T4). One molecule of MIT and one molecule of DIT combine to form T3. T4, T3, MIT, and DIT are released from thyroglobulin by exocytosis and proteolysis of thyroglobulin at the apical colloid border. Most of the hormone released is thyroxine. Most of the T3 circulating in the blood is derived from peripheral metabolism of T4.
15
proteins increase the pool of circulating hormone, delay hormone clearance, and may modulate hormone delivery to selected tissue sites.
DEIODINASES 27
T4 is converted to T3 by the deiodinase enzyme.
1. Type I deiodinase, which is located primarily in thyroid, liver, and kidney, has a relatively low affinity for T4.
2. Type II deiodinase has a higher affinity for T4 and is found primarily in the pituitary gland, brain, brown fat, and thyroid gland.
3. Type III deiodinase inactivates T4 and T3 and is the most important source of reverse T3 (r T3)
PHYSIOLOGICAL EFFECTS OF THYROID HORMONES 29
Heart : Increases number of β adrenergic receptors Enhances response to catecholamines Adipose tissue : Stimulate lipolysis
16
Lipoprotein : Stimulate LDL receptors
Others : Increases metabolic rate and oxygen consumption
REGULATION OF THYROID AXIS 27
The thyroid axis is a classic example of an endocrine feedback loop. TRH stimulates pituitary production of TSH, which, in turn, stimulates thyroid hormone synthesis and secretion. Thyroid hormones feed back to inhibit TRH and TSH production.
EXOGENOUS AND ENDOGENOUS FACTORS SUPPRESSING TSH
SECRETION:30
Dopamine and agonists, Somatostatin, Dobutamine, Glucocorticoids, Interleukins, TNF-α, Thyroid hormones and Phenytoin.
FACTORS ASSOCIATED WITH ALTERED BINDING OF
THYROXINE BY THYROXINE-BINDING GLOBULIN 30
Increased Binding:
Pregnancy, Oral contraceptives, Infectious hepatitis, Cirrhosis, HIV, Acute intermittent porphyria and Tamoxifen.
Decreased Binding
17
FACTORS ASSOCIATED WITH DECREASED CONVERSION OF T4
TO T3: 30
Fetal life, Caloric restriction, Hepatic disease, Major Systemic illness, Propylthiouracil, Glucocorticoids, Propranolol, Iodinated X-ray contrast agents, Amiodarone and Selenium deficiency.
HYPOTHYROIDISM
Hypothyroidism is the condition resulting from a lack of effects of thyroid hormones on body tissues.31
Symptoms
1.Tiredness 2.Weakness 3.Dry skin 4.Feeling cold 5.Hair loss
6.Difficulty concentrating and poor memory 7.Constipation
18
10.Hoarse voice
11.Menorrhagia (later oligomenorrhea or amenorrhea) 12.Paresthesia
13.Impaired hearing.
Signs
1.Dry coarse skin
2.cool peripheral extremity
3.Puffy face, hands, and feet (myxedema) 4.Diffuse alopecia
5.Bradycardia 6.Peripheral edema
7.Delayed tendon reflex relaxation 8.Carpal tunnel syndrome
9.Serous cavity effusions.27
METABOLIC ABNORMALITIES IN HYPOTHYROIDISM
19
serum glucose levels. Degradation of insulin, is slowed and the sensitivity to exogenous insulin may be increased.32 Both the synthesis and the degradation
of lipid are depressed in hypothyroidism with a net effect of accumulation of LDL and triglycerides. HDL concentrations and Plasma free fatty acid levels are decreased.33
SUBCLINICAL HYPOTHYROIDISM
Defined as a low-normal free T4 but a slightly elevated serum TSH level. The TSH elevation in such patients is modest, with values typically between 4 and 10 mU/L. Rates of progression to overt hypothyroidism ranges from 3% to 8% per year, higher rates seen in individuals with initial TSH concentration greater than 10 mU/L and those with positive anti-TPO antibodies.34 The association of mild hypothyroidism with an increase in risk for atherosclerotic heart disease has been shown by some, but not others.35,36.
HYPERTHYROIDISM 27
Hyperthyroidism is a state when thyrotoxicosis occurs because of sustained over production of hormones by thyroid gland.
Symptoms
1.Heat intolerance and sweating 2.Palpitation
20
4.Weight loss with increased appetite 5.Diarrhea
6.Polyuria
7.Oligomenorrhea 8.loss of libido.
Signs
1.Tachycardia
2.Atrial fibrillation in the elderly 3.Tremor
4.Goiter
5.Warm, moist skin 6.Muscle weakness 7.Proximal myopathy 8.Lid retraction or lag 9.Gynaecomastia.
METABOLIC ABNORMALITIES IN HYPERTHYROIDISM
21
in thyrotoxicosis, but the net effect is lipolysis, as reflected by an increase in the plasma concentration of free fatty acids and glycerol and a decrease in serum cholesterol level. Triglyceride levels are usually slightly decreased.38
SUBCLINICAL HYPERTHYROIDISM
There are no signs of thyrotoxicosis but the serum TSH is subnormal despite normal serum free T4 concentration.37 Subclinical hyperthyroidism may accelerate bone loss in postmenopausal women39 and increases the incidence of atrial arrhythmias including atrial fibrillation in elderly patients.31
DIABETES AND THYROID DISEASES
Diabetes mellitus and thyroid diseases are the two common endocrinopathies seen in the adult population. Insulin and thyroid hormones are intimately involved in cellular metabolism. Excess or deficit of either of these hormones could result in the functional derangement of the other.40
EFFECT OF DIABETES ON THYROID FUNCTION
In euthyroid individuals with diabetes mellitus, the serum T3 levels, basal TSH levels and TSH response to thyrotropin releasing hormone (TRH) may all be strongly influenced by the glycemic status.41 Poorly controlled
22
monodeiodination reaction and may normalize with improvement in glycemic status but even with good diabetes control, the normal nocturnal TSH peak may not be restored in C-peptide negative patients.43
EFFECT OF DIABETES MELLITUS ON THYROID DISEASES
Dysthyroid optic neuropathy (DON) resulting in blindness is the most threatening complication of Graves’ orbitopathy (GO). It is due to the compression of optic nerve by enlarged extraocular muscles at the orbital apex.
Incidence of DON in patients with diabetes mellitus is higher than that seen in control “GO” group and the recovery after treatment is also poor. This has been explained by reduced oxygenation of optic nerve in diabetic patient owing to the vasculopathy making it more susceptible to the pressure effect.44
EFFECT OF HYPERTHYROIDISM ON GLYCEMIC STATUS
Graves disease is the commonest cause of hyperthyroidism. While Graves disease may be associated with type 1 diabetes in polyglandular autoimmune syndrome, thyrotoxicosis by itself is diabetogenic. Frank diabetes occurs in 2-3%, when hyperthyroidism develops in normal individuals. In known diabetic patients hyperthyroidism causes deterioration of glycemic control status.42
23
1. Gastrointestinal System
In hyperthyroidism, there is accelerated gastric emptying, enhanced intestinal glucose absorption and an increase in portal venous blood flow.
2. Insulin Secretion
Insulin secretion decreases in hyperthyroidism.45,46 Insulin clearance
rate is reported to be increased by about 40%.47 Long term thyrotoxicosis has been shown to cause beta cell dysfunction resulting in poor insulin response to glucose.48
3. Endogenous Glucose Production
In hyperthyroidism the endogenous glucose production is greatly increased by a variety of mechanisms: (a) there is an increase in the availability of gluconeogenic precursors( lactate, glutamine, alanine and FFA) stimulating hepatic gluconeogenesis,49 Inhibition of glycogen synthesis,50
Upregulation of GLUT-2 glucose transporters protein expression in the Hepatocyte,51 Increased secretion and exaggerated effects of glucagon and
adrenaline on liver cells.49
4. Glucose utilization
24
increased glycogenolysis due to beta adrenergic stimulation49, increased
activity of hexokinase and 5 phosphofructokinase.53
Thus the net effect of changes occurring at various levels such as gastrointestinal tract, beta cells, hepatocytes, adipocytes and skeletal muscles is hyperglycemia.
EFFECT OF HYPOTHYROIDISM ON GLYCEMIC STATUS
In hypothyroidism, the synthesis and release of insulin is decreased.46 The rate of hepatic glucose output is decreased probably due to reduced gluconeogenesis. A post receptor defect has been proposed to explain the decrease in insulin stimulated glucose utilization in peripheral tissues.49 The net
effect is an increased risk of recurrent hypoglycemia in a diabetic individual.54
ASSOCIATION BETWEEN DIABETES MELLITUS AND THYROID
DISORDERS:
Celani MF et al in their study found that abnormal TSH values in type 2 diabetic patients found before tight glycemic control reverted to normal values with adequate treatment of diabetes with OHA or insulin. They suggested that the diagnosis of thyroid dysfunction in type 2 diabetes should be delayed until improvement of metabolic status.55
25
parameters such as age and drugs, thyroid function tests can also be altered in diabetes mellitus and obesity.56
Warren RE et al in their study found that serum thyrotropin (i.e. baseline TSH) is a better predictor of thyroid dysfunction than thyroid autoantibodies in people with diabetes.57
Vondra K et al in their study found that prevalence of thyroid disease in diabetic patients is 2-3 times higher than in non diabetic subjects. It raises with age and is strongly influenced by female gender and autoimmune diabetes. They even recommended thyroid disease screening and diagnosis in patients with diabetes mellitus.58
Abdel Rahman et al in their study found that overall prevalence of thyroid diseases was 12.5% in type 2 diabetes mellitus group. The study suggested that diabetic patients should be screened for asymptomatic thyroid dysfunction.59 Perros P et al in their study found that the prevalence of thyroid disease was 13.4% in a randomly selected group of 1310 adult diabetic patients attending a diabetic clinic. They suggested that thyroid function should be screened annually in diabetic patients to detect asymptomatic thyroid dysfunction which is increased in frequency in a diabetic population.60
26
was 10.8%. He concluded by suggesting that screening for thyroid disease should be considered in patients receiving diabetes care in community.61
Zdrojewicz Z et al in their study found that there was no difference in thyroid gland function in patients with non insulin dependent diabetes mellitus(type 2) and different therapies have no influence on thyroid gland function.62
Parr JH et al in their study found that improvement in long term metabolic control did not influence free thyroid hormone levels in well controlled and moderately-poor controlled diabetics taking insulin.63
27
MATERIALS AND METHODS
The present study titled "PREVALENCE OF THYROID DYSFUNCTION IN TYPE 2 DIABETIC AND NON DIABETIC
POPULATION " was carried out in the Department of Internal Medicine and in the Department of Diabetology, Rajiv Gandhi Government General Hospital and Madras medical college , Chennai.
1. Study design : Cross sectional study.
2. Period of study : April 2018 to September 2018
3. Materials : Questionnaire, Blood pressure, CBC,FBS, PPBS, RFT,LFT, Urinalysis, ECG,
Chest X ray, Thyroid profile (FT3, FT4 and TSH).
28
Inclusion criteria
All patients in the diabetic group confirmed by fasting blood glucose levels >126 mg/dl, post prandial blood glucose levels >200 mg/dl on more than two occasions based on the American Diabetes Association (ADA) criteria for diagnosis of Diabetes mellitus.
Age- and sex-matched healthy volunteers without a history of diabetes and with normal blood sugar were considered to be control subjects.
Exclusion criteria
1.Type 1 DM
2.Known thyroid dysfunction 3.Liver disease
4.Renal disease 5.Pregnancy 6.Hypertension
7. Patients not willing for study
29
mellitus and treatment history of oral hypoglycaemics or insulin along with duration was also included.
Statistical Analysis Plan :
Data analysed using statistical package - SPSS Software
Consent:
All participants / attenders gave written informed consent.
Ethical Committee Approval:
Institutional Ethics Committee of Madras Medical College approved the study.
Blood sugar
Both fasting and postprandial blood sugar are estimated by glucose oxidase and peroxidase (GOD–POD) method.
Thyroid Profile
Estimation done in fasting serum sample.
Methods used:
30
Renal function test
The Blood Urea in this study was estimated using DAM method (Diacetyl Monoxime). Serum creatinine was estimated using Modified Jaffe’s method.
Urinalysis
Urine sample is collected for urine routine analysis which includes sugar, protein, cytology and urinary sediments
Thyroid profile
Reference values: FT3 : 3.1-6.8 pmol/L ,TSH : 0.3-4.2mcgIU/mL, FT4 : 0.93- 1.7 ng/dL. Overt hypothyroidism is defined as TSH >10 mcgIU/mL with FT4 < 0.93 ng/ dL.
Subclinical hypothyroidism is defined as TSH > 4.5 mcgIU/ml with normal FT3 and FT4 levels Overt hyperthyroidism is defined as TSH < 0.3 mcgIU/mL with FT4 > 1.7 ng/dL
31
RESULTS AND ANALYSIS
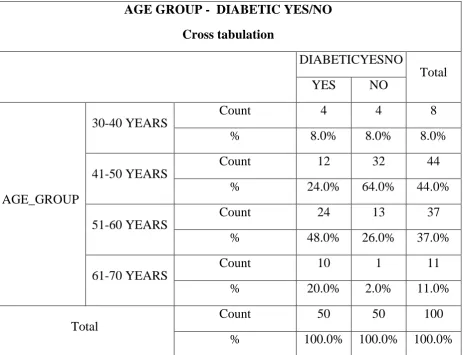
[image:42.595.87.551.397.752.2]AGE DISTRIBUTION OF CASES
Table-1
Frequency Table
AGE GROUP Frequency Percent
30-40 YEARS 8 8.0 41-50 YEARS 44 44.0 51-60 YEARS 37 37.0 61-70 YEARS 11 11.0 Total 100 100.0
AGE GROUP - DIABETIC YES/NO
Cross tabulation
DIABETICYESNO
Total YES NO
AGE_GROUP
30-40 YEARS
Count 4 4 8 % 8.0% 8.0% 8.0% 41-50 YEARS
Count 12 32 44 % 24.0% 64.0% 44.0% 51-60 YEARS
Count 24 13 37 % 48.0% 26.0% 37.0% 61-70 YEARS
Count 10 1 11 % 20.0% 2.0% 11.0% Total
33
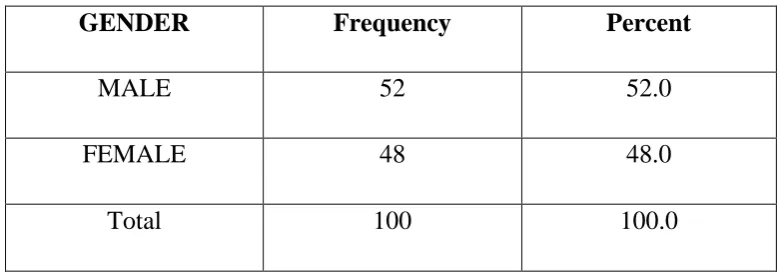
[image:44.595.120.511.149.287.2]Distribution of Cases According to Gender
Table-2
GENDER Frequency Percent
MALE 52 52.0 FEMALE 48 48.0 Total 100 100.0
52% 48%
GENDER
MALE
34
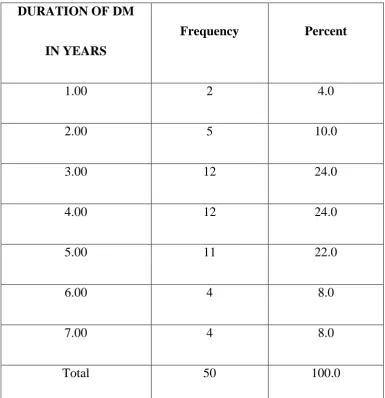
[image:45.595.123.509.189.588.2]Distribution According to Duration of Diabetes Mellitus
Table-3
DURATION OF DM
IN YEARS
Frequency Percent
1.00 2 4.0 2.00 5 10.0 3.00 12 24.0 4.00 12 24.0 5.00 11 22.0 6.00 4 8.0 7.00 4 8.0 Total 50 100.0
35 2%
5%
12%
12% 11%
4% 4%
DIABETIC
1
2
3
4
5
6
36
DURATION_GROUP Frequency Percent
UP TO 2 YEARS 7 14.0 2-4 YEARS 24 48.0 ABOVE 4 YEARS 19 38.0 Total 50 100.0
7%
24% 19%
YEARS OF DIABETIC
UP TO 2 YEARS
2-4 YEARS
37
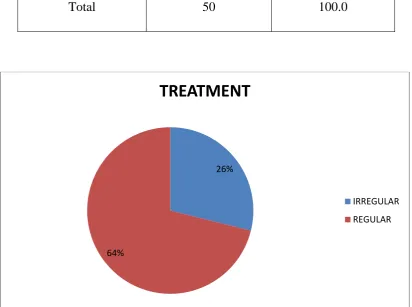
[image:48.595.109.522.292.599.2]DISTRIBUTION ACCORDING TO REGULARITY OF TREATMENT
Table-4
TREATMENT Frequency Percent
IRREGULAR 13 26.0 REGULAR 37 64.0 Total 50 100.0
26%
64%
TREATMENT
IRREGULAR
38
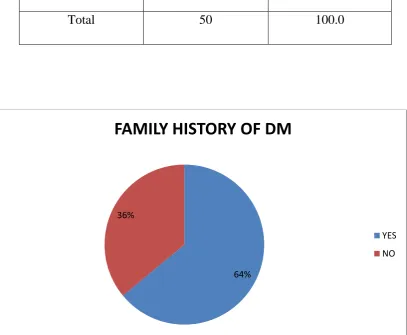
DISTRIBUTION ACCORDING TO FAMILY HISTORY OF
[image:49.595.110.518.309.644.2]DIABETES MELLITUS
Table-5
FAMILY H/O DM Frequency Percent
YES 32 64.0 NO 18 36.0 Total 50 100.0
64% 36%
FAMILY HISTORY OF DM
YES
39
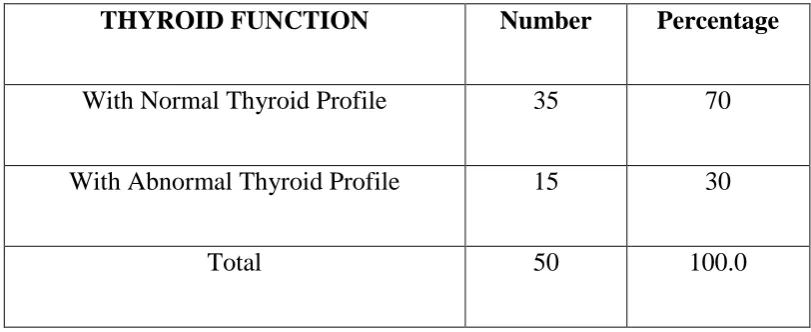
DISTRIBUTION OF CASES ACCORDING TO ABNORMAL
[image:50.595.112.518.190.356.2]THYROID PROFILE
Table-6
THYROID FUNCTION Number Percentage
With Normal Thyroid Profile 35 70 With Abnormal Thyroid Profile 15 30
Total 50 100.0
40
[image:51.595.103.519.198.457.2]DISTRIBUTION OF THYROID DISEASES
Table-7
Thyroid Profile Number of cases Percentage
Normal 35 70 Overt Hypothyroidism 7 14 Subclinical Hypothyroidism 4 8
Overt Hyperthyroidism 2 4 Subclinical Hyperthyroidism 2 4 Total 50 100
41
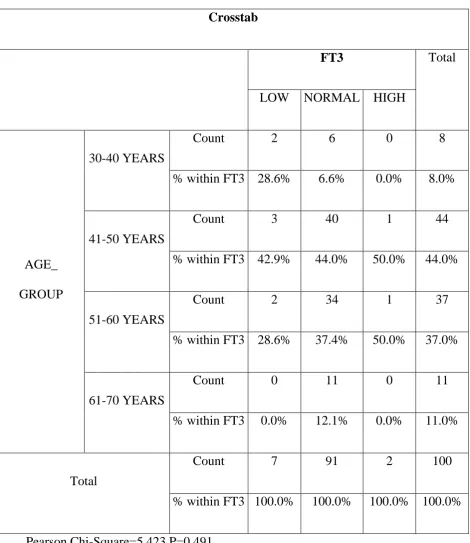
[image:52.595.82.553.168.711.2]ABNORMAL THYROID PROFILE VS AGE GROUP
Table-8a
Crosstab
FT3 Total LOW NORMAL HIGH
AGE_ GROUP
30-40 YEARS
Count 2 6 0 8 % within FT3 28.6% 6.6% 0.0% 8.0%
41-50 YEARS
Count 3 40 1 44 % within FT3 42.9% 44.0% 50.0% 44.0%
51-60 YEARS
Count 2 34 1 37 % within FT3 28.6% 37.4% 50.0% 37.0%
61-70 YEARS
Count 0 11 0 11 % within FT3 0.0% 12.1% 0.0% 11.0%
Total
42 0% 10% 20% 30% 40% 50% 60% 70% 80% 90% 100%
LOW NORMAL HIGH
43
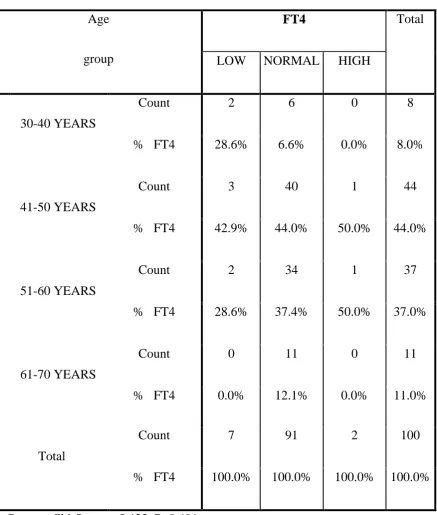
Table-8b
CROSSTAB
Age group
FT4 Total LOW NORMAL HIGH
30-40 YEARS
Count 2 6 0 8 % FT4 28.6% 6.6% 0.0% 8.0%
41-50 YEARS
Count 3 40 1 44 % FT4 42.9% 44.0% 50.0% 44.0%
51-60 YEARS
Count 2 34 1 37 % FT4 28.6% 37.4% 50.0% 37.0%
61-70 YEARS
Count 0 11 0 11 % FT4 0.0% 12.1% 0.0% 11.0%
Total
44 0% 10% 20% 30% 40% 50% 60% 70% 80% 90% 100%
LOW NORMAL HIGH
45
Table-8c
Age Group
TSH Total LOW NORMAL HIGH
30-40 YEARS
Count 0 6 2 8 % TSH 0.0% 7.1% 16.7% 8.0%
41-50 YEARS
Count 2 38 4 44 % TSH 50.0% 45.2% 33.3% 44.0%
51-60 YEARS
Count 1 30 6 37 % TSH 25.0% 35.7% 50.0% 37.0%
61-70 YEARS
Count 1 10 0 11 % TSH 25.0% 11.9% 0.0% 11.0%
Total
46 0% 10% 20% 30% 40% 50% 60% 70% 80% 90% 100%
LOW NORMAL HIGH
47
[image:58.595.108.514.230.608.2]ABNORMAL THYROID PROFILE VS GENDER
Table-9a
FT3 Total LOW NORMAL HIGH
GENDER
MALE
Count 3 48 1 52 % within FT3 42.9% 52.7% 50.0% 52.0%
FEMALE
Count 4 43 1 48 % within FT3 57.1% 47.3% 50.0% 48.0%
Total
48
0% 10% 20% 30% 40% 50% 60% 70% 80% 90% 100%
LOW NORMAL HIGH
43%
53%
50% 57%
47%
50%
FEMALE
49
TABLE-9B
FT4 Total LOW NORMAL HIGH
GENDER
MALE
Count 3 48 1 52 % FT4 42.9% 52.7% 50.0% 52.0%
FEMALE
Count 4 43 1 48 % FT4 57.1% 47.3% 50.0% 48.0%
Total
50
0% 10% 20% 30% 40% 50% 60% 70% 80% 90% 100%
LOW NORMAL HIGH
43%
53% 50%
57%
47% 50%
FEMALE
51
TABLE-9C
TSH Total LOW NORMAL HIGH
GENDER
MALE
Count 2 44 6 52 % TSH 50.0% 52.4% 50.0% 52.0%
FEMALE
Count 2 40 6 48 % TSH 50.0% 47.6% 50.0% 48.0%
Total
52
0% 10% 20% 30% 40% 50% 60% 70% 80% 90% 100%
LOW NORMAL HIGH
50% 52% 50%
50% 48% 50%
FEMALE
53
[image:64.595.111.523.143.576.2]Thyroid Profile In Type 2 Diabetic and Non Diabetic patients
Table-10a
FT3 Total LOW NORMAL HIGH
DIABETIC YES/NO
YES
Count 7 41 2 50 % within
FT3
100.0% 45.1% 100.0% 50.0%
NO
Count 0 50 0 50 % within
FT3
0.0% 54.9% 0.0% 50.0%
Total
Count 7 91 2 100 % within
FT3
100.0% 100.0% 100.0% 100.0% Pearson Chi-Square=9.890* P=0.007
54 0%
10% 20% 30% 40% 50% 60% 70% 80% 90% 100%
LOW NORMAL HIGH
100%
45%
100% 0%
55%
0%
NO
55
Table-10b
FT4 Total LOW NORMAL HIGH
DIABETIC YES/NO
YES
Count 7 41 2 50 % FT4 100.0% 45.1% 100.0% 50.0%
NO
Count 0 50 0 50 % FT4 0.0% 54.9% 0.0% 50.0%
Total
Count 7 91 2 100 % FT4 100.0% 100.0% 100.0% 100.0% Pearson Chi-Square=9.890* P=0.007
56
0% 10% 20% 30% 40% 50% 60% 70% 80% 90% 100%
LOW NORMAL HIGH
100%
45%
100% 0%
55%
0%
NO
57
Table-10c
TSH Total LOW NORMAL HIGH
DIABETIC YES/NO
YES
Count 4 35 11 50 % TSH 100.0% 41.7% 91.7% 50.0%
NO
Count 0 49 1 50 % TSH 0.0% 58.3% 8.3% 50.0%
Total
Count 4 84 12 100 % TSH 100.0% 100.0% 100.0% 100.0% Pearson Chi-Square=14.667** P=0.001
58 0%
10% 20% 30% 40% 50% 60% 70% 80% 90% 100%
LOW NORMAL HIGH
100%
42%
92% 0%
58%
8%
NO
59
[image:70.595.123.507.213.638.2]Abnormal thyroid profile Vs Duration of Diabetes
Table-11a
Duration Group
FT3 Total LOW NORMAL HIGH
UP TO 2 YEARS
Count 1 6 0 7 % FT3 14.3% 14.6% 0.0% 14.0%
2-4 YEARS
Count 3 19 2 24 % FT3 42.9% 46.3% 100.0% 48.0%
ABOVE 4 YEARS
Count 3 16 0 19 % FT3 42.9% 39.0% 0.0% 38.0%
Total
60
0% 10% 20% 30% 40% 50% 60% 70% 80% 90% 100%
LOW NORMAL HIGH
14% 14%
0%
43% 46%
100%
ABOVE 4 YEARS
2 TO 4 YEARS
61
Table-11b
Duration group
FT4
Total LOW NORMAL HIGH
UP TO 2 YEARS
Count 1 6 0 7 % FT4 14.3% 14.6% 0.0% 14.0%
2-4 YEARS
Count 3 19 2 24 % FT4 42.9% 46.3% 100.0% 48.0%
ABOVE 4 YEARS
Count 3 16 0 19 % FT4 42.9% 39.0% 0.0% 38.0%
Total
62
0% 10% 20% 30% 40% 50% 60% 70% 80% 90% 100%
LOW NORMAL HIGH
14% 14%
0%
43% 46%
100%
43% 39%
0%
ABOVE 4 YEARS
2 TO 4 YEARS
63
Table-11c
Duration Group
TSH Total LOW NORMAL HIGH
UP TO 2 YEARS
Count 0 6 1 7 % TSH 0.0% 17.1% 9.1% 14.0%
2-4 YEARS
Count 3 16 5 24 % TSH 75.0% 45.7% 45.5% 48.0%
ABOVE 4 YEARS
Count 1 13 5 19 % TSH 25.0% 37.1% 45.5% 38.0%
Total
64
0% 10% 20% 30% 40% 50% 60% 70% 80% 90% 100%
LOW NORMAL HIGH
0%
17%
9%
75% 46%
46% 25%
37%
46%
ABOVE 4 YEARS
2 TO 4 YEARS
65
[image:76.595.107.525.231.569.2]Abnormal thyroid profile Vs Family history of Diabetes
Table-12a
Family H/O DM
FT3 Total LOW NORMAL HIGH
YES
Count 4 26 2 32 % FT3 57.1% 63.4% 100.0% 64.0%
NO
Count 3 15 0 18 % FT3 42.9% 36.6% 0.0% 36.0%
Total
66
0% 10% 20% 30% 40% 50% 60% 70% 80% 90% 100%
LOW NORMAL HIGH
57%
63%
100% 43%
37%
0%
NO
67
Table-12b
Family H/O DM
FT4 Total LOW NORMAL HIGH
YES
Count 4 26 2 32 % FT4 57.1% 63.4% 100.0% 64.0%
NO
Count 3 15 0 18 % FT4 42.9% 36.6% 0.0% 36.0%
Total
68
0% 10% 20% 30% 40% 50% 60% 70% 80% 90% 100%
LOW NORMAL HIGH
57%
63%
100% 43%
37%
0%
NO
69
Table-12c
Family H/O DM
TSH Total LOW NORMAL HIGH
YES
Count 4 23 5 32 % TSH 100.0% 65.7% 45.5% 64.0%
NO
Count 0 12 6 18 % TSH 0.0% 34.3% 54.5% 36.0%
Total
70
0% 10% 20% 30% 40% 50% 60% 70% 80% 90% 100%
LOW NORMAL HIGH
100%
66%
46% 0%
34%
54%
NO
71
[image:82.595.73.562.188.558.2]ABNORMAL THYROID PROFILE VS TYPE OF TREATMENT
Table-13a
Crosstab
FT3 Total LOW NORMAL HIGH
TREATMENT
IRREGULAR
Count 7 4 2 13 % within FT3 100.00% 9.76% 100.00% 26.00%
REGULAR
Count 0 37 0 37 % within FT3 0.00% 90.24% 0.00% 74.00%
Total
Count 7 41 2 50 % within FT3 100.0% 100.0% 100.0% 100.0%
Pearson Chi-Square=31.238** P=0.001
72
73
Table-13b
Crosstab
FT4 Total LOW NORMAL HIGH
TREATMENT
IRREGULAR
Count 7 4 2 13 % within FT4 100.00% 9.76% 100.00% 26.00%
REGULAR
Count 0 37 0 37 % within FT4 0.00% 90.24% 0.00% 74.00%
Total
Count 7 41 2 50 % within FT4 100.0% 100.0% 100.0% 100.0% Pearson Chi-Square=31.238** P=0.001
74
75
Table-13c
Crosstab
TSH Total LOW NORMAL HIGH
TREATMENT
IRREGULAR
Count 4 2 7 13 % within TSH 100.00% 5.71% 63.64% 26.00%
REGULAR
Count 0 33 4 37 % within TSH 0.00% 94.29% 36.36% 74.00%
Total
Count 4 35 11 50 % within TSH 100.0% 100.0% 100.0% 100.0% Pearson Chi-Square=26.969** P<0.001
77
DISCUSSION
Diabetes mellitus is the most common endocrine disorder which involves multiple organ systems and leads to significant morbidity and mortality due to accompanying complications. Thyroid diseases are also a common endocrinopathy seen in the adult population. Thyroid hormones are intimately involved in cellular metabolism. Thus excess or deficit of either insulin or thyroid hormone could result in the functional derangement of the cellular metabolism.
In the present study patients of diabetes mellitus were taken from Medical and Diabetic Outpatient Departments, Male & Female medical wards of Rajiv Gandhi Govt General Hospital and Madras Medical College (Chennai) over a period of 6 months from April 2018 to September 2018 and they were evaluated for altered thyroid profile.
AGE DISTRIBUTION
In the present study of 50 type 2 diabetic patients, , 4 patients (8%) were up to 40 years, , 36 patients (72%) were between 41-60 years and 10 patients (20%) were 61 years or more. This shows that the disease was more prevalent between 41-60 years of age.
78
also similar to Kapur et al , who reported that maximum number of cases were diagnosed between 40 and 59 year of age with no significant difference between the genders.66
GENDER DISTRIBUTION
In the present study among diabetic patients 52% (26 nos) of the studied population were males and 48%(24 nos) were females. Male: Female ratio is 1.08:1
This is similar to Jali et al68 and Flatau E et al69 who reported that
diabetes was more prevalent in men than in women.
DURATION OF DIABETES MELLITUS
In the present study, majority of cases that is 48% (24/50) had duration of diabetes upto 2-4 years, 14% (7/50) of patients had duration upto 2 years and 38% (19/50) of patients had duration of illness more than 4 years. Majority of people are in the age group between 41 to 60 yrs and have duration of disease less than 4 years.
FAMILY HISTORY OF DIABETES MELLITUS
79
REGULARITY OF TREATMENT
In the present study, Out of 50 subjects of the study group 74% (37/50) were on regular treatment and 26% (13/50) were on irregular treatment. Asha et al observed that 97% of type 2 diabetics were on antidiabetic agents and most were using them irregularly.77 Kaur et al observed that oral anti diabetic
drug compliance rate was 62.9% in diabetic population.78 The difference in our study may be due to small sample size.
ABNORMAL THYROID PROFILE
In the present study, 30% (15) of the total 50 patients with diabetes mellitus had abnormal thyroid profile. The present study is similar to Vibha Uppal et al study of among the 120 diabetic subjects investigated, 17 % i.e. 20 had hypothyroidism and 7.5 % i.e. 9 had hyperthyroidism. Thus a total of 24.5 % patients showed thyroid disorder.
80
DISTRIBUTION OF THYROID ABNORMALITIES
In the present study, 8% (4/50) of the patients had report suggestive of sub clinical hypothyroidism and 4% (2/50) of the patients had report suggestive of sub clinical hyperthyroidism,14%(7/50) of the patients had report suggestive of overt hypothyroidism,4%(2/50) of the patients had report suggestive of overt hyperthyroidism.
Celani MF et al in their study of 290 type 2 diabetes mellitus patients found that 91 patients(31.4%) had abnormal TSH concentrations out of which 48.3% had subclinical hypothyroidism, 24.2% had subclinicl hyperthyroidism, 23.1% had overt hypothyroidism and 4.4% had overt hyperthyroidism.55
In the present study, diabetic patients, when compared with the control group of normal patients in Whickham Study86 and a 20 years follow-up of
whickham survey by Vanderpump MP et al87 shows that the prevalence of altered thyroid profile in the study group is significant (p=0.0064).
The presence of altered thyroid profile in diabetic patients may be due to the fact that:
81
SUMMARY
This study aimed at estimating the prevalence of thyroid dysfunction in type 2 Diabetes mellitus patients and also to find out it’s correlation with various risk factors.
The study sample included 50 type 2 diabetic patients and 50 normal healthy control subjects presented in the wards and outpatients department. Each patient was assessed clinically and by laboratory investigations.
Primary observations regarding thyroid profile in patients with type 2
diabetes mellitus
In the present study, 30%(15 nos) of patients with type 2 diabetes mellitus had abnormal thyroid profile.
In patients with abnormal thyroid profile most common abnormality was Overt Hypothyroidism-7 out of 50(14%) followed by Subclinical Hypothyroidism-4 out of 50(8%), Overt Hyperthyroidism-2 out of 50(4%) and Subclinical Hyperthyroidism – 2 out of 50(4%).
Our study showed significant correlation between abnormal thyroid profile with regularity of treatment.Thyroid dysfunction is common among those who are irregularly treated for diabetes mellitus.
82
CONCLUSION
Prevalence of thyroid dysfunction is more common among type 2 diabetes mellitus patients than in general population.
The age group most commonly affected with diabetes mellitus and Thyroid dysfunction is 41-60 years.
Thyroid dysfunction is common in irregularly treated type 2 diabetic patients.
Routine screening for thyroid dysfunction in type 2 diabetes mellitus patients may be justified because overt Thyroid dysfunction is associated with significant morbidity including the adverse effects on glycemic control, lipid profile, bone mineral density and cardiovascular events. Regular treatment for diabetes mellitus may prevent Thyroid dysfunction.
83
LIMITATIONS
Study population was small.
Associated thyroid autoimmunity was not evaluated due to constraints.
So it was not able to refine the spectrum of thyroid dysfunction in type 2 diabetics.
84
BIBLIOGRAPHY
1. Peter H Bennett, William C Knowlap. Definition, diagnosis and classification of diabetes. Joslin’s diabetes mellitus 14th edition,2005: 331-337.
2. Alvin C .Powers. Diabetes mellitus. Harrison’s principles of internal medicine 17th edition,2008: 2275-2304.
3. IDF Diabetes atlas 4th edition, 2009. 4. WHO(2003), Tech. Rep. Ser., N 916.
5. WHO(2002), Health situation in the South East Asia Region 1998-2000, New Delhi.
6. International Diabetes Federation, 20th October 2009, Montreal.
7. UN. 83rd plenary meeting, 20th December 2006. 61st session; Agenda 113.
8. Donald M Barnett, Leo P. Krall. History of diabetes. Joslin’s diabetes mellitus 14th edition,2005: 1-17.
9. Porter R. The greatest benefit to mankind, al medical history of humanity. New York: WW Norton, 1997:71.
10.Schadewaldt H. The history of diabetes mellitus. In: Van Englehardt D, ed. Diabetes, its medical and cultural history. Berlin: Springer Verlag, 1987:43–100.
85
12.Morrison H. Translation and introductory essay. Langerhans P. Contributions to the microscopic anatomy of the pancreas. Bull Inst Hist Med 1937;5:259–269.
13.Minkowski O. Historical development of the theory of pancreatic diabetes (introduction and translation by R. Levine). Diabetes
1989;38:1–6.
14. De Meyer J. Contribution a l'etude de la pathogenie du diabete pancreatique. Archive Internationale de Physiologie 1909:121– 180. 15. Banting FG, Best CH. The internal secretion of the pancreas. J Lab Clin
Med 1922;7:251–266.
16.Savage PJ, Bennion LJ, Bennett PH. Normalization of insulin and glucagon secretion in ketosis-resistant diabetes mellitus with prolonged diet therapy. J Clin Endocrinol Metab 1979;49:830–833.
17.Agner T, Damm P, Binder C. Remission in IDDM: prospective study of basal C-peptide and insulin dose in 268 consecutive patients. Diabetes Care 1987;10:164–169.
18.Gavin JR III, Alberti KGMM, Davidson MB, et al. Report of the Expert Committee on the Diagnosis and Classification of Diabetes Mellitus. Diabetes Care 1997;20:1183–1197
86
20.Turner RC, Cull CA, Frighi V, et al. Glycemic control with diet, sulfonylurea, metformin, or insulin in patients with type 2 diabetes mellitus: progressive requirement for multiple therapies (UKPDS 49). UK Prospective Diabetes Study (UKPDS) Group. JAMA 1999; 281:2005–2012.
21. Dabelea D, Pettitt DJ, Jones KL, et al. Type 2 diabetes mellitus in minority children and adolescents. An emerging problem. Endocrinol Metab Clin North Am 1999;28: 709-29.
22.American Diabetes Association 2007, Criteria for the diagnosis of diabetes mellitus. Diabetes care, Volume 30, Supplement 1, January 2007.
23.Howard BV. Pathogenesis of diabetic dyslipidemia. Diabetes Rev 1995;3:423–432.
24.Siegel RD, Cupples A, Schaefer EJ, et al. Lipoproteins, apolipoproteins, and low-density lipoprotein size among diabetics in the Framingham offspring study. Metabolism 1996;45:1267–1272.
25.Robert H. Eckel. The metabolic Syndrome. Harrison’s principles of internal medicine 17th edition,2008:1509-1514.
87
27.J,Larry Jameson, Anthony P. Weetman. Disorders of thyroid gland. Harrison’s principles of internal medicine 17th edition,2008: 2224-2247. 28.Thyroid and Antithyroid drugs. Katzung Basic clinical pharmacology
10th edition,2007: 618-634.
29.Physiological effects of thyroid hormones. William F. Ganong Review of medical physiology 22nd edition: 317-332.
30.P.Reed Lorson, F. Davies. Quantitation of serum thyroid hormone concentration. Williams textbook of Endocrinology 11th edition: 299-332.
31.Nikhil Tandon. API Text book of medicine 8th edition:1002-1010 32. Chidakel A, Mentuccia D, Celi FS: Peripheral metabolism of thyroid
hormone and glucose homeostasis. Thyroid 2005; 15:899-903.
33.Gregory A. Brent, P. Reed Larsen, Terry F. Davies. Hypothyroidism and thyroiditis. Williams textbook of Endocrinology 11th edition: 377-409.
34.Huber G, Staub J-J, Meier C, et al: Prospective study of the spontaneous course of subclinical hypothyroidism: prognostic value of thyrotropin, thyroid reserve, and thyroid antibodies. J Clin Endocrinol Metab 2002; 87:3221-3226
88
36.Cappola AR, Fried LP, Arnold AM, et al: Thyroid status, cardiovascular risk, and mortality in older adults. JAMA 2006; 295:1033-1041.
37. F. Davies, P.Reed Lorson. Thyrotoxicosis. Williams textbook of Endocrinology 11th edition: 333-368.
38. Silva JE: The thermogenic effect of thyroid hormone and its clinical implications. Ann Intern Med 2003; 139:205-213.
39.Faber J, Galloe AM: Changes in bone mass during prolonged subclinical hyperthyroidism due to L-thyroxine treatment: a meta-analysis. Eur J Endocrinol 1994; 130:350-356.
40.R. Sathish,V. Mohan. Diabetes and Thyroid disease-A Review. Int J of Diabetes in Developing countries 2003;23; 120-123.
41. Schlienger JL, Anceau A, Chabrier G, North ML,. Stephan F. Effect of diabetic control on the level of circulating thyroid hormones. Diabetologia. 1982;22;486-8
42.Donckier JE. Endocrine diseases and diabetes. In: Textbook of Diabetes mellitus. Pickup JC, Williams G (eds), Blackwell Publishing Company, Chichester, 2003: 27.1– 27.25.
43. Coiro V, Volpi R, Marchesi C, et al. Influence of residual C-peptide secretion on nocturnal serum TSH peak in well-controlled diabetic patients. Clin. Endocrinal. 1997;47:305-10.
89
45.Taylor R, Muculloch A, Zeuzem S, Gray P, Clark F, Alberti G. Insulin secretion, adipocyte insulin binding and insulin sensitivity in thyrotoxicosis. Acta Endorcinol. 1985;109:96-103.
46. Ahren B, Lundquist I, Hedner P, Valdemassan S, Scheroten B. Glucose tolerance and insulin and C-peptide responses after various insulin secretions stimuli in hyperthyroid and hypothyroid subjects before and after treatment diab. Res. Clin. Practice. 1985;2:95-103.
47.Randin J, Tappy L, Scazziga B, Jequier E, Felber J. Insulin sensitivity and exogenous insulin clearance in Grave's disease. Measurements by the glucose clamp technique and continuous glucose calorimetry. Diabetes. 1986;35:178-81.
48. Bech K, Damsbo P, Eldrup E, et al. Beta cell function and glucose and lipid oxidation in Grave's disease. Clin. Endocrinol. 1996;44: 59-66. 49. Dimitriadis G, Raptis S A. Thyroid hormone excess and glucose
intolerance. Exp Clin. Endocrinol. Diabetes. 2001; 109: S225-S239. 50.Holness M, Sugden M. Continued glucose output after refeeding
contributes to glucose intolerance in thyroid disease. Biochem. J. 1987;247:801-4.
90
52.Haber R, Wilson C, Weinstein S, Pritsker A, Cushman S. Thyriod hormone increases the partitioning of glucose transporters to the plasma membrane in ARL 15 cells. Amer. J. Physiol. 1995;269:E605-E610. 53.Dimitriadis G. Parry-Billings M, Bevan S, et al. The effects of insulin on
transport and metabolism of glucose in skeletal muscle from hyperthyroid and hypothyroid rats. Eur. J. Clinical. Invest. 1997;27: 475-83.
54.Mohn A, Di Michele S, Di Luzio R, Tumini S, Chiarelli F. The effect of sub clinical hypothyroidism on metabolic control in children and adolescents with type 1 diabetes mellitus. Diab. Med. 2002;19:70-3. 55. Celani MF, Bonati ME, Stucci N. Prevalence of abnormal thyrotropin
concentrations measured by a sensitive assay in patients with Type 2 diabetes mellitus. Diabetes Res 1994; 27: 15-25.
56.Proces S, Delgrange E,Vander Borght TV, Jamart J, Donckier JE. Minor alterations in thyroid-function tests associated with diabetes mellitus and obesity in outpatients without known thyroid illness. Acta Clin Belg. 2001 Mar-Apr; 56(2):86-90.
91
58.Vondra K, Vrbikova J, Dyorakova K. Thyroid gland diseases in adult patients with diabetes mellitus. Minerva Endocrinol. 2005 Dec;30(4):217-36
59.Abdel Rahman, Nusier MK, Amari FL et al. Thyroid dysfunction in patients with type 2 diabetes mellitus in Jordan. Saudi Med J. 2004 Aug;25(8):1046-50.
60.Perros P, Mc Crimmon RJ, Shaw G, Frier BM, Frequency of thyroid dysfunction in diabetic patients, value of annual screening. Diabet Med 1995;12:622-627.
61.Smithson MJ. Screening for thyroid dysfunction in a community population of diabetic patients. Diabet Med 1998; 15 (2): 148-50.
62.Zdrojewicz Z, Humpich G, Januszewski A, Adamek J. The assessment of thyroid gland function in patients with non-insulin dependent diabetes mellitus(type2).WiadLek.1999;52(1-2):35-41.
63.Parr JH. The effect of long-term metabolic control on free thyroid hormone levels in diabetics during insulin treatment. Ann Clin Biochem. 1987 Sep; 24 (Pt 5):466-9.
92
65.Wild S, Rogli G, Green A. Global prevalence of diabetes estimates for the year 2000 and projection for 2030. Diabetes Care, 2004; 27: 1047-53.
66.Kapur A., Snehlatha C., Ramchandran A., Vijay V., Mohan V., Das A.K.,Rao P.V., Yajnik C.S., Prasanna Kumar K.M., Jyotsna Nair: High prevalence of diabetes and impaired glucose tolerance in India. National Urban diabetes survey. Diabetologia 2001; Vol. 44: 1094 –1101.
67.Arthur M.Michalek, Martin C.Mahoney, Donald Calebaugh: Hypothyroidism and Diabetes Mellitus in an American Indian Population. Journal of family practice 2000 July; 49:638-640.
68..Jali MV, Mohan V, Ramchandran A, Snehlatha C and Viswanathan M; High Prevalence of diabetes in an Urban population in South India. BMJ Sept 1988; Vol. 297: p- 587-590.
69.Flatau E.; Trougouboff P.; Kaufman N.; Reichman N.; Luboshitzky R.Prevalence of hypothyroidism and diabetes mellitus in elderly kibbutz members. European Journal of Epidemiology, Volume 16, Number 1, January 2000 , pp. 43-46(4).
70.Tanow L, Ressing P, Gall MA, Neelson FS. Prevalence of arterial hypertension in diabetic patients before and after JNC V. Diabetes Care 1994:Vol. 17, Issue 11: 1247-1251.
93
72.Assesment of burden of non communicable diseases, Final report. ICMR,2004.
73.Kannel WB, McGee DL. Diabetes and cardiovascular disease. The Framingham Study. JAMA 1979;241:2035-38.
74.Jarrett RJ, McCartney P, Keen H. The Bedford survey: ten year mortality rates in newly diagnosed diabetics, borderline diabetics and normoglycaemic controls and risk indices for coronary heart disease in borderline diabetics. Diabetologia
1982;22:79–84.
75.Tattersal R.B., Fojans S, Arbor A: Prevalence of Diabetes and Glucose Intolerance in offsprings of 37 conjugal Diabetic parents. Diabetes 1975, 24:452-462.
76.Vishwanthan M, Mohan V, Snehlatha C, Ramchandran A: High prevalence of type 2 Diabetes among the offspring of conjugal type 2 parents in India. Diabetologia, 1985, 28:907-910.
77.Asha A, Pradeepa R, Mohan V. Evidence for Benefits from diabetes education program. Int J Diab Dev Countries 2004; 24:96-102(4).
78.Kaur K, Singh MM, Kumar, Walia I. Knowledge and self-care practices of diabetics in a resettlement colony of Chandigarh. Indian J Med Sci. 1998;52:341-7.
94
80.Yon Gik Kim, Youngsoo Shin, Younsoo Park. Prevalence of Diabetes and impaired glucose tolerance in Yonchon country, South Lorea, Diabetic care 1994, 545-48.
81.Marianne Hove, Jatti K. Kristensen, Torsken Launtzen and Toke Befe. Prevalence of retinopathy in an unselected population of Type 2 diabetes mellitus , Denmark. Acta Ophthalmologica Scandinavica. August, 2004; Vol. 82 Issue 4: 443.
82.A.Southwell, D. Eckland. Managing the burden of type 2 diabetes: an international survey of physicians. Practical Diabetes Int. 2005;14:201-206.
83.Liao, Shofer: Abnormal glucose tolerance and increased risk for cardiovascular disease in Japanese Americans. Diabetic care. 2001, 24 (1):39-44.
84.Paolo Fumelli, Silvia Natalucci, Massimo Boemi. One and two compartment minimal models detect similar alterations of glucose metabolism indexes in hypertension. Metabolism.Volume 49;12: 1529-1536
85.D.H.Akbar, M.M.Ahmed, J. Al-Mughales. Thyroid dysfunction and thyroid autoimmunity in Saudi type 2 diabetics. Acta Diabetol(2006).43;14-18.
95
87.Vanderpump MP, Tunbridge WM, Frence JM, Appleton D, Bates D, Clark F, et al. Thee incidence of thyroid disorders in the community: a twenty year follow up of whickham survey. J Clin Endocrinol 1995;43(1):55-68.
88.Cardoso C, Ohwovoriole AE, Kuku SF. J Diabetes. A study of thyroid function and prevalence of thyroid auto antibodies in an African diabetic population. J Diabetes Complications 1995; 9:37-41.