White Rose Research Online URL for this paper: http://eprints.whiterose.ac.uk/98373/
Version: Accepted Version
Article:
Dunn, S.A., Freeth, M. orcid.org/0000-0003-0534-9095 and Milne, E.
orcid.org/0000-0003-0127-0718 (2016) Electrophysiological Evidence of Atypical Spatial Attention in Those with a High Level of Self-reported Autistic Traits. Journal of Autism and Developmental Disorders, 46 (6). pp. 2199-2210. ISSN 0162-3257
https://doi.org/10.1007/s10803-016-2751-3
eprints@whiterose.ac.uk https://eprints.whiterose.ac.uk/ Reuse
Unless indicated otherwise, fulltext items are protected by copyright with all rights reserved. The copyright exception in section 29 of the Copyright, Designs and Patents Act 1988 allows the making of a single copy solely for the purpose of non-commercial research or private study within the limits of fair dealing. The publisher or other rights-holder may allow further reproduction and re-use of this version - refer to the White Rose Research Online record for this item. Where records identify the publisher as the copyright holder, users can verify any specific terms of use on the publisher’s website.
Takedown
If you consider content in White Rose Research Online to be in breach of UK law, please notify us by
Electrophysiological evidence of atypical spatial attention in those with a high level of
self-reported autistic traits
Stephanie A Dunn, Megan Freeth and Elizabeth Milne
The University of Sheffield
e.milne@sheffield.ac.uk (+44) 0114 22 26558
sadunn1@sheffield.ac.uk (+44) 07473646660
m.freeth@sheffield.ac.uk (+44) 0114 22 26652
Abstract
Selective attention is atypical in individuals with autism spectrum conditions. Evidence
suggests this is also the case for those with high levels of autistic traits. Here we investigated
the neural basis of spatial attention in those with high and low levels of self-reported autistic
traits via analysis of ERP deflections associated with covert attention, target selection and
distractor suppression (the N2pc, NT and PD). Larger N2pc and smaller PD amplitude was
observed in those with high levels of autistic traits. These data provide neural evidence for
differences in spatial attention, specifically, reduced distractor suppression in those with high
levels of autistic traits, and may provide insight into the experience of perceptual overload
often reported by individuals on the autism spectrum.
Introduction
An important function of selective attention is to resolve competition in the visual
environment by directing resources to goal relevant stimuli (Desimone & Duncan, 1995).
Research has shown that those with autism spectrum conditions (ASC) demonstrate atypical
selective attention compared to those who are typically developing (Burack, 1994; Plaisted,
O’Riordan & Baron-Cohen., 1998). Here we used event-related potentials (ERPs) to
investigate whether those who report high levels of autistic traits also show evidence of
atypical selective attention.
Tasks that are used to assess selective attention in ASC typically involve detecting a
target in an array of distracting information (e.g. visual search). Using a modified visual
search task, Burack (1994) found that those with ASC showed a search-advantage when
attention was limited to a narrow visual field, constrained by a window (12.2° visual angle).
However, when irrelevant distractors were presented within the window, as opposed to
outside of the window, participants with ASC showed a greater detriment to response time
than typically developing controls. Burack (1994) suggested that this reflects an “inefficient
attentional lens” in ASC and subsequent studies have supported this claim (e.g Mann &
Walker, 2003). Other work has shown that children with ASD show reduced supression of
distractors in a flanker task (Adams & Jarrold, 2012). Remington et al., (2009) demonstrated
that those with ASC show strong interference from distracting flanker letters at high levels of
perceptual load, a finding they consider to reflect greater perceptual capacity in those with
ASC. A similar finding was also observed in those with high scores on a questionnaire which
measures self-reported autistic traits in the general population (Autism Spectrum Quotient,
AQ, Baron-Cohen et al., 2001). Specifically, Bayliss & Kritikos, (2011) found that those with
above average autism quotient (AQ) scores showed stronger interference from distractors at
array of evidence to suggest that individuals with ASD, and also those with high levels of
autistic traits, have atypical spatial attention, which may be manifested by reduced
suppression of distracting information.
ERP research has identified robust neural correlates of selective attention (for a
review see Luck & Kappenman, 2013). This research forms an excellent knowledge base
from which to explore selective attention in the autism spectrum. In our recent paper
investigating the neural basis of feature-based selective attention (Milne et al., 2013) we
reported ERP data which revealed differences in resource allocation to irrelevant distractors
between those with high and low levels of autistic traits. The task involved sequential
presentations of single stimuli which differed in colour and / or orientation. Targets were
identified on the basis of feature combination and distracters shared either two, one or zero
features with targets. We found increased P3b amplitude following presentation of distractors
which did not share features with the target in participants with more autistic traits compared
to those with fewer autistic traits, indicating increased processing of irrelevant distractor
stimuli in the high AQ group.
Here we aimed to establish whether neural indices of spatial attention are also atypical
in those with high levels of autistic traits. This was achieved by presenting stimulus arrays of
two to four items from which the relevant target must be identified and processed while the
distracting stimuli also present should be ignored. This task generates the N2pc ERP
component, which is a posterior component in the N2 time-range, recorded from electrodes
over temporal/parietal areas (~200 to 300 ms post stimulus onset, Luck & Hillyard, 1990;
1994a; 1994b) The N2pc represents the difference between the signal recorded from
electrodes that are either contralateral or ipsilateral to a target (Woodman & Luck, 1999). For
example, when presented with a visual search display, amplitude is larger at electrodes that
the N2pc has been localised to the ventral occipital cortex (Hopf et al., 2000), and the
cognitive process reflected by the N2pc is the deployment of covert attention in order to
select a target in space (Eimer, 1996; Kiss, Van Velzen & Eimer., 2008). Hickey, DiLollo,
and McDonald., (2009) identified two subcomponents of the N2pc, the PD, a positive
difference between contralateral and ipsilateral waveforms, reflecting the suppression of
distractors in space, and the NT, a negative difference between contralateral and ipsilateral
waveforms which reflects target selection. Measuring these components in those who vary in
levels of autistic traits enables us to investigate spatial attention in the autism spectrum. If
mechanisms supporting spatial attention differ between those with high and low levels of
autistic traits, then this will be evidenced by group-differences in N2pc amplitude.
We reasoned that enhanced perceptual capacity as reported in ASC (Remington et al.,
2009; 2012) and in those without ASC but with high levels of autistic traits (Bayliss &
Kritikos, 2011) may enable participants to process relevant and irrelevant items in a
simultaneous parallel-like manner. Indeed this has been suggested as one explanation for
superior visual search seen in those with ASC (Remington et al., 2009). Processing relevant
and irrelevant items simultaneously may be reflected by a larger N2pc amplitude because of
the need for more focused attention (Sawaki, Luck & Raymond, 2015) and an attenuated PD
because of a lack of distracter suppression. Therefore, in our first study we predicted that the
N2pc would be larger in those with high levels of autistic traits compared to those with low
levels of autistic traits. In our second study we predict that a large N2pc in those with high
levels of autistic traits will be accompanied by an attenuated PD.
Study One
Method
The AQ is a brief questionnaire which asks respondents to indicate whether they
agree or disagree with 50 statements describing social/communication and behavioural traits
and preferences (Baron-Cohen et al., 2001). Each of the 50 items is scored as 0 or 1, with 1
being indicative of a response associated with an autistic-trait, thus the maximum score
indicative of a high level of autistic traits is 50. An example item from the AQ is: “I prefer to
do things with others rather than on my own.” The Cronbach alpha for the overall AQ score
was found to be satisfactory in a student sample (.81) and general population sample (.71) by
Hoekstra et al., (2008).
Participants
Participants were recruited on the basis of their level of self-reported autistic traits as
measured by the AQ. A link to an online version of the AQ was distributed by email to all
students at the University of Sheffield and was completed by 1256 people. The mean AQ
score from this population was 17.8 with a range of 2-44. The top and bottom 10th percentiles
of the distribution corresponded to AQ scores of 27 and 10 respectively. From these tails of
the distribution thirty-four participants were invited to take part in the ERP study reported
here. As detailed below, some participants were excluded from the analysis. This was either
because their EEG data was contaminated with artifacts (N = 10) or because they showed
chance performance on the behavioural task (N = 2). The final sample was comprised of ten
individuals (four female, six male) with high AQ scores and twelve individuals (seven
female, five male) with low AQ scores. The high AQ group had a mean AQ score of 31 (s.d
= 2.7, score range = 28 - 37), and a mean age of 25 (s.d = 9.2, range = 19 - 49), and the low
AQ group had a mean AQ score of 8.5 (s.d = 1.6, score range = 6 - 10), and a mean age of 22
(s.d = 3.1, range = 19 – 28). Age did not significantly differ between groups t (20) = 1.1, p =
.30, d = 0.5. Three participants (two in the high AQ group) were left handed. The remaining
and the study received ethical approval from the department of Psychology ethics
sub-committee. All participants were invited to declare any personal or close family ASC
diagnosis (parent/sibling) before the study began and none did so. The experimenter was
blind to the AQ score of each participant until post testing.
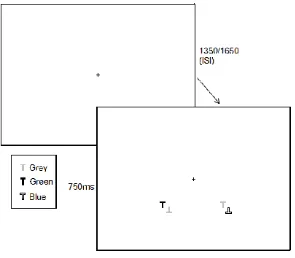
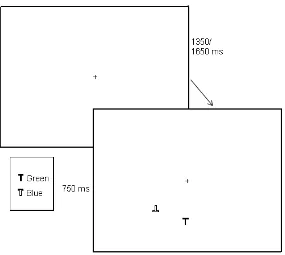
Design and Stimuli
EEG was recorded while participants completed a spatial attention task which was
based on Luck et al., (1997). Targets in the task were defined by colour (blue/green), target
colour alternated between blocks. Participants sat 70cm from the screen and were instructed
to report whether the target letter T was upright or inverted. Each search array was composed
of 4 letters. The two coloured letter Ts were presented in opposing visual hemifields and were
always presented in the lower visual field. Next to each coloured T was a grey distractor T at
a distance which ranged from 0.7° to 1.6° (measured centre to centre). A white fixation cross
remained visible at the centre of the display at all times and participants were instructed to
remain focussed on this for the duration of the task. The stimuli were presented on a grey
background (3.98cd/m2) and the coloured search items were green (CIE coordinates u’ =
0.278, v’ = 0.567) and blue (CIE coordinates u’ = 0.204, v’ = 0.274) with luminance ranges
within 3% of 18cd/m2. The grey distractor Ts were also within this luminance range. Of the
900 total trials, the green T appeared in the left visual field (LVF) in 50% of trials and in the
RVF in the other 50% of trials, randomly determined within a given block. The blue T was
always placed in the opposite hemifield to the green T. The letters were presented at random
locations within rectangular areas that were 1.4°*1.4° in size, located 2.7° below and to the
left and right of fixation. The letter Ts were 0.6° high and 0.5° wide. Of the 900 trials the Ts
occurred equally in green/blue, left/right and upright/inverted. An example of this task can be
Procedure
Each array remained on screen for 750 ms during which time participants were
required to discriminate the orientation of the target T. There was a randomly varying ISI
between successive arrays of 1350 ms or 1650 ms. The experimental session was preceded by
two blocks of 12 practice trials, one blue and one green block. Accuracy feedback was given
on screen during the practice trials but was not given during experimental trials. Participants
pressed a response key with their left index finger if the target was upright and with their
right index finger if the target was inverted.
Please insert Figure 1 here
EEG Recording and Processing
EEG was recorded continuously using a high-density array of 128 Ag/AgCl
electrodes (Electrical Geodesics Inc.). The signal was amplified by 1000, filtered on line with
a band-pass of 0.01 – 80Hz and digitised with a sampling rate of 1000Hz. Impedance was
kept below 50 k . Electro-oculogram (EOG) was also recorded from electrodes located
above and below the left and right eyes and from the left and right canthus. Data were
referenced to the vertex electrode. The data were filtered offline using 0.1Hz high pass and
30Hz low pass cut offs. Visibly noisy channels were removed from the data by hand. The
data were then epoched with a time window of -200 to 800 ms pre and post stimulus.
Artifact Rejection
Epochs were excluded from all remaining channels if the signal went above 75µV or
below -75µV. Epochs demonstrating increases in amplitude associated with blinks were
excluded using the 5 electrodes surrounding the eyes (EGI electrodes; 14, 17, 22, 126 &127),
were identified by subtracting the signal from the left canthus from the signal at the right
canthus, creating a difference wave. Epochs were rejected when activity in the resulting
difference wave went above 16 µV or below -16 µV (Woodman & Luck, 2003),
corresponding to approximately one degree of eye movement (Luck, 2005).
ERP datasets were excluded on the basis of being contaminated by excessive eye or muscle
movements (N = 10). Datasets were also excluded if participants did not understand
instructions as reflected in accuracy being below 50% correct (N = 2).
As described below, two ERP waveforms were computed, reflecting the signal
contralateral and ipsilateral to the target. There was no difference in the number of trials used
to calculate contralateral (Mean = 315.2, s.d = 75.5), or ipsilateral ERPs (Mean = 323.4, s.d =
79.2). Additionally there was no group difference in the amount of trials used to calculate
ERPs (High AQ Mean = 630.1, s.d = 177.1), (Low AQ Mean = 645.6, s.d = 124.8).
ERP Processing
Amplitude
In order to calculate the N2pc, the average signal between 180 and 300 ms was
calculated from trials during which a correct behavioural response was made. This was
obtained from four pairs of electrodes (T7/T8, P3/P4, P07/08 and P7/P8) relative to a 200 ms
pre stimulus baseline voltage. The numbers on the EGI cap for these pairs of electrodes are
(46/109, 53/87, 59/92 & 66/85). The time window and electrodes used are in line with
previous work (Luck et al., 1997). The signal contralateral to a target was acquired by taking
the mean amplitude from the four electrodes on the opposite side of the head to the target.
Ipsilateral amplitudes were acquired by taking the mean amplitude from the four electrodes
Latency
Because latency measures are nonlinear and vulnerable to high levels of measurement error,
the jackknife approach was used (Miller, Patterson & Ulrich, 1998; Kiesel, Miller, Jolicoeur
& Brisson, 2008, Luck et al., 2009). Latencies were measured from a number of difference
waves, computed from a subsample of n – 1 of the individual participants. These were
calculated separately for high and low AQ groups. These iterations inflate the t value;
therefore, before testing for significance, the t value must be adjusted according to:
Adjusted t = t / (n -1)
Onset latency was calculated with the fractional area latency method, using 15% area latency
(Luck et al., 2009) on the N2pc difference wave (Contralateral minus Ipsilateral) between
180 and 300 milliseconds. Kiesel et al., (2008) concluded that the jack knife method
combined with fractional area latency is a superior approach to investigate onset latency in
difference wave components.
Results
Behavioural Results
As reported in table 1, accuracy was high and did not vary significantly between high and
low AQ scorers, t (20) = 1.8, p = .08, d = 0.8. Similarly, median reaction time did not differ
between groups, t (20) = 1.2, p = .23, d = 0.5.
N2pc amplitude
N2pc amplitude was analysed using a 2 x 2 repeated measures ANOVA with a
within-subjects factor of laterality (contralateral vs ipsilateral) and a between-within-subjects factor of AQ
eta-squared was used to report effect size. Guidelines for interpreting partial eta-eta-squared values
are: 0.01 = small effect, 0.09 = medium and 0.25 = large (See Cohen, 1988). A highly
significant interaction between contraleteral and ipsilateral signal confirmed the presence of a
reliable N2pc, F (1, 20) = 27.1, p = <.001, p² = 0.58. In addition, there was a significant
interaction between AQ group and laterality, F (1, 20) = 5.4, p = .03, p²= 0.21. Paired
samples t-tests revealed that the difference between the ipsilateral and contralateral signal
was significant for both the high AQ group t(9) = 4.1, p = <.001, d = 1.3, and the low AQ
group, t(11) = 2.9, p = .02, d = 0.9, but effect sizes indicated that the difference was larger in
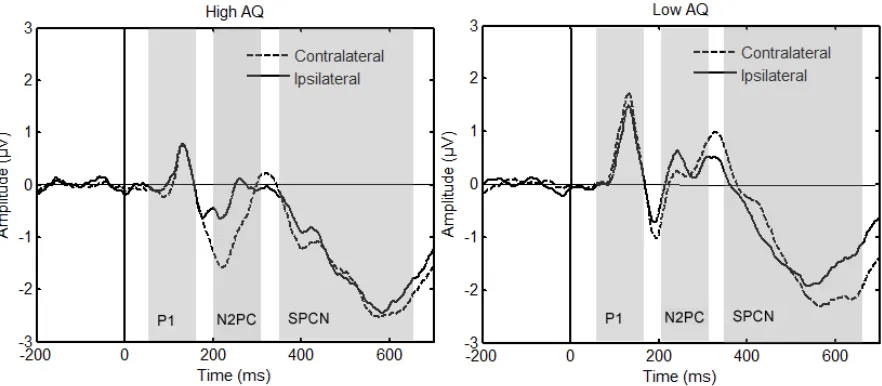
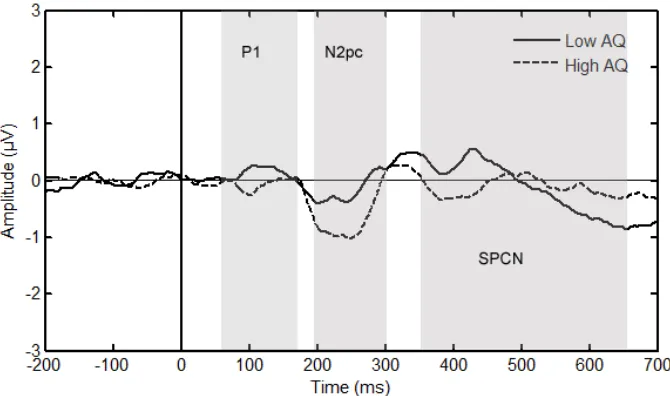
the high AQ group. In Figure 2, ERPs ipsilateral and contralateral to the appearance of a
target are shown separately for high and low AQ scorers. Figure 3 shows the difference wave
where a larger N2pc amplitude is evident in the high AQ scorers.
Please insert Figure 2 here
Please insert Figure 3 here
Onset Latency
Latency values were calculated as the time point in which the difference wave (contralateral
minus ipsilateral) reached 15% of the area under the curve between 180 and 300
milliseconds.
An independent measures t-test with a between factor of AQ group revealed no significant
group difference in the onset of the N2pc, t (20) = .31, p = .76, d = .03. Mean latency values
are given in Table 2.
Additional ERP analyses
In order to establish whether the groups differed in any ERP components other than N2pc
and SPCN amplitude. The P1 is an early component, normally peaking around 100 ms. The
P1 reflects visual processing and is thought to originate in extra striate cortex (Luck &
Kappenman, 2013). The SPCN (sustained posterior contralateral negativity) occurs between
350 and 650 ms and this was the time window used (Jolicoeur, Brisson & Robitaille, 2008).
The SPCN represents the difference between the signal recorded from electrodes that are
either contralateral or ipsilateral to a target and is interpreted as an electrophysiological
marker of working memory maintenance (Luck & Kappenman, 2013).
Peak P1 amplitude (Time window: 70-170ms) was analysed at occipital electrodes
(O1/O2 EGI: 72/77) using an independent measures t-test with a between subjects factor of
AQ group. Although Figure 3 suggests a potential between group difference in the amplitude
of the P1, statistical analysis indicated no signficant difference in P1 amplitude between
groups t (20) = 1.6, p = .13, d = 0.7.
Mean SPCN amplitude (350-650 ms) was analysed at all four pairs of electrodes
described above using a 2 x 2 mixed measures ANOVA with a within-subjects factor of
laterality (contralateral vs ipsilateral) and a between-subjects factor of AQ group. This
revealed a main effect of laterality F (1, 20) = 16.8, p = .001, ²P = .46, showing a clear SPCN
in these data. This did not interact with AQ group F (1, 20) = .48, p = .50, p²= .02, indicating
that SPCN did not differ between the high and low AQ scorers.
These additional analyses confirm that there was no between-group difference in the
amplitude of either of the early (P1) or late (SPCN) ERP components confirming that
differences between groups were uniquely observed in the N2pc component.
A Simon effect analysis was conducted in order to ensure that the laterality of stimuli and
responses did not influence N2pc amplitude. For this analysis the magnitude of the N2pc was
calculated by subtracting mean ipsilateral amplitude between 200 and 300 ms from mean
contralateral amplitude between 200 and 300 ms. These values were calculated separately
from trials in which the stimulus hemifield was compatible or incompatible with response
side, and were entered into a 2 x 2 ANOVA with compatibility as the within subjects factor
and AQ group as the between subjects factor. This analysis revealed no significant difference
in N2pc amplitude between trials where appearance of the target and response were
compatible or where they were incompatible, F (1, 20) = .01, p = .93, p²= .001 and no
significant interaction between these variables and AQ group, F (1, 20) = .02, p = .89, p²=
.001. This analysis confirms that the Simon effect did not influence N2pc amplitude which is
in line with previous work (Cespón, Galdo-Álvarez & Díaz., 2012).
Interim Discussion
The objective of Study One was to establish whether an ERP signature of covert deployment
of attention, i.e. the N2pc component, differed between those with either high or low levels of
autistic traits. We found a clear between group difference in N2pc amplitude, providing direct
evidence for differences in the mechanisms underlying spatial attention in those with high
and low levels of autistic traits. In order to be sure that this effect was not driven by
differences in other ERP components, and to confirm that N2pc was the only component that
differed between the low and high AQ scorers, we also checked for differences between
groups in P1 peak amplitude and mean SPCN amplitude. No between group differences were
observed in these components.
Remington and colleagues have shown that those with ASC do not show the usual
this is a facet of higher perceptual capacity in individuals with ASC, and one consequence
appears to be that those with ASC are able to allocate attention to task-irrelevant items in a
scene even at high levels of load (Remington et al., 2009). We (Milne et al., 2013) recently
demonstrated that those with high levels of autistic traits showed larger P3b amplitude
following the presentation of irrelevant non-target stimuli than those with lower levels of
autistic traits, suggesting that there may be reduced suppression of irrelevant or distracting
stimuli in those with high levels of autistic traits. N2pc amplitude, as measured here, reflects
the processes of both target selection and suppression, so it is not possible to identify whether
the larger N2pc amplitude reflects differences in target selection or suppression. However,
measuring the amplitude of the PD (Hickey et al., 2009) may offer a useful insight into this.
If our hypothesis that those with high levels of autistic traits show reduced distractor
suppression is correct then we would predict that larger N2pc amplitude will be accompanied
by reduced PD amplitudein those with high levels of autistic traits. The aim of study two was
therefore to attempt to replicate the finding from study one of increased N2pc in individuals
with higher levels of autistic traits, and to establish whether differences in distractor
suppression (PD) and / or target selection (NT) were also evident in those with more autistic
traits.
Study Two
Method
For this study an entirely new cohort of participants was recruited. All first year
students at our institution were invited to complete the AQ online. 864 participants completed
the AQ; the mean score was 18.6 with a range of 1 - 45. The top and bottom 10th percentiles
of the distribution corresponded to AQ scores of 28 and 11 respectively. From this
Nine participants were excluded from analysis due to EEG artifacts. This resulted in a final
sample of 36, with 17 high AQ (11 female, 6 male) participants and 19 low AQ (15 female, 4
male) participants. The high AQ group had a mean AQ score of 30 (s.d = 3.9, score range =
28 - 40) and a mean age of 21 (s.d = 3.4, range = 18 - 30) the low AQ group had a mean AQ
score of 8.5 (s.d = 2.1, score range = 5 – 11) and a mean age of 20 (s.d = 1.5, range = 18 -
23). Age did not significantly differ between groups t (34) = 1.0, p = .33, d = 0.3. Six
participants (five in the high AQ group) were left handed. Written informed consent was
obtained from all participants and the study received ethical approval from the department of
Psychology ethics sub-committee. All participants were invited to declare any personal or
close family ASC diagnosis before the study began and none did so. The experimenter was
blind to AQ score until post testing.
Design and Stimuli
Stimuli were the same as in study one, with the removal of the grey distractor Ts and the
addition of letter positions on the vertical meridian. This was a replication of Hickey et al,
(2009) experiment 4. The lateral/vertical organisation (see Figure 4) allowed for the isolation
of components related to lateral targets (NT) and lateral distractors (PD).
Search arrays were composed of 2 letters: equiluminant green and blue letter T’s
(measuring 1° of visual angle). The Ts were equidistant from central fixation and from each
other (5°) with 2 positions in the vertical meridian (directly above fixation and below: 0° and
180°) and 6 lateral positions (60°, 90°, 120°, 240°, 270° and 300°), 2 above the horizontal
meridian, 2 on the horizontal meridian and 2 below. There were 576 trials where a target
appeared laterally and 576 trials where a distractor appeared laterally. There were also 576
trials with the target and distractor were presented in opposing lateral positions to elicit the
positions. The opposing sides set up, as a balanced visual search display was intended to
elicit the N2pc (a summation of distractor and target processing).
Please insert Figure 4 here
Procedure
The procedure was the same as in study one. However, participants were now required to
respond with the index and middle finger of their dominant hand. This change was made as
an improvement on Study One, eliminating the need for Simon effect analysis. EEG
recording, pre-processing and artefact rejection were the same as in study one.
EEG Recording and Processing
EEG recording and processing was the same as in Study One.
Artifact Rejection
Artifact rejection procedures were the same as in Study One.
There was no significant difference in the number of trials used to calculate ERPs between
contralateral and ipsilateral ERPs for N2pc, (Contralateral Mean = 200.2, s.d = 48.4;
Ipsilateral Mean = 202.4, s.d = 37.2), PD (Contralateral Mean = 161.2, s.d = 52.8; Ipsilateral
Mean = 164.7, s.d = 47.1), or NT (Contralateral Mean = 167.4, s.d = 50.6; Ipsilateral Mean =
159.1, s.d = 51.1). There was also no significant difference in the number of trials used to
calculate ERPs between AQ groups for N2pc, (High AQ Mean = 413.4, s.d = 97.2; Low AQ
Mean = 396.2, s.d = 78.4), PD (High AQ Mean = 305.6, s.d = 98.8; Low AQ Mean = 336.5,
s.d = 90.6), or NT (High AQ Mean = 302.7, s.d = 97.1; Low AQ Mean = 318, s.d = 88.1)
trials.
ERP amplitudes were calculated using the same procedure as in study one. For N2pc
amplitude the time window used was 180-300 ms; for NT, 175-325 ms and for PD, 230-280 ms
(in line with Corriveau et al., 2012; Sawaki & Luck, 2010; Hickey et al., 2009).
N2pc/NT Amplitude
The signal contralateral to a target was acquired by taking the mean amplitude from the
electrodes on the opposite side of the head to the target. Ipsilateral amplitudes were acquired
by taking the mean amplitude from the four electrodes on the same side of the head as the
target.
PD Amplitude
The signal contralateral to a distractor was acquired by taking the mean amplitude from the
electrodes on the opposite side of the head to the distractor. Ipsilateral amplitudes were
acquired by taking the mean amplitude from the four electrodes on the same side of the head
as the distractor.
Latency
The same jack knife procedure was used as in study one.
Onset latency was calculated with the fractional area latency method, using 15% area latency
(Luck et al., 2009) on the difference wave (Contralateral minus Ipsilateral). For the N2pc
difference wave this was between 180 and 300 milliseconds. On the PD difference wave,
between 230 and 280 milliseconds and on the NT difference wave between 175 and 325
milliseconds.
Results
As reported in Table 1, accuracy was high and did not vary significantly between high and
low AQ scorers, t (1, 34) = 1.0, p = .32, d = 0.3, similarly median correct-trial reaction times
did not differ between high and low AQ scorers, t (1, 34) = .06, p = .95, d = <.01.
Please insert Table 1 here
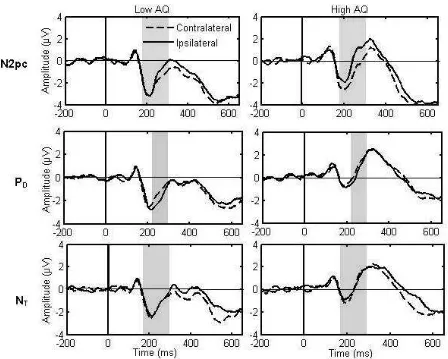
N2pc Amplitude
N2pc amplitude was analysed using a 2 x 2 repeated measures ANOVA with a
within-subjects factor of laterality (contralateral vs ipsilateral) and a between-within-subjects factor of AQ
group. A highly significant interaction between contraleteral and ipsilateral signal confirmed
the presence of a reliable N2pc, F (1, 34) = 19.7, p = <.001, p² = 0.58. In addition, there was
a significant interaction between AQ group and laterality, F (1, 34) = 9.1, p = .005, p²=
0.21. This result is consistent with the findings of study one. Paired sample t-tests revealed
that the difference between ipsilateral and contralateral signal was significant for the high AQ
group t(16) = 4.3, p = .001, d = 1.2, however it was not significant for the low AQ group,
t(18) = 1.3, p = .19, d = 0.3. In Figure 5, ERPs ipsilateral and contralateral to the appearance
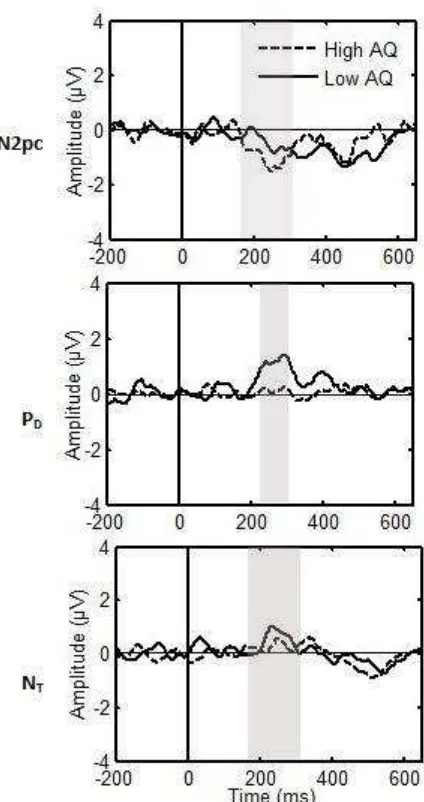
of a target are shown separately for high and low AQ scorers. Figure 6 demonstrates a larger
N2pc amplitude in those with high levels of autistic traits.
Onset Latency
An independent measures t-test with a between factor of AQ group revealed no significant
group difference in the onset of the N2pc, t (34) = .02, p = .81, d = <.01, again consistent
with the findings of study one. The mean values are shown in Table 2.
Please insert Table 2 here
PD amplitude was analysed using a 2 x 2 repeated measures ANOVA with a within-subjects
factor of laterality (contralateral vs ipsilateral) and a between-subjects factor of AQ group. A
highly significant interaction between contraleteral and ipsilateral signal confirmed the
presence of a reliable PD, F (1, 34) = 7.2, p = .01, p²= .17. In addition, there was a significant
interaction between AQ group and laterality, F (1, 34) = 5.7, p = .02, p²= .15. Paired
samples t-test revelead that the difference between ipsilateral and contralateral signal was
significant for the low AQ group t(18) = 3.9, p = .001, d = 1.0, but was not significant for the
high AQ group, t(16) = .43, p = .67, d = 0.1, suggesting that those with high levels of autistic
traits did not show a PD. In Figure 5, ERPs ipsilateral and contralateral to the appearance of a
target are shown separately for high and low AQ scorers. Figure 6 demonstrates a smaller PD
amplitude in those with high levels of autistic traits.
Onset Latency
An independent measures t-test with a between factor of AQ group revealed no significant
group difference in the onset of the PD, t (34) = .10, p = .91, d = <.01. The mean values are
shown in Table 2.
NT Amplitude
NT amplitude was analysed using a 2 x 2 repeated measures ANOVA with a within-subjects
factor of laterality (contralateral vs ipsilateral) and a between-subjects factor of AQ group. A
highly significant interaction between contralateral and ipsilateral signal confirmed the
presence of a reliable NT, F (1, 34) = 22.1, p = <.001, p²= .39. There was no significant
interaction between AQ group and laterality, F (1, 34) = .18, p = .38, p²= .01. In Figure 5,
ERPs ipsilateral and contralateral to the appearance of a target are shown separately for high
Onset Latency
An independent measures t-Test with a between factor of AQ group revealed no significant
group difference in the onset of the NT, t (34) = .61, p = .60, d = 0.2. The mean values are
shown in Table 2.
Please insert Figure 5 here
Please insert Figure 6 here
Additional ERP analyses
In order to be sure that the group difference in the ERP was present for the N2pc
component only; additional analyses were conducted on earlier and later components of the
ERP including P1 and SPCN amplitude.
P1 Amplitude
Peak P1 amplitude (time window: 70-170ms) was analysed at occipital electrodes (O1/O2
EGI: 72/77) using an independent measures t-test with AQ group as a between subjects
factor. Peak P1 amplitude did not differ between groups during N2pc trials, t (34) = .57, p =
.58, d = 0.2, PD trials t (34) = 1.1, p = .28, d = 0.4, or NT trials t (34) = .18, p = .86, d = 0.1.
SPCN Amplitude
Mean SPCN amplitude (350-650 ms) was analysed at all four pairs of electrodes described
above using 2 x 2 mixed measures ANOVA’s with a within-subjects factor of laterality
(contralateral vs ipsilateral) and a between-subjects factor of AQ group. This revealed a main
effect of laterality for N2pc F (1, 34) = 11.1, p = .002, p²= .25 and NT trials, F (1, 34) = 7.3,
(1, 34) = <.01, p = .97, p²= <.01 in N2pc or NT trials F (1, 34) = .42, p = .52, p²= .01,
indicating that SPCN did not differ between the high and low AQ scorers.
For PD trials there was no main effect of laterality F (1, 34) = 2.4, p = .13, p²= .07, which is
consistent with expectations as we would not expect to see an SPCN in response to
distractors.
General Discussion
The objective of this work was to establish whether an ERP signature of the
deployment of covert attention, i.e. the N2pc component, differed between those with either
high or low levels of autistic traits. In two separate studies, involving two entirely separate
cohorts of participants, we found that N2pc amplitude was significantly larger in individuals
with high, rather than low, levels of autistic traits. This finding provides neural evidence that
the deployment of attention differs between high and low AQ scorers. Specifically, larger
N2pc amplitude suggests more effortful processing, or greater allocation of attentional
resources, during target search. Study two indicated that the higher AQ scorers also had no
PD, a finding which indicates a lack of distractor suppression in the high AQ scorers.
Together, these results show that individuals with higher levels of autistic traits show
increased deployment of attention during a spatial search task, most likely as a result of a lack
of distractor suppression. No group differences were found in the NT component, indicating
that the neural mechanisms underpinning target selection do not differ between those with
high and low levels of autistic traits.
In study one, ERP amplitude was significantly larger when recorded from electrodes
contralateral to the target than electrodes ipsilateral to the target in both the high and low AQ
scorers. That is, both groups showed a significant N2pc component. However, in study two,
N2pc has been shown to be larger when stimuli are presented in the lower visual field (Luck
et al., 1997), therefore the stimuli in study one were always presented below fixation. In
study two, the task was modified so that we could measure NT and PD in addition to N2pc.
We used an existing paradigm (Hickey et al., 2009), which had previously been used to
measure these components, however this second paradigm did not limit stimuli to appearing
only in the lower visual field. This may explain why the low AQ group did not show a
significant N2pc in these data, especially given that N2pc onset was later (although
not-significantly so) in the low AQ group compared to the high AQ group. Importantly, the high
AQ group showed a significant N2pc in both study one and study two, providing support for
our conclusion that N2pc amplitude is increased in individuals with high AQ scores.
Previous work suggests that those with ASC (Remington et al., 2009) and those with
high levels of autistic traits (Bayliss & Kritikos, 2011) have an enhanced perceptual capacity.
Ultimately the result of this enhanced capacity appears to be the processing of normally
irrelevant distracting items in a visual scene and this could lead to the overwhelming
perceptual experience often reported by those with an ASC. Similarly, Adams and Jarrold,
(2012) used a flanker paradigm and found that when their task was made more simple for
participants (i.e increasing the size of the target), those with an ASC continued to show
interference errors from incongruent distracting flankers. Also, we (Milne et al., 2013)
recently demonstrated that those with high levels of autistic traits showed a larger response to
irrelevant stimuli compared to those with low levels of autistic traits, resulting in less
difference between the P3b response to targets and distractors. We suggested that there may
be reduced suppression of distractors in those with high levels of autistic traits, a claim which
is further supported by the data reported here. The small PD suggests a lack of active
suppression of distractors in those with high levels of autistic traits which may be a
P3b amplitude was associated with more efficient visual search, which led us to the rather
counter-intuitive conclusion that those who are better at visual search are those who are less
efficient at filtering out irrelevant stimuli. Therefore we might expect that those with a lack of
PD, and who are not suppressing irrelevant information, may be more efficient at visual
search, however further data is required to test this suggestion directly.
Further analyses confirmed that the group differences were unique to the N2pc and
PD. P1 amplitude did not differ between the high and low AQ scorers indicating that there
was no difference between the groups in terms of the initial sensory encoding of the stimuli.
In addition, SPCN did not differ between the groups indicating that post-perceptual processes
such as working memory maintenance and representations (Eimer & Kiss, 2010) do not differ
between those with high and low AQ scores. Rather, the group differences we report here are
restricted to processes that reflect attention deployment to goal relevant stimuli, and active
suppression of distractor stimuli.
As discussed by Gregory and Plaisted-Grant (2013), in any study of autistic traits,
there is the possibility that those with high AQ scores, particularly above the clinical cut off
defined by Baron-Cohen et al., (2001) could meet diagnostic criteria for an ASC. We
attempted to mitigate this by asking participants to declare any ASC diagnosis for themselves
or a close family member (parent/sibling) with the intention of excluding any participant who
did so. None of our participants indicated that either they or any of their first-degree relatives
had a diagnosis of ASD, making it likely that our findings do reflect differences in N2pc
amplitude on the basis of AQ score alone. Further research is needed to establish whether this
finding is replicated in individuals who have a clinical diagnosis of ASC.
In conclusion, here we present data which demonstrates that the amplitude of the
larger in those with high levels of autistic traits compared to those with low levels of autistic
traits. In addition, the PD, which reflects active suppressionof distractors, is reduced in those
with high levels of autistic traits. Reduced distractor suppression in those with increased
autistic traits is in-line with previous data showing that children with autism are less able to
supress distractors during a flanker task (Adams and Jarrold, 2012), and may reflect increased
perceptual capacity in those with high AQ scores (c.f. Kritikos & Bayliss, 2011). Taken
together with our previous findings of altered feature based attention in those with high levels
of autistic traits (Milne et al., 2013), this work adds to a growing literature demonstrating
atypical attentional processes in the autism spectrum. Additionally, the neural atypicalities
reported here could ultimately underlie the experience of perceptual overload often reported
References
Adams, N.C., & Jarrold, C. (2012). Inhibition in Autism: Children with Autism have
difficulty inhibiting irrelevant distractors but not prepotent responses. Journal of
Autism and Developmental Disorders, 42, 1052 -1063.
Almeida, R. A., Dickinson, J. E., Maybery, M. T., Badcock, J. C., & Badcock, D. R. (2010).
Visual search performance in the autism spectrum II: the radial frequency search task
with additional segmentation cues. Neuropsychologia, 48, 4117-4124.
Baron-Cohen, S., Wheelwright, S., Skinner, R., Martin, J., & Clubley, E. (2001). The
Autism-Spectrum Quotient (AQ): Evidence from Asperger
syndrome/high-functioning autism, males and females, scientists and mathematicians. Journal of
Autism and Developmental Disorders, 31, 5-17.
Bayliss, A. P., & Kritikos, A. (2011). Brief report: Perceptual load and the autism spectrum in
typically developed individuals. Journal of autism and developmental disorders, 41,
1573-1578.
Brock, J., Xu, J. Y., & Brooks, K. R. (2011). Individual differences in visual search:
relationship to autistic traits, discrimination thresholds, and speed of processing.
Perception, 40, 739-742.
Burack, J. A. (1994). Selective attention deficits in persons with autism: preliminary evidence
of an inefficient attentional lens. J Abnorm Psychol, 103, 535-543.
Cespón, J., Galdo-Álvarez, S., & Díaz, F. (2012). The Simon effect modulates N2cc and LRP
but not the N2pc component. International Journal of Psychophysiology, 84, 120-129.
Cohen, J. (1988). Statistical power analysis for the behavioural sciences (2nd Ed.). Mahwah,
Constantino, J. N., & Todd, R. D. (2003). Autistic traits in the general population: A twin
study. Archives of General Psychiatry, 60, 524 – 530.
Corriveau, I., Fortier-Gauthier, U., Pomerleau, V. J., McDonald, J., Dell'Acqua, R., &
Jolicoeur, P. (2012). Electrophysiological evidence of multitasking impairment of
attentional deployment reflects target-specific processing, not distractor
inhibition. International Journal of Psychophysiology, 86(2), 152-159.
Desimone, R., & Duncan, J. (1995). Neural mechanisms of selective visual attention. Ann.
Rev. Neurosci., 18, 193-222.
Eimer, M. (1996). The N2pc component as an indicator of attentional selectivity.
Electroencephalography and Clinical Neurophysiology, 99, 225-234.
Eimer, M., & Kiss, M. (2010). An electrophysiological measure of access to representations
in visual working memory. Psychophysiology, 47, 197-200.
Gregory, B. L., & Plaisted-Grant, K. C. (2013). The autism-spectrum quotient and visual
search: Shallow and deep autistic endophenotypes. Journal of Autism and
Developmental Disorders, 1-10.
Hickey, C., Di Lollo, V., & McDonald, J. J. (2009). Electrophysiological indices of target and
distractor processing in visual search. Journal of Cognitive Neuroscience, 21,
760-775.
Hoekstra, R.A., Bartels, M., Cath, D.C., & Boomsma, D.I. (2008). Factor structure,
Reliability and Criterion Validity of the Autism-Spectrum Quotient (AQ): A study in
Dutch Population and Patient Groups. Journal of Autism and Developmental
Disorders, 28, 1555-1566.
Hopf, J. M., Luck, S. J., Girelli, M., Hagner, T., Mangun, G. R., Scheich, H., & Heinze, H-J.
(2000). Neural sources of focused attention in visual search. Cerebral Cortex, 10,
Jolicoeur, P., Brisson, B., & Robitaille, N., (2008) Dissociation of the N2pc and sustained
posterior contralateral negativity in a choice response task. Brain Research, 1215,
160-172.
Kiss, M., Van Velzen, J., & Eimer, M. (2008). The N2pc component and its links to attention
shifts and spatially selective visual processing. Psychophysiology, 45, 240-249.
Kiesel, A., Miller, J., Jolicoeur, P., & Brisson, B. (2008). Measurement of ERP latency
differences: A comparison of single participant and jackknife based scoring methods.
Psychophysiology, 45(2), 250-274.
Luck, S. J. (2005). An introduction to the event-related potential technique. Cambridge,
Mass. ; London: MIT.
Luck, S. J., Girelli, M., McDermott, M. T., & Ford, M. A. (1997). Bridging the gap between
monkey neurophysiology and human perception: an ambiguity resolution theory of
visual selective attention. Cognitive Psychology, 33, 64-87.
Luck, S. J., & Hillyard, S. A. (1990). Electrophysiological evidence for parallel and serial
processing during visual search. Perception & Psychophysics, 48, 603-617.
Luck, S. J., & Hillyard, S. A. (1994a). Electrophysiological correlates of feature analysis
during visual search. Psychophysiology, 31, 291-308.
Luck, S. J., & Hillyard, S. A. (1994b). Spatial filtering during visual search: evidence from
human electrophysiology. Journal of Experimental Psychology: Human Perception
and Performance, 20, 1000-1014.
Luck, S.J., Kappenman, E.S., Fuller, R.L, Robinson, B., Summerfelt, A., & Gold, J.M.
(2009). Impaired response selection in schizophrenia: Evidence from the P3 wave and
Luck, S. J., & Kappenman. (2013). ERP components and selective attention. In Luck, S. J &
Kappenman, E. S. (Eds.), The Oxford Handbook of Event Related Potential
Components. Oxford University Press., New York, pp. 295-323.
Mann, T. A., & Walker, P. (2003). Autism and a deficit in broadening the spread of visual
attention. J Child Psychol Psychiatry, 44, 274-284.
Miller, J., Patterson, T., & Ulrich, R. (1998). Jackknife-based method for measuring LRP
onset latency differences. Psychophysiology, 35(01), 99-115.
Milne, E., Dunn, S. A., Freeth, M., & Rosas-Martinez, L. (2013). Visual search performance
is predicted by the degree to which selective attention to features modulates the ERP
between 350 and 600ms. Neuropsychologia, 51, 1109-1118.
Plaisted, K., O'Riordan, M., & Baron-Cohen, S. (1998). Enhanced visual search for a
conjunctive target in autism: A research note. Journal of Child Psychology and
Psychiatry and Allied Disciplines, 39, 777-783.
Rach, S., Diederich, A., & Colonius, H. (2011). On quantifying multisensory interaction
effects in reaction time and detection rate. Psychological Research, 75, 77-94.
Remington, A., Swettenham, J., Campbell, R., & Coleman, M. (2009). Selective attention and
perceptual load in autism spectrum disorder. Psychological Science, 20, 1388-1393.
Remington, A. M., Swettenham, J. G., & Lavie, N. (2012). Lightening the load: Perceptual
load impairs visual detection in typical adults but not in autism. Journal of Abnormal
Psychology, 121, 544-551.
Sawaki, R., & Luck, S. J. (2010). Capture versus suppression of attention by salient
singletons: Electrophysiological evidence for an automatic attend-to-me signal.
Attention, Perception, & Psychophysics, 72(6), 1455-1470.
Sawaki, R., Luck, S.J., & Raymond, J.E. (2015) How attention changes in response to
Woodman, G. F., & Luck, S. J. (1999). Electrophysiological measurement of rapid shifts of
attention during visual search. Nature, 400, 867-869.
Woodman, G. F., & Luck, S. J. (2003). Serial Deployment of Attention During Visual
Search. Journal of Experimental Psychology: Human Perception and Performance,
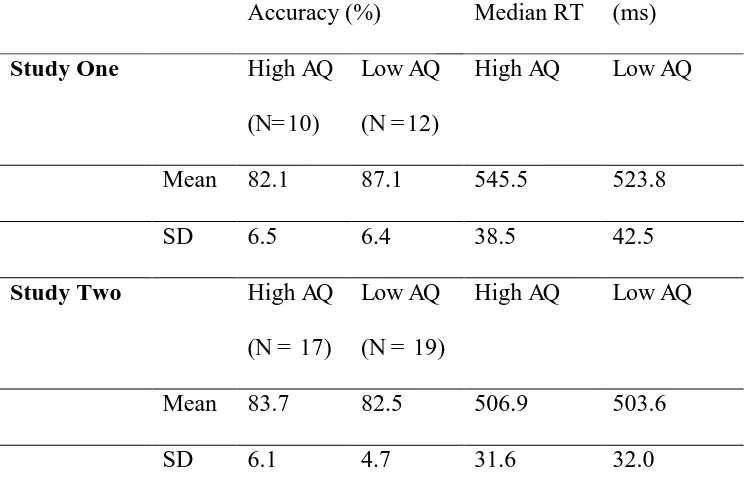
Table 1. Mean and Standard Deviation for Accuracy and Reaction Time Data for high and
low AQ scorers for both study one and two
Accuracy (%) Median RT (ms)
Study One High AQ
(N= 10)
Low AQ
(N = 12)
High AQ Low AQ
Mean 82.1 87.1 545.5 523.8
SD 6.5 6.4 38.5 42.5
Study Two High AQ
(N = 17)
Low AQ
(N = 19)
High AQ Low AQ
Mean 83.7 82.5 506.9 503.6
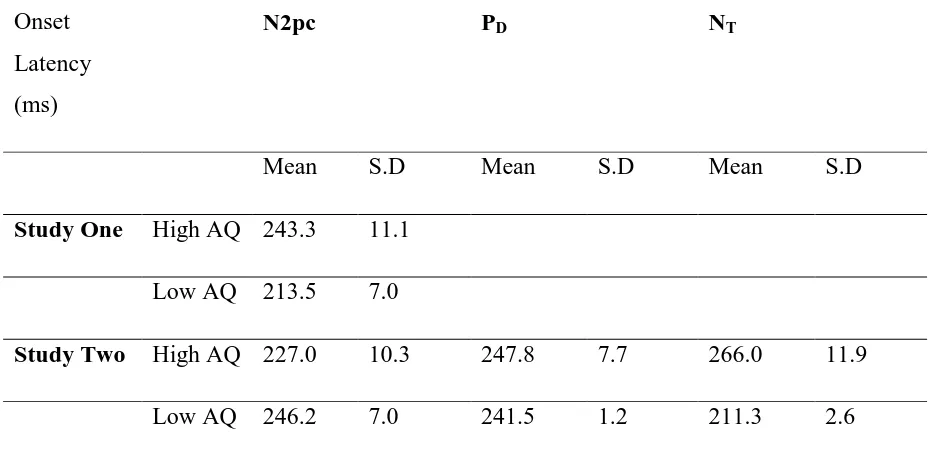
[image:30.595.67.442.138.382.2]Table 2. Mean and standard deviation for onset latency, shown for high and low AQ scorers
for both Study One and Study Two
Onset
Latency
(ms)
N2pc PD NT
Mean S.D Mean S.D Mean S.D
Study One High AQ 243.3 11.1
Low AQ 213.5 7.0
Study Two High AQ 227.0 10.3 247.8 7.7 266.0 11.9