by
N. S. JAYAWARDANE, B.Sc.(Agric.) Ceylon
submitted in partial fulfilment of the requirements for the degree of Doctor of Philosophy
UNIVERSITY OF TASMANIA • HOBART
of material previously published or written by any other person except where due reference is made in the text of the thesis.
N. S. Jayawardane, University of Tasmania,
Hobart.
preparation of the thosAs. Professor N. Collis—George, University of Sydney, and Dr. T. Talsma, C.S.I.R.O. Canberra, assisted me in
extremely valuable discussions. I am most grateful for their guidance and also their comments and suggestions on much of this thesis.
I would like to express my appreciation to Professor C.C. Wade and the Faculty of Agricultural Science for providing the necessary facilities and equipment for my research programme. Special thanks are due to Mr. W. Peterson for his interest and willing cooperation in the design and construction of much of the equipment used in this study. I also wish to thank Mr. A.T. Dunbabin for his assistance in locating and collecting the soils used, Mr. R. Lowry for the computer programmes necessary for processing some of the results and Mrs. S.A. Jones for typing the thesis. To all my colleagues in the Faculty of Agricultural Science I extend my thanks for an enjoyable stay in Tasmania.
-
ACKNOWLEDGEMENTS SUMMARY
I. INTRODUCTION 1
II. REVIEW OF LITERATURE 4
A. Factors affecting the salinisation of soils from a
saline water table 4
B. Steady upward flow from a water table in soils 11
C. Movement of salts in soils 17
D. Salt solution composition parameters 19 E. Effect of salt solutions on swelling of clays in soils 20 F. Effect of salt solutions on hydraulic conductivity of
soils 23
III. MATERIALS AND EXPERIMENTAL METHODS 35
A. Soil materials 35
B. Preparation of soils and salt solutions 35 C. Physical and chemical characteristics of the soil,
materials 36
D. Moisture release curves of soils for salt solutions 37 E. Saturated conductivity of soils for salt solutions 40 F. Unsaturated conductivity of soils at high pressure
heads for salt solutions 43
G. Moisture release curves and unsaturated conductivity
of soils at low pressure heads for salt solutions 47 H. Rates of evaporation from soils with water tables of
different salt solution composition 50
IV. RESULTS AND DISCUSSION 53
A. Physical and chemical characteristics of soils 53 B. Effect of salt solution composition on moisture
release curves of the soils 55
(i) Moisture release curves 55
(ii) Changes in volumes of pores of specific size
ranges 72
(i) Changes in saturated conductivities 94
(ii) Equivalent salt solutions 104
D. Effect of salt solution composition on unsaturated
conductivity of soils 111
(i) Changes in unsaturated conductivities 111
(ii) Equivalent salt solutions 119
(iii)Computed unsaturated conductivities 120 E. Effect of salt solution composition on upward flow of
solutions from a water table 123
(i) Computed pressure head profiles 123
(ii) Critical ranges 133
(iii)Comparison of computed and measured rates of
upward flow 136
(iv) Applications to field studies and areas for
future studies. 146
V. CONCLUSIONS 150
VI. REFERENCES 153
Table 1. Methods available for computing pressure head profiles -
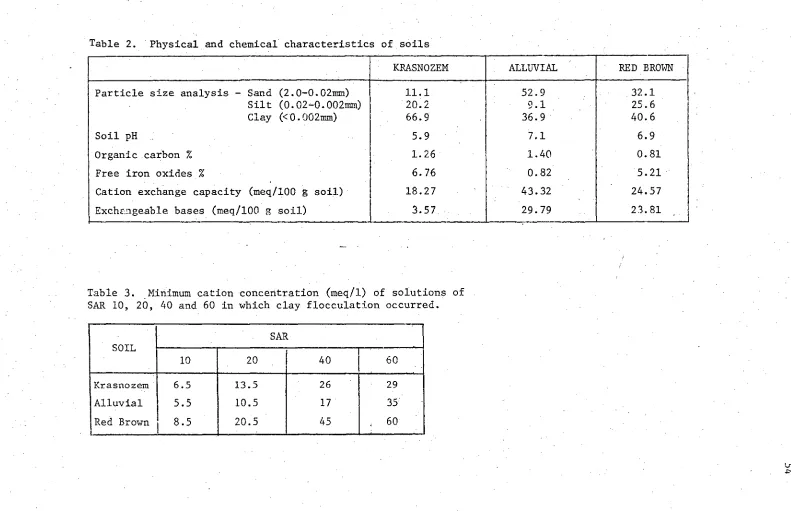
during steady upward flow from a water table. 13 Table 2. Physical and chemical characteristics Of soils. 54 Table 3. Minimum cation concentration (meq/1) of solutions of
SAR 10, 20, 40 and 60 in which clay flocculation occurred. • 54 Table 4. Radii of necks of common pore (mm) in krasnozem,
alluvial and red brown soils packed to bulk densities of approximately 0.87, 1.01 and 1.05 g/cm 3 respectively, for different salt solutions.
Table 5.. Pore size indices of krasnozem, alluvial and red brown soils, packed to bulk densities of approximately 0.87,
1.01 and 1.05 g/cm 3 respectively, for different salt solutions. , Table 6. Moisture release data of alluvial soil for salt solutions of SAR 40, 20 and 10 and different cation
concentrations.
, Table 7. Moisture release data .of red brown soil for salt
solutions of SAR 40, 20 and 10 and different cation concentrations. 83 Table 8. Relative volumes of pores of specific diameter
ranges in alluvial soil in different salt solutions.
Table 9. Relative volumes of pores of specific diameter ranges in red brown soil in different salt solutions. Table 10. The average saturated conductivity (cm/day) of krasnozem, alluvial and red brown soils packed to bulk
densities of 1.00, 1.13 and 1.22 g/cm 3 respectively, for salt solutions of SAR 40, 20 and 10 and different cation
concentrations.
Table 11. Relative experimental and computed saturated conductivities of alluvial soil for different salt solutions. • Table 12. . Relative experimental and computed saturated
conductivities of red brown soil for different salt solutions. Table 13. The average experimental saturated conductivities of alluvial sail for salt solutions of SAR 40, 20 and 10 and different cation concentrations.
Table 14. Values of the matching factor at different pressure heads in krasnozem, alluvial and red brown soils for salt
solutions of SAR 20 and different cation concentrations.
Table 15. Relative computed and experimental rates of upward flow from specific depths to water table in alluvial soil with reduction in.cation concentration of groundwater of SAR 20. Table 16. Relative computed and experimental rates of upward flow from specific depths to water table in red brown soil with reduction in cation concentration of groundwater of SAR 20. ,
n
c
uREs
Page Fig. 1. The processes and factors affecting the rate of salinisation
of soils from a saline water table based on the isothermal, steady
flow—model. 10
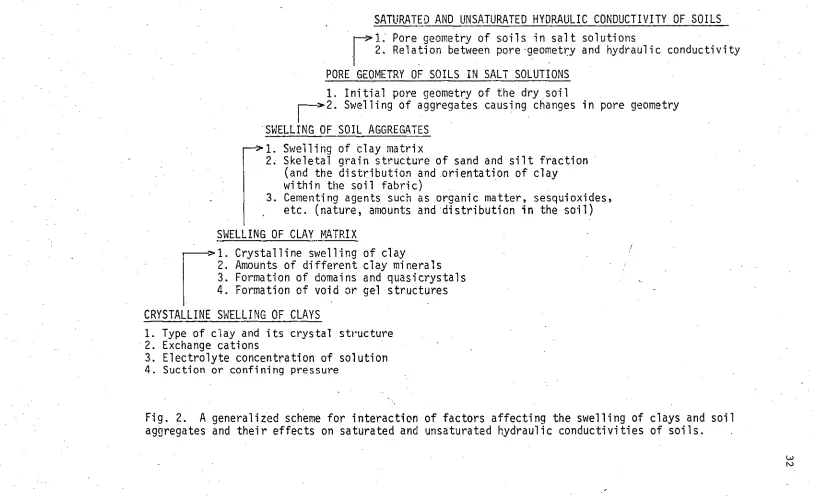
Fig. 2. A generalized scheme for interaction of factors affecting the swelling of clays and soil aggregates and their effects on saturated
and unsaturated hydraulic conductivities of soils. 32 Fig. 3. Modified Haines apparatus for measuring the moisture release
curve's of soils in salt solutions. 38
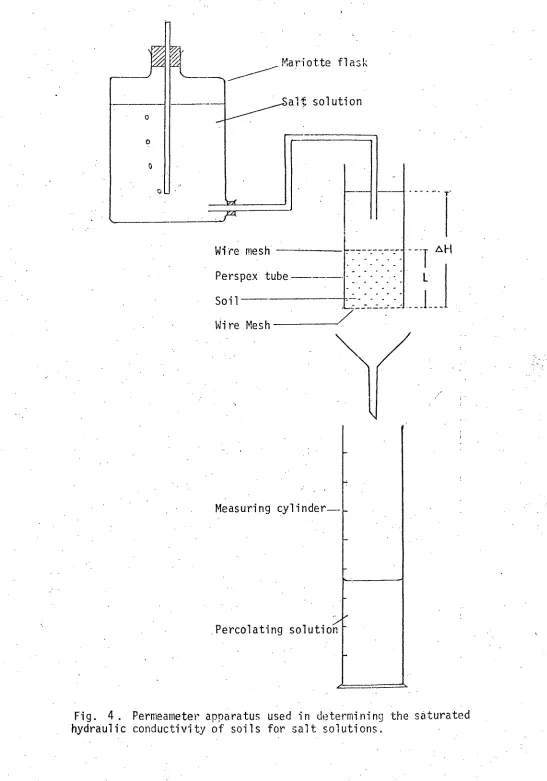
Fig. 4, PermeaMeter apparatus used in determining the saturated
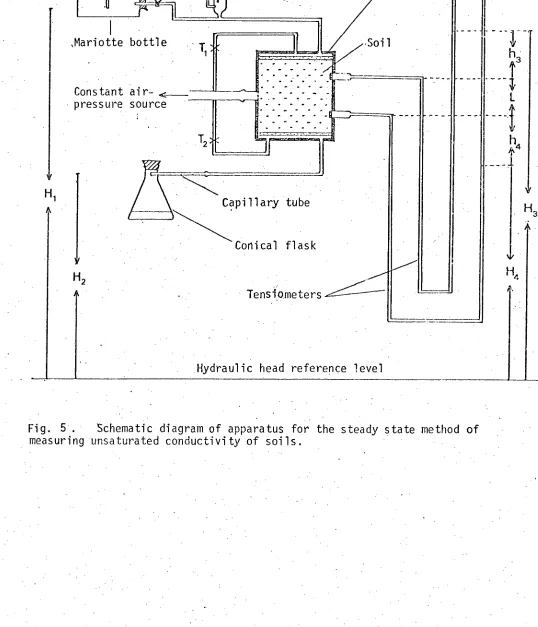
hydraulic conductivity of soils for salt solutions. 41 Fig. 5. Schematic diagram of apparatus for the steady-state method of
measuring unsaturated conductivity of soils. 44
Fig. 6. Pressure cell assembly used in determining unsaturated
conductivity of soils. 45
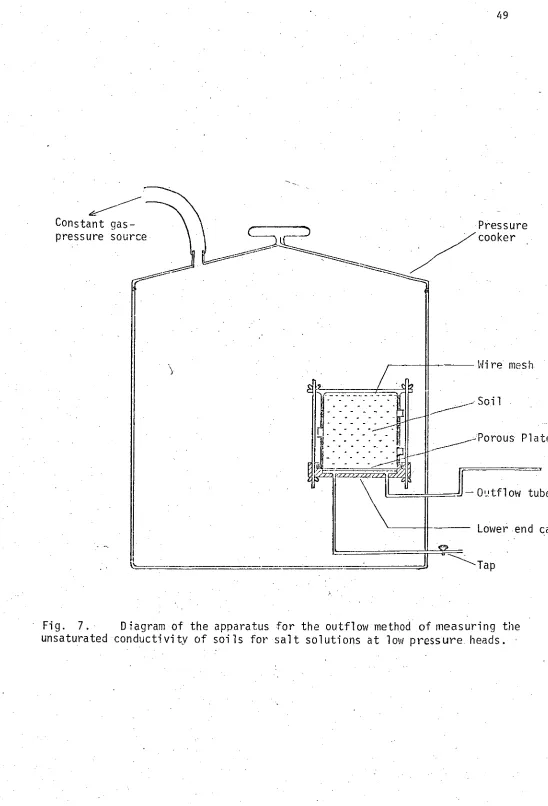
Fig. 7. Diagram of the apparatus for the outflow method of measuring the unsaturated conductivity of soils for salt solutions at low pressure
heads. 49
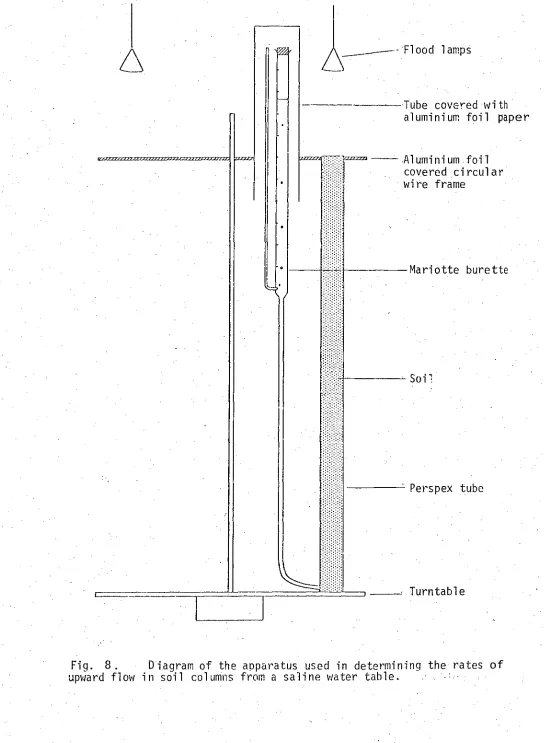
Fig. 8. Diagram of the apparatus used in determining the rates of
upward flow in soil columns from a saline water table. 51 Fig. 9. Moisture release curves of krasnozem soil for salt solutions
of SAR 0 and cation concentrations (meq/1); 160, 2.5. 56 Fig. 10. Moisture release curves of krasnozem soil for salt solutions of SAR 20 and cation concentrations (meq/1); 160,2.5. 57 Fig. 11. Moisture release curves of krasnozem soil for salt solutions of SAR 40 and cation concentrations (meq/1); 640, 2.5. 58 Fig. 12. Moisture release curves of alluvial soil for salt solutions
of SAR 0 and cation concentrations (meq/1); 160, 10, 2.5. 59 Fig. 13. Moisture release curves of alluvial soil for salt solutions
of SAR 10 and cation concentrations (meq/1); 160, 40, 10, 2.5. 60 Fig. 14. Moisture release curves of alluvial soil for salt solutions
of SAR 20 and cation concentrations (meq/1); 160, 40, 10, 2.5. 61 Fig. 15. Moisture release curves of alluvial soil for salt solutions
Page
Fig. 17. Moisture release curves of red brown soil for salt solutions of SAR 10 and cation coneentr3tions (meq/1); 160, 40, 10, 2.5. 64 Fig. 18. Moisture release curves of red brown soil for salt solutions of SAR 20 and cation concentrations . (meq/1); 160, 40, 10, 2.5. 65
Fig. 19.. Moisture release curves of red brown soil for salt solutions of SAR 40 and cation concentrations Oneq/1); 640, 160, 40, 10. 66 Fig. 20. Undrained porosity at specific pressure heads of 10, 20, 30, 40, 50, and 60 cm of water in alluvial soil for salt solutions of SAR 10 and different cation concentrations. 73 Fig. 21. Undrained porosity at specific pressure heads of 10, 20, 30, 40, 50, and 60 cm of water in alluvial soil for salt solutions of SAR
20 and different cation concentrations. 74 Fig. 22. Undrained porosity at specific pressure heads of 10, 20, 30, 40, 50, and 60 cm of water in alluvial soil for salt solutions of SAR 40 and different cation concentrations. 75 Fig. 23. Undrained porosity at specific pressure heads of 10, 20, 30, 40, 50, and 60 cm of water in red brown soil for salt solutions of SAR 10 and different cation concentrations. 76 Fig. 24. Undrhined porosity at specific pressure heads of 10, 20, 30, 40, 50, and 60 cm of water in red brown soil for salt solutions of SAR
20 and different cation concentrations. 77
Fig. 25. Undrained porosity at specific pressure heads of 10, 20, 30, 40, 50, and 60 cm of water in red brown soil for salt solutions of SAR
.40 and different cation concentrations. 78
Fig. 26. Pore size indices of alluvial soil for salt solutions of SAR 40, 20, 10 and different cation concentrations. 90 Fig. 27. Pore size indices of red brown soil for salt solutions of SAR 40, 20, 10 and different cation concentrations. 91 Fig.(28. Equivalent salt solutions for swelling and for saturated
hydraulic conductivity in alluvial soil. 92
Fig. 29. Equivalent salt solutions for swelling and for saturated
hydraulic conductivity in red brown soil. 93
Fig. 30. Adjusted average experimental and predicted saturated
comluctivity of alluvial soil for different salt solutions. 97 Fig. 31. Adjusted average experimental and predicted saturated
Page Fig. 32. Adjusted average experimental and predicted saturated
conductivity of alluvial soil for different salt solutions. 109 Fig. 33. Unsaturated conductivity-pressure head curves of krasnozem soil for salt solutions of SAR 20 and cation concentrations (meg/1);
160, 2.5. 113 Fig. 34. Unsaturated conductivity-pressure head curves of alluvial
soil for salt solutions of SAR 20 and cation concentrations (meg/1);
' 160, 40, 10. 114
Fig. 35. Unsaturated conductivity-pressure head curves of red brown soil for salt solutions of SAR 20 and cation concentrations (meg/1);
160, 40, 10. 115
Fig. 36; Unsaturated conductivity-pressure head curves of red brown soil for 'salt solutions of SAPS 40 and cation concentrations (meg/1);
80, 40, and SAR 20 and cation concentration (meg/1); 160. 116 Fig. 37. Computed pressure-head depth curves above a water table in
krasnozem soil with groundwater salt composition of SAR 20 and cation concentration 160 meg/1, for upward flow rates (cm/day); 0.01, 0.05,
0.1, 0.3, 0.5, 1.0. 125 Fig. 38. Computed pressure head-depth curves above a water table in
krasnozem soil with groundwater salt composition of SAR 20 and cation concentration 2.5 meg/1, for upward flow rates (cm/day); 0.01, 0.05,
0.1, 0.3, 0.5, 1.0. 126 Fig. 39. Computed pressure head-depth curves above a water table in
alluvial soil with groundwater salt composition of SAR 20 and cation concentration 160 meg/1, for upward flow rates (cm/day); 0.01, 0.05,
0.1, 0.3, 0.5, 1.0. 127 Fig. 40. Computed pressure head-depth curves above a water table in
. alluvial soil with groundwater salt composition of SAR 20 and cation concentration 40 meg/1, for upward flow rates (cm/day); 0.01, 0.05, 0.1, 0.3, 0.5, 1.0.
Fig. 41. Computed pressure head-depth curves above a water table in alluvial soil with groundwater salt composition of SAR 20 and cation concentration 10 meg/1, for upward flow rates (cm/day); 0.01, 0.05, 0.1, 0.3, 0.5, 1.0.
Fig.'42. Computed pressure head-depth curves above a water table in red brown soil With groundwater salt composition of SAR 20 and cation concentration 160 meg/1, for upward flow rates (cm/day); 0.01, 0.05,
0.1, 0.3, 0.5, 1.0. 130 Fig. 43. Computed pressure head-depth curves above a water table in
red brown soil with groundwater salt composition of SAR 20 and cation concentration 40 meg/1, for upward flow rates (cm/day); 0.01, 0.05,
0.1, 0.3, 0.5, 1.0. . 131
128
concentration 10 meq/1, for upward flow rates (cm/day); C.01, 0.05,
0.1, 0.3, 0.5,, 1.0. 132
Fig. 45. The computed and experimental rates of upward flow in krasnozem soil from different depths to water table's with groundwater salt
composition of SAR 20 and cation concentrations of 160 and 2.5 meq/1.
138 Fig. 46. The computed rates of upward flow in alluvial soil from
different depths to water tables with groundwater salt composition
[image:10.557.32.542.245.817.2]of SAR 20 and cation concentration (=q/1); 160, 40, 10, 139 Fig. 47. The experimental rates of upward flow in alluvial soil from
different depths to water tables with groundwater salt compositiOn of
SAR 20 and cation concentrations (meq/1); 160, 40, 10. 140
Fig. 48. The computed rates of upward flow in Ted brown soil from different depths to water tables with groundwater salt composition
of SAR 20 and cation concentrations (meq/1); 160, 40,. 10. 141 Fig. 49. The experimental rates of upward flow in red brown soil
from different depths to water tables with groundwater salt
SUMMARY
The rate of salinisation of soils from a water table has been shown to be related to the concentration of salts in groundwaters and the rate of upward flow of saline groundwater. The maximum rate at which soil can transmit soil solution from a water table
to the surface is governed by hydraulic conductivity characteristics and depth to water table. In the present study the effects of
chemical composition of groundwaters on the rate of salinisation of three different soils by upward flow were evaluated in soil columns. These effects were related to changes in pore geometry and hydraulic conductivity characteristics of the soils in salt solutions.
The pore geometry, saturated and unsaturated conductivity, and the capacity of the soil to transmit soil solution from a water table to the surface varied little in krasnozem soil
exposed to different salt solutions, but marked changes of different magnitudes occurred in the case of alluvial and red brown soils.
With a reduction in cation concentration of salt solution at a given SAR, the inter-aggregate pores of alluvial and red brown soils decreased in size, apparently due to swelling of soil aggregates. The extent of this decrease in pore sizes was greater for solutions of higher SAR. A pore size index was
proposed to evaluate quantitatively these changes in pore geometry. Patterns in the volume changes of different sized pores with
The saturated and unsaturated conductivity at high pressure heads of alluvial and red brown soils decreased markedly with
reduction in cation ccncentration at a given SAR, uhile unsaturated conductivity at low pressure heads showed only small decreases.
Existing methods for computing hydraulic conductivities from moisture release curves could not accurately predict the
conductivities at saturation and high pressure heads in different salt solutions. It was suggested that the discrepancy was partly due to changes in internal pore geometry during desaturation as a result of aggregate shrinkage. These changes were described qualitatively in terms of a theoretical model.
A concept of equivalent salt solutions was also developed and used to predict, fairly closely, the hydraulic conductivities of the soils in different salt solutions. It is proposed that this method could be used to correlate directly flow of different salt solutions in soils under specific boundary conditions.
The computed maximum depths to water table for specific rates of upward flow in alluvial and red brown soils decreased as the cation concentration was reduced at a given SAR. However, marked decreases in maximum depths to water table for specific rates of flow occurred only with solutions of low cation concentration, in the presence of which the values of unsaturated conductivity within a critical range showed marked decreases. This critical range was defined using the •data from a flux/unsaturated conductivity ratio method of computing
upward flow. The changes in measured rates of upward flow, AS the •cation concentration was reduced at a given SAR, were generally
similar in nature to the changes in computed rates. The application of these results and concepts to field problems and areas for future
..INTRODUCTION
Salinisation of soils by the intrusion of salts and the resultant loss in productivity especially in irrigai_ed lands has been a problem confronting farmers from ancient times and
it is a potential hazard in modern irrigation schemes. Capillary rise from saline water tables is one of the processes causing salinisation of agricultural lands and studies to determine the rate of upward flow in soils from water tables at different depths are necessary in designing drainage and agronomic practises for control of salinity.
The movement of salts from saline water tables into the soil above takes place primarily by •convection in the upward flow of salt solutions. Thus the rate of salinisation is closely related to the concentration of salts in groundwaters and the rate of upward flow of groundwater, which equals the rate of evaporation under steady flow conditions. Several workers have demonstrated that the rate of evaporation can be limited either by the
atmospheric evaporative conditions or the maximum rate at which soils can transmit water to the surface, whichever is less. Previous studies also show that except for shallow depths to water table or humid conditions, the evaporation rate is usually controlled by the capacity of the soil to transmit water to the surface which in turn is governed by the hydraulic conductivity characteristics of the soil and the depth to the water table. Hydrological analysis yields the rates of salinisation of a
characteristics of some soils and thus alter the crIpacity of these soils to transmit soil solution. This would result in changes in
-
the rate of salinisation of soils from a water table. The magnitude of such changes in the rate of salinisation is likely
to vary in different soils. The present study attempts to evaluate the effects of salt composition of groundwaters on the rate of salinisation of different soils, and to relate these effects to changes in the pore geometry and conductivity
characteristics of these soils in the presence of different salt solutions.
Thus the objectives of the present study are:
(a) to investigate changes in saturated and unsaturated hydraulic conductivities of soils for salt solutions of increasing sodium absorption ratio arid decreasing cation concentration;
(b) to assess the effects of salt solution composition on the pore geometry of different soils, to relate these changes to saturated and unsaturated conducEivities in different salt solutions and to evaluate methods for computing unsaturated conductivities from the moisture release curves of the soils in the presence of the same salt solutions;
(c) to compute the rate of steady upward flaw of salt solutions in soils from groundwaters of different chemical composition using the unsaturated coneactivity-pressure head curves Of the soils for the same salt solutions and to verify these results experimentally, and
A. Factors affecting the Salinisation of Soils from a Saline Water Table
The decline in productivity of some ancient and recent irrigation schemes has been attributed, at least partly, to secondary salinisation by capillary rise from saline water tables. A number of early studies in the field have shown that the depth to the water table is an
important factor determining the extent of salinisation of soils and that deep drainage is necessary to control salinity by lowering the water table. Burgess (1928) found that in fine grained saline and
alkali soils in Arizona, U.S.A., the water table had to be lowered to a depth of 240 to 300 cm to prevent salinisation. Field studies have shown that severe salinisation occurred in alluvial soils in Western Australia (Teakle and Burvill, 1945), soils in the Nile Delta
(Schoonover et al., 1957), and alluvial soils of the Hawkesbury River floodplain near Sydney, Australia (Collis-George and Evans, 1964) where the depth to the water table was less than 150 to 180 cm, 60 cm and 75 cm respectively.
Polynov (1930) defined the critical depth as "the maximum height above the water table to which salt contained in the groundwater can rise under natural conditions by capillary rise and diffusion". In a detailed review of early studies in the U.S.S.R., and eastern Europe to determine critical depths, Talsma (1963) recognized three groups as follows: (i) field and lysimeter experiments on salinisation of cropped lands (Sukhachev, 1958; Legostaev, 1958); (ii) studies showing the
evapotranspiration (Kabaev, 1958; Legostaev, 1958; Kovda, 1961). These studies showed that as the depth to water table increased the rate of salinisation of the soil decreased. It was also found that the critical depth corresponded approximately to an upward flow rate of 0.1 cm/day and that the critical depth to water table varied widely according to the soil and other site characteristics
(Suchachev, 1958; Florea and Stoica, 1958; Kovda, 1961).
The importance of soil texture in modifying the critical depth to the water table was shown by the studies of Jackson et al. (1956), which indicated that the rate of salinisation of a sandy soil
decreased sharply when the water table depth was more than 90 to 120 cm, while for clayey soil at the same location the critical depth was much greater. On the other hand Volobuev (1946) found that the presence of a saline water table at depths less than 120 to 130 cm in a clay soil and less than 130 to 150 cm in a loamy soil led to salinisation. Groenewegen (1959) showed that salt accumulation in surface layers was small in clay soils of very low permeability and increased in loamy soils with higher permeability, but with a further increase in permeability of the soils there appeared
to be a decrease in rate of salt accumulation in the surface layers. These studies and results obtained by other workers (Krimgold, 1945;
Ravikovitch and Bidner—Bar Hava,1948) indicated that soils of intermediate texture were more liable to salt accumulation (Talsma, 1963) than
the critical depths for lucerne on stratified and uniform soils . were 100 cm and 200 to 240 cm respectively, while for cotton the
critical depths for stratified and non-stratified soils were 150 to 180 cm and 280 cm respectively.
An increase in concentration of salts in the groundwater would be expected to lead to a proportionate increase in rate of salt accumulation at the surface, provided that the rate of upward flow of solution was not affected by this change In salt concentration. Kovda (1961) found that when the salt concentration was 1.0 - 1.5% the critical depth to water table was generally around 200 to 250 cm, but if the salt concentration was 0.2-0.3% in groundwaters of the chloride-sulphate type and 0.07-0.1% in groundwater containing alkali (HCO -3) the extent of salinisation was generally very low. The capillary rise of different salt solutions in soil columns from a water table has also been studied (Krupkin, 1963; Szabolcs ancrLestak, 1967). These studies showed that while 0.1 N solutions of NaCl,
MgC1 2 and Na 2 SO 4 rose to considerable heights, 0.1 N Na 2 CO3 solution rose only to a limited height above the water table. This was
attributed to enhanced clay dispersion at the bottom of the column
in the presence of the Na 2 CO 3 solution. However, the specific effects of changes in salt solution composition and salt concentration of
groundwater on the rate of upward flow and on salinisation of soils seem to have received little attention.
Field studies have shown that vegetation could affect the rate of salinisation from a water table, possibly by changing the moisture distribution pattern within the rooting zone. Verhoeven (1953),
Talsma (1963) and Sandoval and Benz (1973) showed that removal of vegetation in soils with a deep water table led to a decrease in
the rate of salinisation apparently due to the formation of a dry surface mulch and also due to prevention of moisture withdrawal by crops from the rooting zone. The latter workers also found that in a site with a shallow water table, a soil in which a mulch was created by ploughing in the stubble was salinised almost to the same extent as a bare soil. This was attributed to the difficulty of maintaining a soil mulch by cultivation under the wet conditions and also to less efficient leaching due to the high water table. Hamilton (1972) found that establishing salt tolerant vegetation reduced the extent of salinisation of the surface 30 cm layer in soils with a saline water table, although the specific reasons for these reductions in rate of salinisation were not evaluated. Leo (1963) showed that root systems tended to accelerate salt water movement to the root zones, while fallowed soils tended to accumulate salt near the soil surface.
Studies in the field (Benz et al., 1967; Wiegend et a/., 1968; Sandoval.and Benz, 1973) have shown that mulches could reduce the rate of salinisation of soils from a saline water table by reducing the • evaporation rate and by maintaining the soil in a moist condition
so that even a moderate rainfall could leach the salts from the surface layers.
Salinisation of lands from saline water tables he,:l been found to be a greater problem in drier areas, apparently due to higher • evaporative conditions, lower annual leaching of salts and higher
create temperature gradients in the soil profile which may induce some salt transport to the surface layers (Durand, 1956; Gurr et al., 1952) it has been suggested that this is not an important factor in salinisation of irrigated lands (de :Vries, 1958). On the other hand Talsra (J963) found that in sites where the rate of upward flow was low, high atmospheric temperatures could cause excessive drying of the surface leading to the formation of a soil mulch, which then reduced the rate of upward flow from the saline water table.
Thus the early studies showed that the rate of salinisation of soils was affected by factors such as depth to water table, soil profile characteristics, salt concentration of the groundwater, climate and vegetation. However, the relative importance of these factors appeared to vary in different locations and the nature of their interaction was not clearly defined until Philip (1957) and Gardner (1958) proposed methods for computing upward flow in soils from a water table, based on an isothermal steady flow model. Their studies also showed that upward flow from a water table was limited either by the capacity of the soil to transmit water to the surfacer governed by the depth to the water table and the hydraulic
conductivity properties of the soil, or by the external evaporative •conditions, whichever was less. Talsma (1963) in a study of salinity
in soils of the Murrumbigee Irrigation Area, in Australia, used a hydrological approach to compute the potential rate of upward flow of saline groundwaters in different soils. He combined these results with data for the maximum rates of evaporation possible under the
experimentally determined rates of salt accumulation at the surface was obtained. Talsma also found that the critical depth corresponded
to an upward flow rate of 0.1 - cm/day. This rate being smaller than the potential evaporation rate of any of the seasons, was conducive to the formation of a soil mulch at the surface, thus restricting upward flow.
The principle processes and factors which affect the upward flaw of water and salts from a water table and their interactions • are illustrated in Figure 1. Field cultural and cropping practices
could modify the rate of salinisation of soils due to upward flow from a water table by changing one or more of the factors which affect this upward flow. While many field trials have been carried out to assess the changes in the rate of salinisation of soils due to the use of different agronomic practices, the evaluation of the basic causes responsible for these changes usually requires
solution from a water table in the saline groundwater
Upward flow equals the
lesser of these two limiting
processes
I
External evaporativity
conditions
Radiant Energy
Wind
Relative humidity
Surface cover, vegetation
PROCESSES LIMITING RATE
OF UPWARD FLOW
FACTORS AFFECTING THE
RATE OF SALINISATION
OF SOILS FROM A WATER
TABLE
FIELD CULTURAL PRACTICES
LIKELY TO ALTER THE FACTORS
AFFECTING THE RATE OF
SALINISATION OF SOILS
Capacity of the soil to transmit water
from a water table to the surface
i.
Depth to water table
Hydraulic properties of the soil
Depths and hydraulic properties of
cip soil profile layers (layered soil)
Chemical composition of groundwater
Rooting depth of vegetation
Depth of mulching
Crop
,
rotation, fallowing, mulching, etc.
Tillage
Irrigation and drainage methods
King (1899) and Shaw and Smith (1927) found in studies in soil columns that as the depth to the water table was inc -2eased, the rate of upward flow decreased. The latter workers also found that there was no measurable upward flow of water in Yolo loam and Yolo sandy loam soil columns when the water table was at a depth exceeding 300 cm. Moore (1939) was the first to measure both the moisture content and pressure head distribution between the water table and the evaporating surface during steady upward flow.
The isothermal,steady, upward flow of water from a water table to the soil surface is given by,
dh
q = -k(h)(—
dz + 1)where q is the flux, k(h) is the unsaturated conductivity, h is the pressure head and z is the depth to the water table, with the
vertical coordinate taken as positive upwards. Separating the variables and integrating,
-z = Ih 1 + q/k(h) 1 dh -cc
1 .dh -z max. =I 1
+ q/k(h)
It has been shown that if the relationship between the pressure head and unsaturated conductivity is known equation(1) can be solved either by numerical methods (Philip, 1957) or by analytical methods where unsaturated conductivity-pressure head curves can be
represented by certain empirical equations (Wind, 1955; Gardner, 1958), to obtain pressure head-depth curves for different rates of upward flow. A number of different empirical equations have
subsequently been proposed by different workers to represent
The use of these equations has been reviewed in detail by Raats and Gardner (1971, 1974) and grouped into six basic models. The equations were expressed in dimensionless form in order to permit meaningful
comparisons between the models. Further details of these models are given in Table 1. Another method for solving equation (1) using the flux/unsaturated conductivity ratio (Jayawardane, 1977) was developed during the present study (Appendix A).
Computed pressure head-depth curves indicate that suction shows a very gradual increase with height above the water table until just below the surface where it increases very rapidly (Gardner, 1960). When evaporation is limited by external conditions the suction at
the soil surface is relatively low and only a small increase of this suction is required to markedly increase the evaporation rate.
However, as the suction at the soil surface is further increased, the evaporation rate soon reaches a limiting value which cannot be exceeded however high the potential evaporation rate (Gardner, 1958, 1960). This maximum rate of evaporation is determined by the depth to water table and the hydraulic conductivity properties of the soil. Thus the rate of evaporation is limited by the external potential evaporation or the capacity of the soil to move water to the surface, whichever is less. The rate of evaporation is usually limited by the ability of the soil to move water to the surface, except under humid conditions or where a water table occurs at shallow depth.
Gardner (1958) also showed that for •unsaturated conductivity- pressure head curves conforming to model E (Table 1), provided that the
saturated conductivity/flux ratio is much greater than ten, the maximum rate of upward flow, o
ax, from a water table at a depth, z, is given by, 'm
Model
• Methods Author head, h equation for
unsaturated conductivity
Advantages and Disadvantages
. ANALYTICAL METHODS
•
A -
B C D E AE F
Green and Ampt (1911)
Richards (1931)
Gardner (1958) Rijtema (1965)
Gardner (1958) Raats and Gardner
(1971)
Whisler
(1969)
Wind (1955) Brooks and Corey(1964) .11 1 1.1 2 <h 2 40 ?.1.1 3 0 3 • 4. 0 <0 >II 4 <h 4 K 0 K(1-h/h ) 2 0 K exp Oth
K
K exp f3(h-h 3 )
a(S
n
+b)
-1
K[(h/h 11K )n+1]-1K
K(h/h
4
)
1. Simplifies computations of upward flow and provides insights into physical aspects of flow.
2. Can be used only for k-h curves which fit one of the many 2 or 3 parameter equations proposed.
. NUMERICAL METHOD
•
Philip (1957) 1. Can be used to compute upward flow
accurately from any complex k-h curve. 2. Does not provide physical insights
textured soils have values of 4 or greater. Cisler (1969) showed that the value of A
n in the above equation was given by (n/Tr sin Trin) -n for both integer and non-integer values of n. In the case of all
models in Table 1, except A and B, for any depth of water table, there is a maximum upward flux which approaches zero asymptotically
as the depth to the water table becomes greater (Raats and Gardner, 1974). It has been pointed out that these small fluxes may represent an
important salinity hazard (Gardner, 1960).
Philip (1957) and Gardner (1958) also extended their analysis to consider the contribution of vapour movement to the rate of evaporation under steady flow conditions. Where the external
evaporative demand is greater than the maximum upward flow the soil near the surface dries and within this zone water movement is
entirely in the vapour phase while below this zone water movement is in the liquid phase. Gardner (1958) also showed that although movement in the vapour phase would tend to increase the rate of evaporation, the contribution of vapour movement to evaporation would be relatively small and is usually much less than 20 per cent.
A number of studies in the field (Wind, 1955; Visser, 1959; Talsma, 1963) and in soil columns (Gardner and Fireman, 1958: Willis,
1960) have indicated that the theoretical computations of upward flow from water tables based on the isothermal steady flow model show close agreement with the experimentally determined evaporation
rates in their soils. However, Schleusener and Corey (1959) and King and Schleusener (1961) found that the evaporation rate decreased as the
evaporation rate undor high external evaporative conditions octurred even though the soil surface was drying monotonically, they suggested that this decrease in evaporation rate could not be attributed to hysteresis. Further, as these decreases occurred under very high external evaporative conditions, (which were
much higher than those normally existing under field conditions), it is possible that a downward heat flux (Philip, 1957) could have caused reductions in the evaporation rate. Philip (1957) showed that while temperature gradients had little effect on evaporation from moist soils, these gradients could affect the rate of evaporation as the soils became very dry. Gardner
[image:27.558.16.558.163.806.2](1958) showed that the presence of a surface mulch would lead to a decrease in the rate of evaporation in soils with a water table and that this decrease was proportional to the depth of the mulch.
The hydrology of highly colloidal soils, which show changes in their bulk volumes during wetting and drying, has been described by Philip (1969a, 1). In such soils the total potential includes a component of overburden potential in addition to the moisture and gravitational potentials.
layer over a loam layer increased, while increasing the depth of the loam layer over the sand decreased the upward flow. On the contrary, it has been shown by other workers (Nadas and Hillel, 1972; Varallyay, 1974) that increasing the depth of the finer textured layer at the surface increased the rate of upward flow while the increase in depth of the coarser textured layer at the
surface decreased the rate of upward flow. Willis (1960) and Hadas and Hillel (1972) found the experimentally determined rates of evaporation in layered soil columns were less than the computed values and it was suggested by the latter authors that this could be due to interlayer resistance in these artificially packed soil columns. Hamilton (1974) found good agreement between computed and measured rates of upward flow in a layered field soil. The large differences in capacities of different soils to transmit water to the surface from water tables at specific depths is due to wide differences in the unsaturated conductivity— pressure head curves of the soils or of the soil layers in
stratified soils.
• If the presence of different salt solutions causes changes in the hydraulic conductivity properties of a given soil,
this could be expected to lead to changes in the ability of the soil to transmit solutions from the water table to the • surface. The magnitude of these changes in upward flow would
The two main processes causing salt movement in soils are convection of dissolved salts with the mass flow-of soil solution and molecular diffusion due to concentration gradients (Gardner, 1965; Peck, 1971; Boast, 1973).
Movement of salt by molecular diffusion takes place from zones of higher salt concentration towards zones of lower salt concentration. The rate of diffusion is approximately proportional to the difference in concentration. However, molecular diffusion in soils is a very slow process. For instance, Peck (1971) showed that molecular diffusion would move more salt than would convection only where the soil solution flow was less than 10-9m/sec.
During salt movement by convection, the macroscopic rate of movement of salt is equal to the product of the macroscopic rat:: of movement of soil water and the concentration of salt in that soil water. However, the bulk movement of the soil solution is made up of many different microscopic rates of flow. Thus there is a faster rate of flow in the larger pores and also a faster rate of flow ia
the centre of individual pores than near the pore walls which results in a dispersion of salt in the soil. This process is referred to as hydrodynamic dispersion. In soils where there is a net movement of
soil solution, convection could interact with hydrodynamic C
dispersion to enhance the diffusion process (Gardner, 1965). Other processes of lesser importance affecting salt movement in soils
include salt seiving (Kemper, 1960; Krupp et al., 1972), absorption into the exchange complex resulting in less rapid transport of
per cent of the upward movement of salt. Gardner (1965) in reviewing the data from earlier studies concluded that downward diffusion was not sufficiently rapid to carry nitrate more than a few inches below the point where the evaporation was occurring. A number of studies of the extent of salt accumulation near an
evaporating surface in conjunction with upward movement of the soil solution have found good correlation between calculated rates of salt accumulation in the surface layers, assuming convection is the main factor and ignoring the effects of molecular diffusion, and measured rates of salt accumulation (Richards et al., 1956; Talsma,
1963).
During the movement of salt solutions through soils, changes could occur in both chemical composition and salt concentration. As soil. solution evaporates at or near the soil surface salt accumulation leads to concentration of soil solution near the evaporating zone until the solubility limits of the salts are reached. Varallyay (1968) showed diagrammatically the changes in composition of groundwater as it moved from the water table to the soil surface in the Danube Valley area. The concentration of soil solution as it moved to the surface resulted in a precipitation of salts in the reverse order of their solubility. Hence the
maximum concentration of CaCO
3' MgC03' NaHCO3 and NaC1 were found respectively at decreasing depths toward the surface. The
that the increase in salt concentration at the surface was accompanied by a marked increase in SAR value and he also showed that this was partly due to a precipitation of calcium near the surface.
•
• D. Salt Solution Composition Parameters
The changes in hydraulic conductivity of certain soils in the presence of dissolved salt may be caused by swelling and dispersion of clays. When sodium ions are present in the soil solution they may be absorbed within the exchange complex of the soil. Further
if the salt concentration of this solution is sufficiently low, this could lead to enhanced swelling and dispersion of the clay, resulting in decreases in hydraulic conductivity. While several parameters have been suggested to characterise the composition of salt solutions in relation to their effect on the hydraulic
conductivities of soils, the cation concentration expressed in - meq/1 and the sodium absorption ratio of the solution have been widely used in recent studies (McNeal and Coleman, 1966; Thomas and
Yaron, 1968).
The sodium absorption ratio (SAR) is defined as,
Na+ SAR =
"(Ca4+ +
me+)/2
where all concentrations are expressed in meq/1. The use of this ratio was first proposed on an empirical basis (U.S. Salinity Laboratory staff, 1954) from experimental results for several
soils in the USA, which showed a relationship, between the sodium absorption ratio and the exchangeable sodium percentage. ;-
Swelling and dispersion of clays have been recognized as the major factors causing the decrease in hydraulic conductivity of
soils to salt solutions. The initial swelling of dry clays which occurs in a stepwise manner until an inter-particle spacing of approximately 19 A is reached, is caused by absorption of hydration shells by exchangeable cations. This process is essentially completed at soil suctions of 27 bars (Quirk, 1953; Emerson, 1963). Further swelling of clays is attributed to formation of diffuse double layers, and this process has been mathematically described by Gouy (1910). This theory has been further developed and used to describe swelling of clays (Schofield, 1946; Bolt, 1956). The diffuse double layer theory has also been applied to clays with mixed cations (de Haan, 1964; CollI;s-George and.Bozeman, 1970)
In X-ray studies of crystalline swelling, Norrish (1954) found that sodium montmorillonite in 0.3 /1 sodium chloride showed extensive swelling and an interlayer spacing of more than 43 A. He also showed that calcium montmorillonite had a fixed basal
spacing of 19 A in solutions, ranging from 1.7 M calcium chloride to distilled water, Na-vermiculite had an interlayer spacing of 14.8 A even in dilute solutions, and muscovite crystals did not swell at all.
Electron-microscopic studies (Aylmore and Quirk, 1962) showed that in soils clay crystals existed in regions of near parallel arrangement referred to as domains which were several microns in thickness. Hence clay swelling in many soils could also be caused by interaction between the crystals within the domains and such
generally unidirectional, due to the raw:1°m orientation and
distribution of domains in the soil (Aylmore and Qu:77)-, 1960) the welling of clays and soil aggregates is largely isotropic (Fox, 1964).
Several workers have attempted to verify theoretical predictions of the swelling of clays according to double layer theory under varying conditions of electrolyte concentration, type of exchangeable cations and applied suction.
Satisfactory agreement between theoretical and experimental swelling pressure versus film thickness curves was obtained
•by Bolt (1956)and Warkentin et al. (1957) for sodium montmorillonite in -4
10-3 M to 10 M sodium chloride solutions, provided' prior
compression of twenty atmospheres was applied to force the clay into parallel orientation and reduce the void space between the
crystals. Warkentin et al. (1957) also found that with pre-compressed calcium montmorillonite the swelling pressure versus film thickness curves were displaced to lesser film thicknesses than expected from
-1
the theory, assuming a clay surface area of 800 m2 g - . Several
workers (Aylmore and Quirk, 1959, 1960; Blackmore and Miller, 1961) have suggested that calcium montmorillonite formed tactoids or
quasi-crystals and hence could show only limited intra-crystalline swelling. Blackmore and Miller (1961) found from X-ray studies that as the constraint was increased, the number of clay particles per tactoid also increased.
The swelling of sodiuln Willalooka illite, which shows only inter-crystalline swelling, was found by Aylmore and Quirk (1962) to be sensitive to both electrolyte concentration and pressure and hence was very similar to the intra-crystalline swelling of
electrolyte concentration.
These studies have shown clearly that the amount of swelling is highly dependent on the previous compression or dehydration history of the sample (Warhentin et al., 1957; Aylmore and Quirk, 1959), the nature of the clay and the exchangeable cations present. It has also been shown that in calculating water absorption by clays
using the diffuse double layer theory, allowance has to be made for water present in the gel structure (Schofield, 1946; Aylmore and Quirk, 1962; Quirk, 1968). In addition, the constraints to swelling of
clays in soils due to the presence of mechanical and chemical bonding needs to be considered.
Two models have been proposed to describe the distribution of sodium and calcium ions in mixed - ion clays. According to the mixed-ion model used by some workers (de Haan, 1964) each species of cation
is distributed over all mineral surfaces in proportion to its
exchangeable cation percentage. Other workers (McNeal et, al., 1966; Shainberg et al., 1971) favour the demixed-ion model, according to which in the case of sodium-calcium clays, a demixing of ions into calcium regions and sodium regions could occur with only the sodium regions exhibiting concentration dependent interlayer swelling. McNeal (1970) showed that most of the limited data on welling of
clays in mixed-ion solutions agreed more closely with theoretical predictions from the demixed-ion model than with the nixed-ion model.
chloride solution, was small. But in the presence of mixed sodium-calcium solutions, the electrolyte concantration at which the clays show specific extents of swelling increased as the SARs of these solutions were increased. Similar res;Elts were obtained by Rowell et al. (1969) in studies on the effect of salt solutions on swelling of oriented clay aggregates of a brown earth soil. McNeal et al. (1966) also found that the measured macroscopic swelling of clay pads showed a close correlation with the interlayer swelling values calculated from the demixed-ion model after accounting for the
solution taken up by the gel structure of the soil. The agreement between the theoretical and experimental swelling values was
further improved by assuming that the first increment of sodium was ineffective in causing swelling. Sheinberg and Otoh (1968)
suggested that the first increments of sodium added to a calcium clay were largely concentrated on the external surfaces of the clay crystals- and hence did not affect the basic structure of the clay tactoids. Further additions of sodium into the exchange complex (over 20 per cent) resulted in the breakdown of the
tactOids. -
F. Effect of Salt Solutions on Hydraulic Conductivity of Soils The decrease in hydraulic conductivity and deterioration of structure in the presence of sodium in the percolating solution or on the exchange complex of soils, and the effect of calcium in increasing the hydraulic conductivity (Fireman and Magistad, 1945; U.S.
which the hydraulic conductivity of sodium saturated soils dropped essentially to zero as the critical concentration, and used this value as an index of soil structure.
Quirk and Schofield (1955) introduced the concept of threshold concentration, defined as the minimum concentration of electrolyte necessary in the soil solution to prevent a decrease in permeability of more than 10 - 15 per cent. In a detailed study on Sawyers soil at Rothamsted Experimental Station, they found that the threshold concentration for this soil when saturated with sodium was higher than when saturated with calcium. When the soil was saturated to varying degrees with sodium the threshold concentration increased with sodium saturation. A method for classifying irrigation waters
into permeability classes was sugi,ested by Doneen (1961) on the basis of his work on a high montmorillonite Yolo soil whose permeability was reduced by 25 per cent when the electrolyte concentration was less than 3.5, 6.5 and 10.0 meq/1 at ESP values of 0.6, 3.4 and 8.0 respectively.
McNeal and Coleman (1966) studied the effect of salt solutions on several soils with different clay mineralogy. They found that
with a reduction in electrolyte concentration or increase in SAR, the decrease in hydraulic conductivity was most pronounced for soils high in 2 : 1 layer silicates, while soils high in kaolinite • and sesquioxides were virtually unaffected by changes in salt
composition. The most labile hydraulic conductivities were exhibited by soils containing the most montmorillonite. These studies also showed that the chemical properties of the solution alone were not sufficient
Yaron and Thomas (1968) found that in three soils whose respective mineralogy was predominantly montmorillonite, montmorillonite-illite
and illite-kaolin, appreciable reduction in hydraulic conductivity for solutions where electrolyte concentration was 34.5 meq/1 occurred when the ESP value's exceeded 10, 27 and 21 respectively, while in
solutions of electrolyte concentration of 11.3 meq/1 the marked decreases in hydraulic conductivity occurred at ESP values of 8, 13 and 18 respectively. In a study on vermiculitic soils, Rhoades and Ingvalson (1969) showed that a 25 per cent decrease in hydraulic conductivity to solutions with electrolyte concentration between 5 - 20 meq/1 did not occur at ESP values less than 50. This was attributed to these soils having an appreciable fraction of their exchangeable sodium sorbed on relatively large, semi-expanding vermiculite particles, this fraction of exchangeable sodium being inactive in its effects on soil permeability. Naghshineh-pour et al.
(1970) found that while the increase in SAR and decrease in electrolyte concentration led to rapid decrease in conductivity of two
montmorillonitic soils, a soil with a clay fraction primarily composed of tabular halloysite did not show appreciable decreases in hydraulic conductivity except in solutions of the highest SAR (SAR 38) and
Factors which contribute to the stabilisation of soil structure, such as organic matter and sesquioxides (Russell, 1971) could affect the stability and conductivity characteristics of soils to salt
solutions. Emerson (1954) and Dettmann and Emerson (1959) found that the permeability to high sodium, low salt solutions was much higher in a soil which had supported a permanent pasture for several years than in soils under arable cropping, apparently due to the
effectiveness of organic matter as a cementing agent. Several workers (El-Swaify and Swindale, 1968; McNeal et al., 1968; Naghshineh-pour et al., 1970) found that in soils with high contents of sesquioxides, hydraulic conductivity changed only slightly in high sodium, low salt solutions. McNeal et al. (1968) also showed that the partial removal of the free iron-oxides led to a decrease in stability of these sesquioxide rich soils, and a reduction in conductivity to high sodium, low salt solutions occurred. El Rayah and Rowell (1973) showed that a deposit of sesquioxides around a soil aggregate reduced swelling and increased permeability to sodium chloride solutions of low salt concentration until the coating was broken by the swelling pressure of the clay, in the aggregates. Aluminium oxides have been shown to be more important than iron oxides in increasing the structural stability of soils
(Deshpande et al., 1968) especially in soils in which the iron oxides exist as discrete nodules and hence do not contribute to the stability of these soils (Greenland et al., 1968). Thus in addition to the amounts 'of these cementing agents present, their nature and
distribution are important factors in increasing the stability of soils to salt solutions.
sesquioxides and organic matter, depending on their nature and distribution, could increase the stability of soils to salt solutions.
The effects of other soil properties on the hydraulic
conductivity of soil's in low salt, high sodium solutions have also been studied. McNeal et al. (1968) found that in soils having similar clay mineralogy the decrease in hydraulic conductivity with reduction of salt concentration at a given SAR was more pronounced for soils with higher clay content.
The type of cations present in salt solutions also affects the saturated conductivity of soils. Quirk and Schofield (1955) showed that the concentration of electrolyte causing a 10 to 15 per cent
decrease in hydraulic conductivity increased as the cation saturating the exchange complex was changed progressively from
calcium to magnesium to potassium and then to sodium. McNeal et al.
(1968) found that the hydraulic conductivity was lower for sodium-magnesium solutions than for sodium-calcium solutions of comparable
SAR and salt concentration values.
Martin and Richards (1959) showed that in soils packed into cylinders when moist, very little changes in hydraulic conductivity occurred
or alkaline soils, and this was attributed to the decreases in cation exchange capacity with increasing soil acidity. Hence the same amount of sodium in an acid soil represents a higher exchangeable sodium percentage than in a neutral or alkaline soil.
The permeability to water of Shepparton soil columns saturated with calcium and magnesium showed only a negligible decrease with time
(Bakker and Emerson, 1973). With sodium present, the ESP required to produce a given decrease in flow rate was reduced when magnesium was the complementary cation rather than calcium.
When a soil that is initially non-sodic is irrigated with sodic water the hydraulic conductivity decreases until the soil profile reaches equilibrium with the permeating solution (Yaron and Thomas, 1968). This dedrease in hydraulic conductivity was characterised by a curve whose shape varied with the soil and the salt composition and concentration of the permeating solution. Thomas and Yaron (1968) found that for a given salt concentration of irrigation water, an increase in SAR resulted in a greater decrease in hydraulic
conductivity of the soil.
The decrease in conductivity of some soils for salt solutions •
has been attributed by some workers (Burgess, 1928; Gardner, 1945; Bodman and Fireman, 1950) largely to clay dispersion causing a blocking
of conducting pores. Other workers (Carman, 1939; Smith and Stallman, 1955; Koenigs, 1961) found that clay swelling in salt solutions
1969; Quirk, 1971). McNeal et al. (1966) found close correlation between hydraulic conductivity decreas s in low salt, high sodium solutions and predicted and experimental swelling of ciays in the same salt solutions. They found that limited reversibility of clay swelling in soils made reversibility of permeability decreases a
. doubtful index of the type of permeability decreases that had occurred. Rowell at al. (1969) found a close correlation between cation
concentration at which marked decreases in hydraulic conductivity occurred and the cation concentration at which marked swelling of clay pads took place. In the same soil, turbidity of percolating solutions during conductivity experiments occurred at lower cation concentrations. However, earlier studies (Bodman and Harradine, 1938) have shown that clay dispersion could occur within the soil column even though a clear percolate flowed from the bottom of the column.
Shainberg et al. (1971) and Shainberg and Caiserman (1971) found that addition of a small amount of exchangeable sodium to a clay
saturated with calcium, had only a moderate effect on swelling and did not decrease the hydraulic conductivity of this clay to water, under conditions where the clay was not free to move. But where the clay was free to move, there were marked decreases in hydraulic conductivity on addition of small amounts of exchangeable sodium. They suggested that when about 10 per cent of the exchangeable calcium was replaced by
sodium, most of the adsorbed sodium was on external surfaces of the tactoids and hence there was no additional swelling of the clay. But this addition of sodium led to increases in the electrophoretic mobility of the'clay (Bar-On et al., 1970) and where the clay
and a clayey soil, Chen and Benin (1975) found that clay dispersion was responsible for hydraulic conductivity decreases in these soils at low ESP from 0 to 20 per cent.
Although the relative Importance of clay swelling and clay dispersion in causing decreases in hydraulic conductivity varies in different soils, both these processes appear to be enhanced by high sodium, low salt
solutions.
Rowell et al. (1969) showed that the cation concentration at which clay dispersion occurred when the soil was at a given ESP, was increased as the mechanical stress applied to the soil was
increased. These results also emphasise the need to regulate
the extent of mechanical disturbance to which the soil is subjected during wetting, leaching with specific salt solutions and also during conductivity measurements, in relation to the specific field conditions to which these results are applied.
One of the problems in reviewing and comparing the results of different workers on the effects of salt solutions on hydraulic conductivity of soils is the use of different soil fractions in these studies. The use of the entire fraction below 2mm, which is a common practice, presents difficulties as these fractions are likely to contain a fair amount of dusty clay material. The presence of this fine material could lead to greater dispersion in high sodium, low salt solutions than if a soil core or a packed
soil column of 'a size fraction which excludes the finer size
fractions were used. Further, since the dusty material is largely an artefact of the process of soil grinding and the amount present
• also varies with the type of grinding and the soil used, this
Recent developments in applying double layer theory to swelling of mixed-ion clays (de Haan, 1964; Collis-George and Bozeman, 1970) could encourage the search for theoretical methods for predicting hydraulic conductivitjE:s of soils to different salt solutions from soil characteristics. However, the complexity of the factors determining the swelling of clays in soils in the presence of salt solutions and their resultant effects on the pore geometry and
hydraulic conductivity, as illustrated in Figure 2, present practical difficulties in raking such predictions. For instance, the method proposed by Lagerwerff et a/. (1969) for predicting hydraulic
conductivitY changes in the presence of salt solutions, based on the double layer theory and Kozeny-Carman equation, appears to have limitations in use (McNeal, 1974). However, several semi-empirical methods have been proposed. McNeal (1968) devised a method for predicting hydraulic conductivity for salt solutions using the measured conductivity of the soil in a high salt, high sodium solution and in a solution of a lower salt concentration. Calculated interlayer swelling values of montmorillonite were used as a frame of reference for these predictions. Yaron and Thomas (1968) proposed a semi-empirical method for predicting the hydraulic conductivity decreases expected from the use of sodic waters. Rowell et al. (1969) predicted hydraulic conductivity changes in salt solutions from changes in porosity of clay pads
due to swelling of clay in the same solutions. Although satisfactory agreement was found between the saturated conductivities predicted from these semi-empirical methods and the measured saturated
PORE GEOMETRY OF SOILS IN SALT SOLUTIONS
1. Initial pore geometry of the dry soil>2. Swelling of aggregates causing changes in pore geometry
SWELLING OF SOIL AGGREGATES
Swelling of clay matrix
2. Skeletal grain structure of sand and silt fraction (and the distribution and orientation of clay within the soil fabric)
3. Cementing agents such as organic matter, sesquioxides, etc. (nature, amounts and distribution in the soil)
SWELLING OF CLAY MATRIX
>1. Crystalline swelling of clay
2. Amounts of different clay minerals 3. Formation of domains and quasicrystals 4. Formation of void or gel structures
CRYSTALLINE SWELLING OF CLAYS
1. Type of clay and its crystal structure
• 2. Exchange cations
3. Electrolyte concentration of solution
[image:44.824.9.824.47.544.2]4. Suction or confining pressure
diffusivity has also been studied. Gardner et al. (1959) showed that with increase in ESP and decrease in electrolyte concentration of salt solutions the was a decrease in mean-diffusivity of
Pachappa sandy loam and Yolo loam soils. Thus when the ESP was above 25, as the electrolyte concentration was reduced from 300 to 3 meq/1, the mean-diffusivity decreased one thousand-fold. They also found that although the reduction in diffusivity for high sodium, low salt solutions occurred mainly at higher water contents, significant reductions also occurred at lower water contents corresponding to suctions of 15 bars.
Christenson and Ferguson (1966) found that an artificial soil containing 17.6 per cent dickite had a higher diffusivity for 0.015 N CaCl
2 than for distilled water at all water contents when the soil had an ESP of 5.0. When the soil had an ESP of 20.3, the diffusivity for 0.015 N CaC1 2 solution was higher only at high water contents. An artificial soil with 17.6 per cent montmorillonite showed a,higher diffusivity in 0.015 N CaCl 2
than in distilled water only at high water contents when the soil had an ESP of 5.5. In this soil with ESP increased to 13.6, the diffusivity for water and CaCl
2 solutions was similar. These results were explained in terms of changes in diffuse double layers caused by the presence of CaC1
2 solution. Kijne (1967) showed that the treatment of a clay loam soil with Krilium and a polyvinyl alcohol caused an increase in diffusivity over the whole range of water
contents while the diffusivity of a loamy sand soil showed only small changes when treated with these soil conditioners.
Three soils with ESP values between 5 and 20 were found by Sharma (1972) to have greater diffusivity and unsaturated
of soils to gypsum treated and untreated water was small.
.=I: - NATERIALS'AND'EXPERDENTAL . NETHODS
• A. Soil Materials
Three soils locled in north and south-eastern regions of Tasmania, Australia, were selected for this study. Soil samples were collected from the subsoils of:
) a krasnozem soil formed on basalt near Burnie in north-western Tasmania, mapped as Burnie clay loam (Loveday and Farquhar, 1958). The soil material taken from a depth of 20 to 32 inches had a reddish brown (2.5YR 4/6) colour and a field grading of clay. Pedality was strong medium angular blocky and moist consistency was very
friable.
(b) an alluvial soil on a fairly broad alluvial plain near Soren_ in south-eastern Tasmania, mapped as such by Loveday (1957). The soil material taken from 24 to 36 inches depth had a brownish black (10YR 3/2) colour and a field grading of sandy clay loam. Pedality was moderate medium sub-angular blocky.
(c) a red brown soil formed on basalt near Sorell in south-eastern Tasmania. This soil was mapped as Stoneleigh clay loam (Loveday,
1957). The soil material, taken from a depth of 22 to 34 inches, had a dark reddish brown (5YR 3/3) colour and a field grading of clay loam. Pedality was moderate medium sub-angular blocky.
. • Preparation of Soils and Salt Solutions
material was again thoroughly mixed and subsampled by a process of mixing, quartering, remixing opposite quarters, quartering and so on to obtain eight subsamples of each soil which were stored for future use. When taking soil from these subsamples for use in the experiments, the same process of mixing and
quartering was employed, to ensure as far as possible uniformity of the soil material used in the experiments.
Further, the procedures of packing, wetting, draining and the experimental methods were standardized and the exact procedure was followed always in order to minimise the possible variation in pore geometry of the packed soil samples due to differences in
experimental handling of the soils (Loveday, 1974). All experiments were conducted in a constant temperature room at 22 ±1 ° C.
The solutions of specific s,ilt composition and concentration used in the experiments were prepared by dissolving the required quantities of reagent grade sodium chloride and calcium chloride in deionized, deaerated water (Appendix C). The solutions also contained 20 ppm of mercuric chloride to suppress any bacterial activity.
C. Physical and Chemical Characteristics of the Soil Materials The physical and chemical characteristic's of the soils were determined using the procedures described in "Methods of soil analysis" (Black et al., 1965): Determinations of particle size analysis by the pipette method, organic matter content by the
Walkley and Black method, free iron oxide content by the diphenylamine sulphonate method, soil reaction using a glass electrode, cation
The particle density of the soils was measured using a pycnometer and the moisture characteristic at low energy was determined by keeping fragmented soil samples in a vacuum
desiccator containing saturated salt solutions of known relative humidity. The clay fractions extracted from the soils were used
-
to determine the minimum cation concentrations in solutions of specific SARs in which the clay flocculated, using the method described by Collis-George and Smiles (1963).
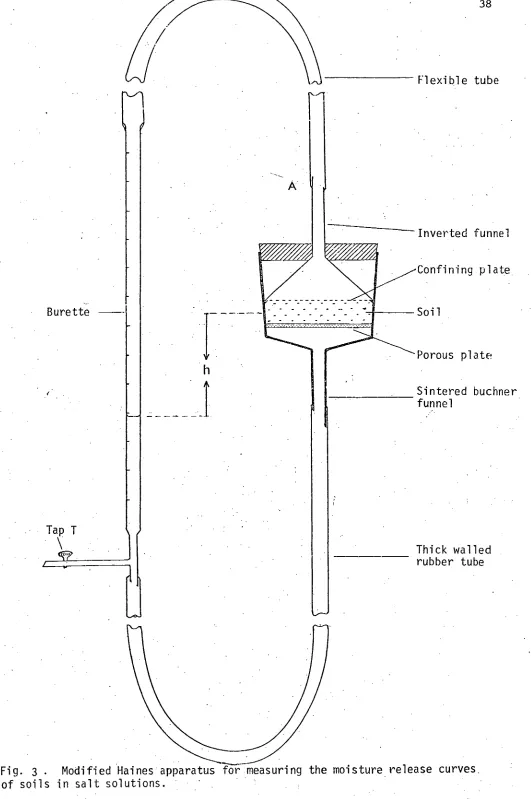
D. Moisture Release Curves of Soils for Salt Solutions
Flexible tube
Inverted funnel
Confining plate
Soil
Porous plate
Sintered buchner funnel
[image:50.564.19.550.8.807.2]Thick walled rubber tube
Fig. 3 . Modified Haines apparatus for measuring the moisture release curves
The sintered funnel, rubber tube and the huvAte were filled with a solution of SAP. 40 and highest cation concentration of 640 meq/1, through the pr,--saturated sintered plate. With the plate at a suction of 60 cm, the 2.0 to 0.5 mm fractions of the krasnozem, alluvial and red brown soils were packed on the plate to bulk • densities of 0.87 ± 0.02, 1.01 ± 0.02 and 1.05 T. 0.02 g/cn
respectively.
The soil was wetted for a few hours under suctions of 60 and 30 cm of water and then saturated by raising the level of the solution in the burette. The soils were twice drained to 60 cm suction and ref boded to allow the soil to pack. The soil was reflooded and the same salt solution was siphoned into the buchner funnel from a mariotte bottle through connection A. With tap T open, the saturated soil was leached with approximately 20 pore volumes of this salt solution (McNeal and Coleman, 1966) to ensure chemical equilibrium between the soil and the leaching solution. All tube connections were sealed with a rubber sealant. The moisture release curve was determined by increasing the suction
in small increments and recording the volume of outflow of the solution into the burette and the final equilibrium suction. A small predetermined correction for plate drainage was applied to these readings.
The soil was again saturated and then leached with the solution of the same SAR and next highest cation concentration and the
moisture release curve was determined using the same procedure. This process was continued until the moisture release curve of the soil in equilibrium with the salt solution at SAR 40 and the lowest cation concentration was determined. The soil was then sampled to determine the moisture content at the highest suction