QLK5-2002-02400
Deliverable D4 (WP5)
Report on the evaluation of the pilot case studies
Norbert Gleirscher
Markus Schermer
(University of Innsbruck)
Marta Wroblewska
(Central Statistical Office Poland)
Sylvia Zakowska-Biemans
(Agricultural University of Warsaw)
July 2005
This report has been carried out with financial support from the Commission of the European Communities under Key Action 5 of the Fifth Framework Research and Technological Development Programme for the concerted action "European Information System for Organic Markets". The views expressed are those of the authors and do not necessarily reflect the views of the European Commission, nor do they in any way anticipate the Commission's future policy in this area.
Responsible for D4:
“Report on the evaluation of the pilot case studies”
DI Norbert Gleirscher
Institute for Sociology
Centre for Mountain Agriculture
University of Innsbruck
Universitätsstrasse 15
6020 Innsbruck
Austria
Phone: +43-(0)512- 507-5694
E-mail: [email protected]
Authors of the chapters:
-
Norbert Gleirscher (University of Innsbruck): Chapter 1, 2, 4, 5
-
Marta Wroblewska (Central Statistical Office Poland),
Table of Contents
1 Introduction... 9
1.1 Objectives of WP5... 10
1.2 Approach and Methods ... 10
2 Pilot applications ... 12
2.1 Farm level (production) ... 12
2.1.1 DEFRA – United Kingdom ... 12
2.1.2 SKAL Netherlands... 13
2.1.3 Agricultural and Food Quality Inspection - Poland ... 15
2.2 Farm level (income)... 19
2.2.1 DEFRA – United Kingdom ... 19
2.2.2 The Institute of Agriculture and Food Economics (IAFE) - Poland ... 20
2.3 Price level... 22
2.3.1 ZMP- Germany... 22
2.3.2 Prezzibio - Italy... 24
2.4 Trade (including Import/Export)... 26
2.4.1 DEFRA (P1) ... 26
2.4.2 Statistics Denmark ... 27
2.5 Retailer/Consumer level ... 32
2.5.1 Statistics Denmark ... 32
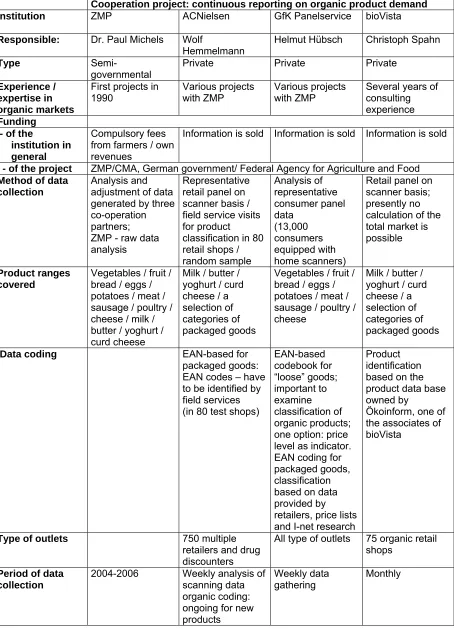
2.5.2 Project ‘Quantification of the demand for organic products in Germany’ ...34
2.5.3 IHA-GfK Group – Consumer and Retailer Panel ... 39
2.6 Supply chain level ... 41
2.6.1 Fab4minds – BioStockManager® (BSM) ... 41
2.6.2 INTACT- e-cert... 44
2.6.3 Project ‘A chain information system for organic production in the Netherlands’ ... 47
2.7 Eurostat... 48
2.8 Other investigated DCPS ... 53
2.8.1 Expenditure on Food Survey... 53
2.8.2 Consumer prices ... 53
2.8.3 Retailer data... 53
2.8.4 Dissemination... 53
3.1 Introduction ... 54
3.2 Problems and barriers identified on the actor level (based on S-W analysis) 54 3.2.1 Producer level (PL, NL, UK) ... 54
3.2.2 Price level (IT, DE) ... 55
3.2.3 Farm incomes level (UK, PL) ... 56
3.2.4 Retail/consumer level (CH, DE, DK) ... 57
3.2.5 Supply chain level ( AT) ... 58
3.2.6 Trade / import export level (DK, UK) ... 58
3.3 Analysis of DCPS with regard to opportunities and threats (based on O-T Analysis)... 59
3.3.1 Production level (PL, NL, UK) ... 59
3.3.2 Price level (IT, DE) ... 61
3.3.3 Farm income level (UK, PL) ... 61
3.3.4 Retail/consumer level (CH, DE, DK) ... 62
3.3.5 Supply chain level (AT) ... 63
3.3.6 Trade /import export level ( DK, UK) ... 64
4 Analysis of the DCPS investigated in the light of the recommendations made in D3... 65
4.1 Introduction ... 65
4.2 Farm level (Production) ... 65
4.2.1 General Recommendations... 65
4.2.2 Special requirements ... 70
4.2.3 Farm level (Income) ... 71
4.3 Retailer and Consumer level ... 72
4.3.1 Special recommendations... 76
4.4 Import/Export and Trade level ... 77
4.5 Supply chain level ... 78
4.6 Price level... 80
List of Tables
Table 1 Pilot applications and data levels... 11
Table 2 Assessment on data quality DEFRA (farm level)... 13
Table 3 Assessment on data quality Skal (farm level) ... 15
Table 4 Assessment of data quality GIJHARS (farm level)... 18
Table 5 Assessment of data quality DEFRA (farm income level) ... 19
Table 6 Assessment of data quality IAFE (farm income level)... 21
Table 7 Assessment of data quality ZMP (price level)... 24
Table 8 Assessment of data quality Prezzibio (price level)... 26
Table 9 Assessment of data quality DEFRA (trade level)... 27
Table 10 Assessment of data quality Statistics Denmark (trade level) ... 30
Table 11 Assessment of data quality Statistics Denmark (retail/consumer level) ... 33
Table 12 Project structure “Quantification of the demand for organic products in Germany” ... 35
Table 13 Product groups covered by the project “quantification of the demand for organic products in Germany” ... 37
Table 14 Assessment of data quality ZMP (retail/consumer level) ... 38
Table 15 Data quality IHA-GFK Switzerland (retail/consumer level)... 41
Table 16 Data quality assessment Biostockmanager (supply chain level) ... 44
Table 17 Data quality assessment E-Cert (supply chain level)... 47
List of Figures
Figure 1 Data transfer and the institutions involved ... 17
Figure 2 Organisational structure of FADN in Poland ... 21
Figure 3 PREZZIBIO: data collection structure ... 25
Figure 4 Data flow with the Biostockmanager®... 42
Figure 5 How BioStockManager® (BSM) works ... 43
Figure 6 Structure of E-Cert... 45
List of Abbreviations
AIAB ...Italian Association for Organic Farming ARM ……….…………..….Azienda Romana Mercati BÖL ...German Program for Organic Agriculture CA ………..Concerted Action CAP ...………...Common Agricultural Policy CB ...Certification Bodies CBS ...………...Statistics Netherlands CMA ...Central Marketing Association for German Agriculture Industries CN .………Combined Nomenclature COICOP...Classification of Individual Consumption by Purpose CSA ………...Central Statistical Office DCPS ...Data Collection and Processing System DEFRA ………..…..Department of Environment Food and Rural Affairs
DKK ………..Danish Krone
DS ...………Statistics Denmark EAN ...European Article Number ECHP ...European Community Household Panel EEA ...Eastern European Accession Countries EFRC ...Elm Farm Research Centre EFTA ...European Free Trade Association EU-CEE-OFP………...Further development of European organic farming policies,
1 Introduction
The development of the market for organic products has shown a significant increase over the last 10 years, both within Europe and worldwide. Hand in hand with the enlargement of organic cultivated areas all over Europe, the marketing of organic products has gained more and more importance within the food supply, especially in distribution via supermarkets, natural food stores, farmers markets as well as through on-farm marketing. As a result of this, the need for detailed and up-to-date market information has increased. For farmers, detailed market information is needed as a basis for decision-making on long term investments in production and processing facilities (e.g. glasshouses, housing, and machinery). For market actors such as processors and retailers, the identification of market trends and consumption behaviour is necessary to enable them to orientate their marketing strategies in line with the market development. Since European agricultural policy has a crucial impact on the development of organic farming in Europe, market information is needed to plan, and to adapt where necessary, the regional, national and European support programmes in order to achieve the specified goals most efficiently.
The current situation of market information systems on organic farming in Europe shows a substantial lack of information. Although previous EU-research projects such as OFCAP (FAIR3-CT96-1794) and OMIaRD (QLK5-2000-01124) have shown that regional or national data gathering takes place in many countries, the availability of detailed and current data on various levels, such as production, consumption, prices as well as trade, on the national as well as at the European level, is not satisfactory. The main problem areas identified in regard to market information systems for organic farming can be summarised as i) the lack of market information at the national level and ii) where data are available, the lack of data harmonisation at the European level.
Within the EU-funded concerted action EISfOM (European Information System for Organic Markets, QLK5-2002-02400), the aim is to build a framework for reporting valid and reliable production and market data for the European organic sector in order to meet the needs of policymakers, farmers, processors, wholesalers and other actors involved in organic markets. Based on the previous research done in Workpackages 2, 3 and 4, this report focuses on the evaluation of pilot case studies in eight European countries, showing proposals for new and/or enlarged data collection and processing systems for organic markets in Europe.
systems (Recke, G. et al., 2004) and the proceedings of the first European Seminar “Development of a European Information System for organic markets – improving the scope and quality of statistical data” (Recke, G. et al., 2004).
1.1 Objectives of WP5
According to the Technical Annex the aim of WP5 is:
o to co-ordinate pilot studies in key European countries (UK, DE, AT, CH, DK,
IT, NL, PL) and at international level (Eurostat, FAO)
o to collate and evaluate the pilot study results with respect to the
recommendations generated out of WP2, WP3 and WP4.
P3 (University of Innsbruck), assisted by P8 (Agricultural University of Warsaw) had the main responsibility for the coordination of the implementation of the pilot case studies by partners. P3, assisted by P8, prepared the report (D4) evaluating the results of the pilot application studies based on national working papers. The structure and content of this report were reviewed by all partners during the 4th project meeting organised by P8.
1.2 Approach and Methods
The purpose of conducting pilot applications was to test new and/or enlarged data collection and processing systems (DCPS) for organic markets on various levels and in various countries to try to identify improved methods of generating reliable data and/or overcoming barriers to implementation of such improvements. To ensure the quality and significance of case study results, pilot applications were conducted by partners with strong involvement from national key players, such as inspection bodies, statistical affairs offices, consumer behaviour institutions, and international organisations such as Eurostat. Within the case studies the main data levels - production, consumer, retailer, trade, prices and supply chain - were tackled and analysed. Complementary results from current and recent Framework 5 programmes (OMIaRD, EU-CEE-OFP) were integrated into the analysis.
Table 1 Pilot applications and data levels
Farm level
(Production) Farm level (incomes) Retail level Consumer level Price level Trade level Supply chain level P1
(UK) X X X X X X
P2 (CH)
X X
P3
(AT) X
P5
(DE) X X
P6
(IT) X
P7 (DK)
X X
P8
(PL) X X
P9
(NL) X
P10
(DE) X X
In line with the requirements of Subworkpackage 5.2, all partners prepared national working papers on the barriers and problems encountered during this test period (see Appendix 1). The evaluation focused on the opportunities for standardising data collection (especially production data), approaches to overcoming weaknesses in data collection (as outlined in WP4), and identifying improved methods for generating reliable data and/or overcoming barriers with regard to implementation of such improvements, as well as identifying national core institutions for future data collection and processing systems.
2 Pilot applications
2.1 Farm level (production)
2.1.1 DEFRA – United Kingdom
The Department of Environment Food and Rural Affairs (DEFRA) is the government ministry responsible for agriculture and agricultural statistics in England, with some functions also at a UK level. Since 2002, following the publication of the English Action Plan for Organic Food and Farming, DEFRA has become more actively involved in collection and publication of organic farming statistics at different levels. It works with private sector organisations, in particular organic certification bodies and the Soil Association charity to collect data, with information published on its website (http://www.defra.gov.uk/farm/organic/introduction), although there is limited direct funding for this work (ca. 0.75 FTE staff time is resourced within the statistics division). Some work is also carried out through DEFRA commissioned research, in particular horticultural market research by HDRA (Firth et al., 2005) and organic farm business data surveys by the University of Wales, Aberystwyth (Jackson et al. 2005).
The data generated by DEFRA is published via their website (see above) as well as in their annual Agriculture in the United Kingdom publication. It is also utilised in the Soil Association’s annual Organic Food and Farming Report and the UWA/EFRC Organic Farm Management Handbook (published every 1-2 years). Tailored responses are also made to ca. 100 ad hoc requests for information each year.
In addition to the direct support for staff time in the Statistics Division and the commissioned research, payments are also made by DEFRA to certification bodies in return for the provision of data, amongst other activities. These payments are part of a general grant to the organisations based on the number of registered operators, for services to support DEFRA’s work. In the past, actual amounts for specific tasks such as the provision of data were not specified, with the result that pressure to deliver could only be applied indirectly through the policy division. This could impact on the efficiency with which data can be collected. From the financial year 2005/06 the agreements covering these payments do clearly state what information certification bodies are required to provide and also state that “If performance of the Certification Body does not meet requirements of this Agreement it will result in non-payment of Grant”.
DEFRA’s Statistics Division works with the ten main UK certification bodies to obtain comprehensive production data directly, rather than through the Farm Structure Survey (Agricultural Census). Data are collected from the certification bodies annually relating to the situation at the first of January each year. The selection of crop and livestock areas is governed firstly by DG Agri/Eurostat reporting requirements, but is also influenced by the different data categories and IT systems Interview partner(s):
Michael Rowland, Statistics Officer
Contact details: DEFRA
Statistics Division Peasholme Green, York
operated by the data providers. DEFRA has attempted to increase the level of standardisation between data providers, but resource issues relating to modifying IT systems have restricted progress and a degree of standardisation and validation needs to be undertaken centrally to obtain a consistent data set. Despite this, reliance on administrative data obtained from certification bodies is seen as more accurate than survey approaches such as the Farm Structure Survey/Annual Census.
The following table provides an assessment of data quality (as defined by Eurostat, 2003) based on the interviewees’ opinions and expert assessment.
Table 2 Assessment of data quality DEFRA (farm level)
Relevance High, as primary data collected directly from holdings, although useful
information such as production quantities still not available and complete information on livestock numbers only becoming available for the first time from 2004. Some estimates were published relating to 2003, but these restricted the possibility of producing regional breakdowns.
Accuracy High, but entirely dependent on certification bodies and the quality of their
procedures – there is no direct control on the accuracy of data collection by inspectors, and the categorisation of data can be insufficiently specific (e.g. ‘vegetables’ or ‘other crops’). While DEFRA has been working with them to improve this, changes to categories are imposed by the policy division and there can be significant time lags before a full picture of new items is obtained. There were some problems with the accuracy of the 2003 livestock data published in 2004, due to the missing data problems indicated above.
Timeliness and punctuality
Timeliness is influenced by the annual inspection cycle, so that some data may be up to one year old at the time they are requested, but this is unavoidable with this approach. Punctuality can also be affected by delays in receiving data from certification bodies, and by the amount of modification needed to reconcile the different formats provided and clarify data uncertainties, so that the process may take six months to complete.
Accessibility and clarity
There is good accessibility to raw data, but disclosure rules mean that data can be released or published only if a minimum of five cases are available.
Comparability Comparability is high – the fact that this is administrative not survey data is not
seen as a problem. Harmonisation with the FSS has been planned but not implemented due to staff changes. This would permit linking of additional data (e.g. labour, non-farming activities) and comparisons with conventional data. The main problem has been the lack of holding numbers for some returns from certification bodies as well as some issues relating to data confidentiality.
Coherence This is improving as the systems become established, but the procedures are
too recent to ensure a high level of data coherence and consistency over time.
2.1.2 SKAL Netherlands
Interview partner(s): Inge Kreupeling Richard Nijenstein
Contact details: Skal
Skal is the main inspection and certification body for organic production in the Netherlands. Under the authority of the Ministry of Agriculture, Nature and Food Safety, Skal audits organic farms, processors and importers (from outside the European Union). Since 2002 Skal has been part of the Foundation Skal International, where an Executive Committee of independent people and representatives of the organic sector is responsible for the definition of certification programs for organic production and processing. The certification program is supervised by the Dutch Accreditation Council (RVA) and regulated by the legal framework of the Ministry of Agriculture, Nature and Food Safety. Alongside the physical audits of organic production in the Netherlands, Skal International is also involved in the certification of sustainable forest, wood and textile production as well in certification of organic production abroad, e.g. for Bio-Suisse in Switzerland.
In 2003 Skal began to develop a new system to collect data on organic farms and companies aiming primarily to facilitate the inspection and certification process. Whereas before 2003 information about organic companies was mainly obtained from statement letters, in 2003 and 2004 Skal began systematically to use data gathered through the inspection process. This new development aimed at gathering information on the structure and management of farms and companies in order to provide better information on current market trends and developments. Only those companies and farms which are not visited before August still receive a statement letter to be completed and sent back to Skal.
On farm production level, the Skal DCPS contains information on the number of organic farms and the surface of organic and in conversion land as well as various data divided into categories according to the Skal tariff system (see the national working paper on Skal in Appendix 1). The information is gathered during the inspection process and stored in an Excel model which is then used to send invoices to the respective farmers and companies. Although quite substantial, the current DCPS still does not contain a harmonised system for registration of the area under specific crops. The DCPS also holds information on the number of processing and importing companies as well as on annual turnover divided into specific categories and sub-categories (see also Appendix 1).
The results of the data gathering exercise are published by Skal in conjunction with the Agricultural Economics Research Institute in Wageningen (LEI) via the
Ekomonitor in the form of an annual report. This annual report (also available on
The following table provides a basic assessment of data quality based on the interviewees’ opinions and expert evaluation.
Table 3 Assessment of data quality Skal (farm level)
Relevance The Skal DCPS mainly meets their need for information on the structure and
management of organic farms and companies. For external users, the DCPS at the moment does not provide a complete overview with regard to the classification of Council Regulation (EEC) No 2092/91.
Accuracy The DCPS provides an adequate overview of the activities of farms and
affiliated companies, areas under organic husbandry (converted and in conversion) and on specific groups of crops and animals.
Timeliness and punctuality
Skal aims to have a complete overview around August/September each year. The complete dataset is sent to LEI at the end of the year and published at the beginning of the following year.
Accessibility and clarity
Data on organic farms in the Netherlands are published by LEI once a year via the annual Ekomonitor. Additionally data on the number of organic companies and the number of certificates is available via the Skal website.
Comparability The DCPS is mainly used to assess the development of organic farming in
the Netherlands. Due to differences in the classification of products the DCPS at present is not comparable with other European statistics, except on a higher aggregation level.
Coherence All annual and quarterly reports are based on data from the same source and
collected in the same way.
2.1.3 Agricultural and Food Quality Inspection - Poland
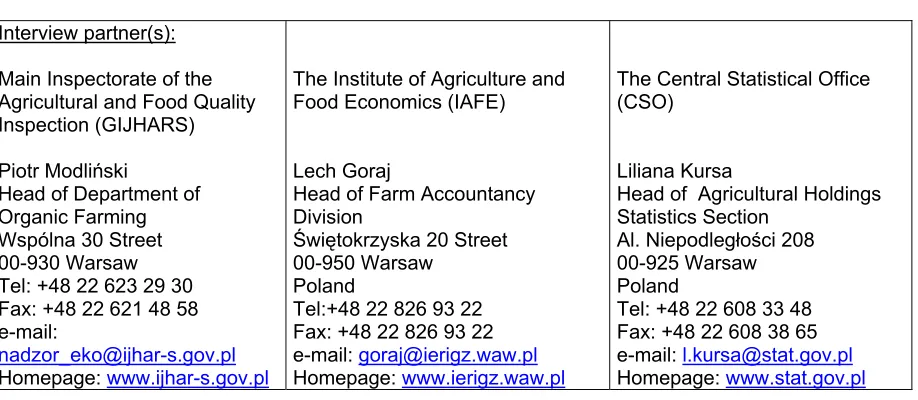
The Agricultural and Food Quality Inspection, which is the supervision agency for certification bodies in Poland, is involved in the development a DCPS gathering administrative data according to Council Regulation (EEC) No 2092/91. The main task of the DCPS being investigated was the development of a specific database named “Computer system for organic production, registration, inspection and certification”, which will become operational in 2005. Particular attention was also paid to the links with other data sources on organic farming at the production level, Interview partner(s):
Main Inspectorate of the Agricultural and Food Quality Inspection (GIJHARS) Piotr Modliński
Head of Department of Organic Farming Wspólna 30 Street 00-930 Warsaw Tel: +48 22 623 29 30 Fax: +48 22 621 48 58 e-mail:
[email protected] Homepage: www.ijhar-s.gov.pl
The Institute of Agriculture and Food Economics (IAFE)
Lech Goraj
Head of Farm Accountancy Division
Świętokrzyska 20 Street 00-950 Warsaw
Poland
Tel:+48 22 826 93 22 Fax: +48 22 826 93 22 e-mail: [email protected] Homepage: www.ierigz.waw.pl
The Central Statistical Office (CSO)
Liliana Kursa
Head of Agricultural Holdings Statistics Section
Al. Niepodległości 208 00-925 Warsaw Poland
especially the FSS conducted by the Central Statistical Office and the FADN, for which the Institute of Agriculture and Food Economics is responsible. Plans also exist to set up a common identification number for farms and enterprises in order to link various data sources and make them comparable. Therefore one task was to evaluate how the institutions involved in administrative and statistical data collection view the advantages and disadvantages of the establishment of a common identification number.
The Agricultural and Food Quality Inspection was established by virtue of the act of 21 December 2000 on the commercial quality of agri-food products and reports to the Minister of Agriculture and Rural Development. With Poland’s accession to the European Union, the act of 20 April 2004 on organic farming (O.J. No. 93, item 898), defining tasks and competencies of official bodies and organisational units in respect of organic farming, became operational.
The main tasks of GIJHARS include, among others:
o to supervise the quality of agri-food products in production and marketing
including exported and imported goods,
o to evaluate the quality of agri-food products including their certification, o to control storage and transport conditions of agri-food products, o to collect and process data on agricultural markets,
o to cooperate with organisational units related to the Common Agricultural
Policy,
o to conduct training on regulations and requirements related to the commercial
quality or determination of quality classes as well as on examination methods of agri-food products,
o to define and perform specific tasks resulting from the act on organic farming.
As the Polish system of inspection and certification by law is partly a private and partly a governmental responsibility, the following institutions are responsible for its enforcement:
o the Minister of Agriculture and Rural Development authorises certification
bodies to perform inspections, and subsequently to issue and withdraw certification;
o the Main Inspectorate of the Agricultural and Food Quality Inspection
(GIJHARS) supervises certification and inspection bodies;
o certification bodies (CB) obtain data on organic farms and processing plants,
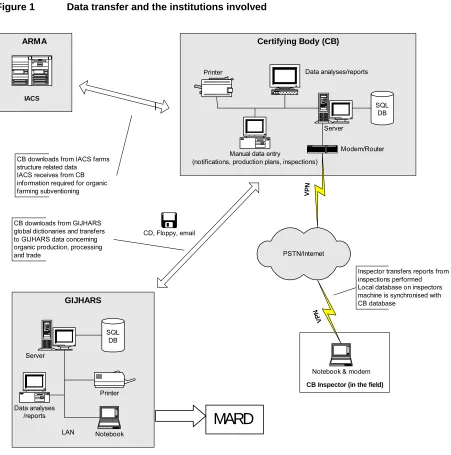
Figure 1 Data transfer and the institutions involved
GIJHARS
Certifying Body (CB)
CB Inspector (in the field)
PSTN/Internet Server
SQL DB
Notebook & modem Modem/Router
V P N
Data analyses/reports
Manual data entry
(notifications, production plans, inspections) Printer
V
PN
SQL DB
Server
Data analyses /reports
Printer
Notebook LAN
ARMA
Inspector transfers reports from inspections performed Local database on inspectors machine is synchronised with CB database
IACS
CB downloads from IACS farms structure related data IACS receives from CB information required for organic farming subventioning
CB downloads from GIJHARS global dictionaries and transfers to GIJHARS data concerning organic production, processing and trade
CD, Floppy, email
Glossary:
GIJHARS The Main Inspectorate of the Agricultural and Food Quality Inspection ARMA Agency for the Restructuring and Modernization of Agriculture
IACS Integrated Administration and Control System CB Certification bodies
MARD Ministry of Agriculture and Rural Development
Within its supervision activities, the Main Inspectorate of the Agricultural and Food Quality Inspection
o performs an analysis of the data provided by the certification bodies, o controls the certification bodies,
o may require from the certification bodies any additional information necessary
for the effective supervision of organic producers,
o may control organic producers.
By 31 January each year all certification bodies are obliged to send a list of inspected producers to GIJHARS as well as to report on their inspection and certification activities.
With the aim of improving DCPS on the farm level, the Main Inspectorate of the Agricultural and Food Quality Inspection (GIJHARS) participated in the PHARE project PL 01.04.04 “Organic Farming”, within which a specific “Computer system for recording, certification and inspection for organic farming” was developed. It is planned, that the DCPS will cover all operators in the organic food chain, starting with producers and ending with retailers (e.g. canteens). The main aim of this new system is to:
o enable the recording of the activities of organic farms and companies in plant
and animal production, processing, import of organic products, the collection of wild plants and the marketing of organic products;
o support the process of issuing and recording of certificates;
o register annual production plans for plant and animal production, processing,
collecting (e.g. wild herbs) and import by certification bodies;
o support the planning and implementation of the inspection process as well as
the facilitation of data recording and storage;
o enable the required information transfer from the certification bodies to the
Agency for the Restructuring and Modernisation of Agriculture (ARMA) as a basis for the public support programme for organic farming;
o enable data transfer from the certification bodies to GIJHARS.
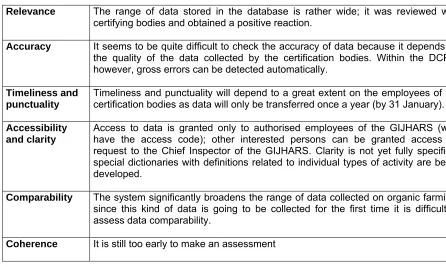
[image:18.595.65.511.399.666.2]The following table provides an assessment of data quality based on the interviewees’ opinions and expert assessment.
Table 4 Assessment of data quality for GIJHARS (farm level)
Relevance The range of data stored in the database is rather wide; it was reviewed with
certifying bodies and obtained a positive reaction.
Accuracy It seems to be quite difficult to check the accuracy of data because it depends on
the quality of the data collected by the certification bodies. Within the DCPS, however, gross errors can be detected automatically.
Timeliness and punctuality
Timeliness and punctuality will depend to a great extent on the employees of the certification bodies as data will only be transferred once a year (by 31 January).
Accessibility and clarity
Access to data is granted only to authorised employees of the GIJHARS (who have the access code); other interested persons can be granted access on request to the Chief Inspector of the GIJHARS. Clarity is not yet fully specified, special dictionaries with definitions related to individual types of activity are being developed.
Comparability The system significantly broadens the range of data collected on organic farming;
since this kind of data is going to be collected for the first time it is difficult to assess data comparability.
2.2 Farm level (income)
2.2.1 DEFRA – United Kingdom
DEFRA Economics Division is normally responsible for this area of activity, but has not been actively involved in the analysis of organic farming incomes. P1 is currently contracted to collect supplementary data and to analyse the combined organic farming data set, but the contract is due to expire in early 2006. The intention is that the data collection work will be fully integrated with Farm Business Survey activities from 2006, but this requires a review of the identification and composition of the organic sample within FBS to ensure representative data is obtained.
At the moment data is being collected directly by the IRS (P1) Farm Business Survey team from ca. 70 holdings across England and Wales for the periods 2001/02 to 2003/04, with an extension to cover 2004/05 likely. Previous work (separate projects) has covered the periods 1994/5 to 2000/01. The aim is to ensure that, for each of the main holding types, a minimum sample size of 10-12 holdings is achieved. For pigs, poultry and some horticultural holdings, only enterprise data (gross margins) is being collected as very few organic specialist holdings of this type exist.
Data collected by other FBS Centres (as part of the normal FADN sample) are supplied to IRS by DEFRA for inclusion in the analysis. This is helping to significantly increase the number of holdings that can be analysed, but there are also some limitations to this data.
Comparative data for the combined samples of data collected directly by IRS and by other FBS Centres are also extracted from the data supplied to IRS by DEFRA, using a modified (non-Euclidean) clustering procedure. This procedure is described in detail in the annual project reports.
Until now, results have been published on the Organic Centre Wales website (www.organic.aber.ac.uk) as downloadable PDF files. However, agreement in principle has now been reached with DEFRA that all reports will be published on the DEFRA website (organic farming statistics section) and it is hoped that this will take place by end of July 2005 (these reports will go onto organic E-prints as well).
The following table provides an assessment of data quality based on a review of current issues by the P1 team carrying out the surveys.
Table 5 Assessment of data quality DEFRA (farm income level)
Relevance High – financial data is important both for producer decision-making and for
determining support levels under the organic farming scheme.
Accuracy The detailed survey procedure involves direct access to farmers’ accounts
and bank statements, so that there is a high degree of accuracy involved.
Timeliness and punctuality
data available in June 2006, but in the long term the main solution would be full integration of data collection in the main Farm Business Survey
Accessibility and clarity
Data are published according to clear definitions, and with publication on the DEFRA website accessibility will also be high.
Comparability Because Farm Business Survey/FADN procedures are adopted for the survey, the data are fully comparable with other FADN results. The methods developed to select comparable conventional holdings have also helped to improve the level of comparability between groups of organic and other farms.
Coherence This is currently low because of the different projects which have supported
data collection in the past. However, as the current project progresses, the situation will be improved.
2.2.2 The Institute of Agriculture and Food Economics (IAFE) - Poland
The Institute of Agriculture and Food Economics is an independent scientific establishment created in 1983. It mainly conducts empirical research related to the analysis of the national agro-economy and its segments, including the market for agri-food products, the economics of agricultural holdings as well as production means. In addition, it deals with companies and traders involved in the food industry, the effects of ownership transformation, spatial aspects of food economy, social change occurring among the rural and agricultural population and the influence of the accession to the European Union.
The establishment of a DCPS on farm incomes is coordinated by the IAFE, integrating accountancy offices, accountancy advisors and farmers on the basis of annual agreements. It was assumed at first that the manager of the accountancy office at the regional (Voivodeship) level would conclude a collective agreement with IAFE to collect data from randomly selected farms according to their location. The act of the 29 November 2000 on the collection and use of accountancy data from agricultural holdings specifies that the accountancy office, with which the agreement to collect data is concluded, must guarantee objective and reliable transfer of accountancy data. It was decided that from 2005 the function of accountancy office would be taken over by Agricultural Advisory Centres which are controlled by the Voivode.
It is assumed that the institutions currently cooperating with farmers can take on the function of accountancy offices on the regional level, namely:
o the Regional Advisory Centres for Agriculture and Rural Development – under
the aegis of the Minister of Agriculture and Rural Development;
o the Agricultural Advisory Centres – under the aegis of the Voivode; o the Regional Agricultural Chambers – independent institutions.
representative agricultural holdings. In order to obtain high quality data, a separate data quality control system was developed specifically for that purpose. Independently, data are entered into a European database RICA 1 and a test of accountancy data included in the Farm Returns is carried out. Within this process there are also checks on calculation errors, missing data and unacceptable values. Data which contain certain or likely errors are returned to IAFE to be verified. On the basis of the data accepted into the collective database, the team responsible for the FADN draws up reports containing standard results and special analyses. The procedures applied provide for the use of resulting values calculated according to unified formulas, regardless of those applied in individual Member States.
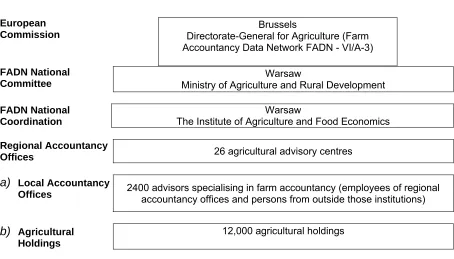
Figure 2 Organisational structure of FADN in Poland
European Commission
Brussels
Directorate-General for Agriculture (Farm Accountancy Data Network FADN - VI/A-3)
FADN National Committee
Warsaw
Ministry of Agriculture and Rural Development
FADN National Coordination
Warsaw
The Institute of Agriculture and Food Economics
Regional Accountancy
Offices 26 agricultural advisory centres
a) Local Accountancy
Offices 2400 advisors specialising in farm accountancy (employees of regional accountancy offices and persons from outside those institutions)
b) Agricultural
Holdings
12,000 agricultural holdings
The following table provides an assessment of data quality based on the interviewees’ opinions and expert assessment.
Table 6 Assessment of data quality IAFE (farm income level)
Relevance Data standards were defined in the regulation addressing the FADN issues
(Regulation 79/65/EEC of 15 June 1965); relevance is good
Accuracy Data are precise, controlled by special computer systems and, before that, also
by an advisor who verifies the data just after the control on the farm
Timeliness and punctuality
Timeliness and punctuality are satisfactory; all issues are specifically determined in laws and regulations
Accessibility and clarity
Accessibility of data is restricted to authorised persons. The clarity of data is good, intelligible definitions and terms are used and are defined in the annex to the regulation
Comparability Data are fully comparable as they derive from a permanent survey that has
been conducted for many years using the same accounting period
2.3 Price level
2.3.1 ZMP- Germany
The ZMP producer and wholesale market price reporting covers most of the important agricultural product groups, with data normally gathered weekly. For conventional products data collection is carried out by separate departments (for fruit and vegetables; animals and meat; poultry, milk and milk products; arable crops) and whereas for most products only prices are collected, for some quantities are also recorded (e.g. for processed products). Prices are collected at different marketing levels depending on the particular market structure. As well as data collection from wholesale markets, information on prices is also gathered directly from producers, for example on direct marketing activities, sales to retailers and/or wholesalers, from producer organisations, packaging stations, slaughterhouses and from mills or dairies. Data are also collected according to some other criteria such as the marketing level (consumer, retailer, processor, and wholesaler) or according to product specific criteria (quality, size, packaging units and origin). Within the DCPS it is also possible to differentiate the data according to administrative units (e.g. federal states).
Data on organic product prices are not usually integrated into the conventional price collecting DCPS, nor are they distinguishable from total data. Instead for most product groups a separate DCPS is run by the Department of Organic Farming in the ZMP. There are a few exceptions where data on organic markets are gathered by conventional systems as well (e.g. for apples, carrots, chicken, milk prices and pig prices). The main reasons for not integrating organic data collection into total data collection were:
− a very low market share of organic products (< 2 % in DE);
− organic products are not traded on traditional wholesale markets/ producer organisations; organic markets usually have their own distribution structure;
− conventional market participants are not interested in organic market data; − insufficient human resources in the conventional departments;
− organic market participants are not interested in providing data to the conventional market; they fear a decline in price when having to compete with conventional markets.
The frequency of price data collection for organic products depends mainly on the market situation: prices for fruits, vegetables, herbs and potatoes are collected weekly, prices for cereals and milk monthly, and meat prices on a quarterly basis. In most product groups it is possible to compare conventional and organic data.
Interview partner(s):
Antje Kasbohm, Administration Markus Rippin, Department of organic farming
Hans-Theo Erkes, Department Manager
Contact details:
ZMP Zentrale Markt- und Preisberichtstelle für
Erzeugnisse der Land-, Forst- und Ernährungswirtschaft GmbH
Wholesale price reporting on organic fruits and vegetables
Price reporting on fruit and vegetables, the “wholesale price analysis”, was established at the beginning of the 1990s. Today price reporting on fruit and vegetables is based on reports from 150 fruit and 190 vegetable registration assets indicating their prices. However, this figure relates to more producers than the number of registration assets would imply at first sight since many registration assets report prices for several farms. The price reporting involves organic farms and producer cooperativesas well as purchasing wholesalers. The organic farms forward their sales prices to the (purchasing) wholesalers on a weekly basis. The prices of the purchasing wholesalers (wholesale cost prices) are reported weekly and are also integrated in the DCPS. In order to allow an adequate assessment, prices for the producing farms are weighted on the basis of their cultivated area and for processors on the basis of their processed quantities. Wholesale cost prices are weighted according to the estimated sales of the particular wholesaler.
The product range covers the entire domestic assortment of fruit and vegetables. Therefore not only generic products like ‘lettuce’ are being registered, but also the type such as ‘iceberg’, ‘Batavia’, etc. Depending on the product, differentiation may also be in terms of the size of the package, but price reporting on conventional fruits and vegetables is consistently more specific. With approximately 1,500 hectares of a total organic vegetable growing area of approx. 8,200 hectares and approximately 1,350 hectares of the total organic fruit growing area of approx. 4,600 hectares, the DCPS on organic prices is generally representative for most products.
Organic product prices are published in a weekly market report (ÖKOMARKT-Forum) and via an on-line-service allowing access to the price database. The report only allows a limited comparison between conventional and organic product prices since on the conventional data are collected at a different market level (wholesale cost prices versus wholesale sale prices).
Special software was developed for collecting data on organic prices and this is being continuously refined. The software is based on an SQL database with interfaces to Microsoft Access and VBA programmes which provides for many types of analysis. The database will be improved and simplified over the next five to ten years. Data from other systems (e.g. conventional price reporting on wholesale prices) can be input automatically and results can be published in a standardised format directly to the internet. Alongside an extensive acquisition module, the software will also support a computer-aided plausibility check and, in addition to this, an expert check will be carried out by ZMP staff. Moreover, the data will also be compared with data from other sources.
comparison based on data provided by almost all the organic wholesalers is more representative for the wholesale trade.
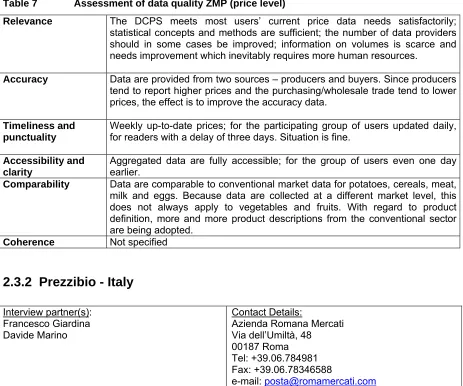
Table 7 Assessment of data quality ZMP (price level)
Relevance The DCPS meets most users’ current price data needs satisfactorily; statistical concepts and methods are sufficient; the number of data providers should in some cases be improved; information on volumes is scarce and needs improvement which inevitably requires more human resources.
Accuracy Data are provided from two sources – producers and buyers. Since producers tend to report higher prices and the purchasing/wholesale trade tend to lower prices, the effect is to improve the accuracy data.
Timeliness and punctuality
Weekly up-to-date prices; for the participating group of users updated daily, for readers with a delay of three days. Situation is fine.
Accessibility and clarity
Aggregated data are fully accessible; for the group of users even one day earlier.
Comparability Data are comparable to conventional market data for potatoes, cereals, meat,
milk and eggs. Because data are collected at a different market level, this does not always apply to vegetables and fruits. With regard to product definition, more and more product descriptions from the conventional sector are being adopted.
Coherence Not specified
2.3.2 Prezzibio - Italy
Interview partner(s): Francesco Giardina Davide Marino
Contact Details:
Azienda Romana Mercati Via dell’Umiltà, 48 00187 Roma Tel: +39.06.784981 Fax: +39.06.78346588
e-mail: [email protected] www.romamercati.com
The Azienda Romana Mercati (ARM) is a special agency of the Chamber of Commerce of Rome established to develop and promote the agri-food sector. The objective of ARM is to promote and increase the value of the agri-food sector in the province of Rome and to provide specific development services. Furthermore, ARM undertakes initiatives, research and studies to develop the agricultural sector in general, supplies special services to farms, is involved in Rome’s commodities and foodstuff exchange and collaborates with other public and private organisations in developing projects within the sector. The projects managed by Azienda Romana Mercati, including the Prezzibio initiative (www.prezzibio.it) which is the object of the Italian case study, are mainly financed by the Chamber of Commerce of Rome.
Distributors Producers
Hypermarkets Specialized retailers
Surveyor in 12 points of sale
Questionnaires
every 30 days
DAT
A
PROCESSING
Quality control of data
D I F F E R E N T D E L I V E R A B L E
Lists
every 15 days
Analysis
D
A
TA CO
LL
ECTIO
N
Publication on www.prezzibio.it
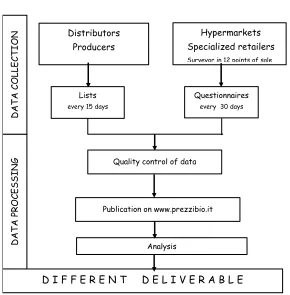
sector. The Prezzibio initiative creates various price lists, including production and distribution level prices for the organic fruit and vegetable sector and consumer level prices for milk, cheese, eggs, cereals, pulses, flour, pasta, oils and other dressings, beverages and fruit juice, tea and coffee. Every price list contains at least the minimum, maximum and average prices for each product quoted as well as some general information on market trends.
Data collection at the production level is mainly done through the involvement of and consultation with the main organic operators throughout Italy (distributors, co-operatives, producers, specialised retailers, supermarkets). The aim of this massive stakeholder involvement is to ensure that the data are representative. Producers and traders send their price lists and quotations to the initiative, and a final (average) price list is published on the internet every fortnight. In order to ensure data quality, only prices which appear in at least three different price lists are published.
[image:25.595.153.443.383.678.2]At the consumer level, price lists are produced using specific surveys run in twelve points of sale in the major Italian cities, each representative of its sector. The data collection questionnaires are the same for different points of sale and obtain the minimum, average and maximum prices for each type of product. Both specialised retail shops and supermarkets are included and each month the Prezzibio publishes two price reports, one for specialised retail sales and one for supermarkets.
Figure 3 PREZZIBIO: data collection structure
The lack of common protocols for data collection at the production and distribution levels creates problems in defining prices for product categories that are not included in all producer and distributor lists. Therefore, until now it is only possible to provide information on the most important product groups.
o price comparisons between organic and conventional products sold in
supermarkets;
o an index of market instability derived from the difference between minimum
and maximum prices at various stages;
o price increases along the food chain as an index of added value in the various
commercial stages;
o price trends over time for every product;
o price comparisons between supermarkets and specialised retailers.
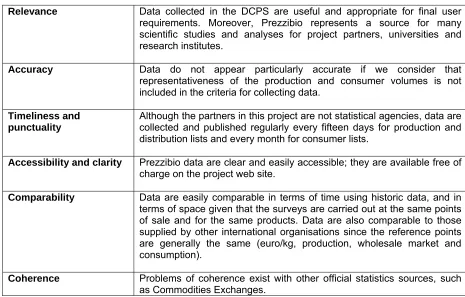
[image:26.595.63.528.261.558.2]The following table provides an assessment of data quality based on case study results and expert evaluation:
Table 8 Assessment of data quality for Prezzibio (price level)
Relevance Data collected in the DCPS are useful and appropriate for final user
requirements. Moreover, Prezzibio represents a source for many scientific studies and analyses for project partners, universities and research institutes.
Accuracy Data do not appear particularly accurate if we consider that
representativeness of the production and consumer volumes is not included in the criteria for collecting data.
Timeliness and punctuality
Although the partners in this project are not statistical agencies, data are collected and published regularly every fifteen days for production and distribution lists and every month for consumer lists.
Accessibility and clarity Prezzibio data are clear and easily accessible; they are available free of
charge on the project web site.
Comparability Data are easily comparable in terms of time using historic data, and in
terms of space given that the surveys are carried out at the same points of sale and for the same products. Data are also comparable to those supplied by other international organisations since the reference points are generally the same (euro/kg, production, wholesale market and consumption).
Coherence Problems of coherence exist with other official statistics sources, such
as Commodities Exchanges.
2.4 Trade (including Import/Export)
2.4.1 DEFRA (P1)
confidentiality are addressed by disclosure rules which require a minimum of five cases (i.e. five different importers per product) before data can be published.
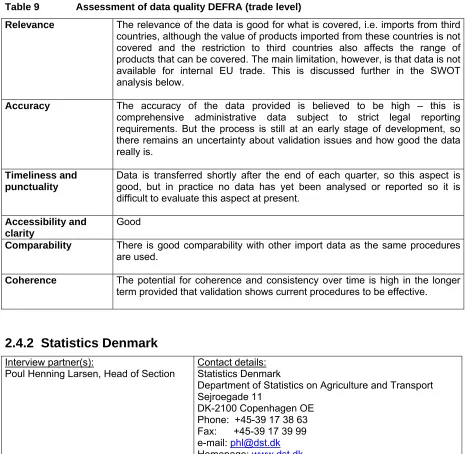
[image:27.595.66.531.151.605.2]The following table provides an assessment of data quality based on the interviewee’s opinions and expert evaluation.
Table 9 Assessment of data quality DEFRA (trade level)
Relevance The relevance of the data is good for what is covered, i.e. imports from third
countries, although the value of products imported from these countries is not covered and the restriction to third countries also affects the range of products that can be covered. The main limitation, however, is that data is not available for internal EU trade. This is discussed further in the SWOT analysis below.
Accuracy The accuracy of the data provided is believed to be high – this is
comprehensive administrative data subject to strict legal reporting requirements. But the process is still at an early stage of development, so there remains an uncertainty about validation issues and how good the data really is.
Timeliness and punctuality
Data is transferred shortly after the end of each quarter, so this aspect is good, but in practice no data has yet been analysed or reported so it is difficult to evaluate this aspect at present.
Accessibility and clarity
Good
Comparability There is good comparability with other import data as the same procedures
are used.
Coherence The potential for coherence and consistency over time is high in the longer
term provided that validation shows current procedures to be effective.
2.4.2 Statistics Denmark
Statistics Denmark (DS) was established as a governmental institution in 1850 and its activities are founded on the Act on Statistics Denmark, adopted in 1966. This Act gives an independent Board of Governors the responsibility to determine the institution’s work programme and it allows Statistics Denmark access to data from all public administrative registers in Denmark. In comparison with many other countries the production of statistics in Denmark is highly centralised, but there are other national suppliers of statistics as well as Statistics Denmark, such as municipal authorities and other government departments. However, Statistics Denmark is responsible for ensuring that the overall statistical picture is complete and coherent regardless of the source.
Interview partner(s):
Poul Henning Larsen, Head of Section Contact details: Statistics Denmark
Department of Statistics on Agriculture and Transport Sejroegade 11
DS takes part in the joint European statistical programme within the framework of the European Union. It is also involved in other international activities, e.g. in cooperation with some Nordic countries, as well as with the UN and UN organisations. Moreover Statistics Denmark cooperates with other international organisations such as the OECD, IMF, and ILO etc. Statistics Denmark is organised in four departments: Social Statistics, Business Statistics, Economic Statistics and User Services. The Department of Statistics on Agriculture and Transport is part of Business Statistics. Statistics Denmark is financed by the government, but specific studies may be funded by other public institutions. The study ‘Turnover of organic foods in retail shops’ carried out in 2003/2004 was funded by the Directorate for Food, Fisheries and Agri Business under the Ministry of Food, Agriculture and Fisheries.
Statistics Denmark has collected information on organic agriculture since 2001. The data collected annually include information on:
o number of organic farms according to size and type of production;
o size of organic farming area according to type of plant production and regional
distribution;
o number and types of animal units and livestock farms according to farm size
and regional distribution;
o number of dairy farms and amount of milk delivered to dairies; o number of organic eggs produced for direct consumption; o operating income of in-conversion and organic farms.
For the collection of data on organic farming, processing, consumption and trade, Statistics Denmark’s main collaborators are the following public and private institutions:
o Danish Veterinary and Food Administration (responsible for the inspection of
organic processors, wholesalers and retailers) www.fvst.dk
o the Plant Directorate (responsible for the inspection of organic farms and
farming input processors and trade companies (feed, seed, fertilizers, etc.)
www.pdir.dk
o Danish Research Institute of Food Economics www.foi.dk o Directorate for Food, Fisheries and Agro Business www.dffe.dk o Danish Agricultural Advisory Service www.lr.dk
o on the international level, Statistics Denmark co-operates with Eurostat for
statistics on organic production http://epp.eurostat.cec.eu.int.
In connection with the Danish survey ‘Foreign Trade in Organic Products 2003’, carried out by Mr Poul Henning Larsen in 2003, he has prepared a report which was partly financed by Eurostat under Theme 66: Agro-industrial statistics. The title of this study is ‘Implementation of Statistics on Products with Distinctive Marks – Foreign trade statistics in organic products with special focus on methodological aspects’. The report is due to be published in June 2005.
covering trade with EU member states and trade with third party countries, but in these surveys there is no discrimination between organic and conventional products.
By combining the information from the two data sources on foreign trade referred to above with the information on farms, factories, processors, wholesalers and other enterprises registered by the two national organic certification and inspection bodies, the Plant Directorate and the Veterinary and Food Administration, it should be possible to develop a statistical model for foreign trade in organic products for Denmark.
The statistics for trade with other EU countries have been collected since 1993 and the system is based on monthly reporting of data from about 10,000 companies in Denmark with total annual imports of at least 1.5 (0.2) and/or exports of at least 2.5 (0.33) million DKK (€) each. For each transaction (import or export) the following statistical information is collected:
o product code from the Combined Nomenclature (CN)
o partner country (import = country of origin; export = country of destination) o type of transaction
o invoice value in DKK
o net weight in kilos and/or other appropriate unit, e.g. litre, piece, etc.
The trade between Denmark and third countries is calculated on the basis of reports to the Danish Customs and Tax Administration. Every third party country trade transaction must be reported, so the statistics cover all trade with third party countries. The data are collected on a monthly basis. For minor transactions below 7,500 DKK ~ 1,000 € and 1,000 kg, there is a simplified form of reporting. For each import/export transaction, the following statistical information is collected:
o product code in accordance with the EU Combined Nomenclature (CN-8) or
TARIC - only for import (Integrated tariff of the European Communities (TARIC), Official Journal C103/1 of 30.04.2003).
o partner country (import = country of origin; export = country of destination) o code for procedure
o equivalent value in DKK
o net weight in kilos and perhaps a supplementary unit, e.g. litre, piece, etc. o form of transport when crossing the frontier.
The Plant Directorate is the only certification and inspection body for organic farms, feed companies and other enterprises (fertilisers, seed etc.) dealing with inputs to organic farmers and output other than food products, while the Veterinary and Food Administration is the only certification and inspection body for food processors and enterprises packaging and marketing organic food products plus wholesalers and retailers (http://www.uk.foedevarestyrelsen.dk/Food/Organic_Foods/forside.htm).
The in-conversion and certified organic farms and farm input enterprises controlled by the Plant Directorate report annually on their activities and, for each product category, state whether the organic products are processed, stored, sold on the national market or imported and/or exported. The list of enterprises dealing with inputs (i.e. fertilizers, seed, feed etc) can be found on the internet at
Veterinary and Food Administration, and they are controlled by the eleven regional Veterinary and Food Administration offices. The Veterinary and Food Administration keeps a register of the certified enterprises, but amounts or value of the products produced or processed are not recorded. The list of enterprises dealing with certified organic products, updated on a weekly basis, can be found on the internet at
http://www.foedevarestyrelsen.dk/sdata/Oekologikontrollerede.pdf.
Enterprises must be approved before they can trade in organic products. Imports from EU member states plus the EFTA countries, Iceland, Norway, Switzerland and Lichtenstein are recorded separately from imports from third countries. For imports from EU and EFTA countries, documentary evidence is needed to show that the vendor is controlled by a certified inspection body in their home country together with an original invoice from the vendor proving the organic status of the goods. The import does not need to be reported to the Plant Directorate, but import of organic food products from the EFTA countries must be reported to the Veterinary and Food Administration. Imports of organic products from third countries must be reported to the Plant Directorate before they reach Denmark. Since 2002 the Plant Directorate has kept copies of the export certificates which contain information on product type and amount. The Food and Veterinary Administration does not collect information on amounts imported from third countries, but registers only the approvals given for import of organic food products directly into Denmark. Danish enterprises authorised for organic production and/or sale may export their products without reporting anything.
By the end of 2003 about 3400 farms/enterprises (legal units) were registered in the Plant Directorate and almost 500 enterprises (legal units) in the Veterinary and Food Administration. Matching this information with the information in the foreign trade register of Danish Statistics, it turned out that 226 of the enterprises could have been involved in foreign trade in organic products and the population for the survey was therefore reduced from 3900 to 226 enterprises. The 226 enterprises received a questionnaire with the information they had reported to the foreign trade statistics registers and were asked to report the proportion of the turnover in DKK and kg relating to the import/export of organic products and which countries were involved in the transactions. Of the 226 enterprises, 121 had been involved in foreign trade. The period covered by the survey was 2003 and it has not been repeated since then. The value in DKK of imported/exported organic products classified according to 14 commodity groups has been published together with information on import and export to and from the EU-15, the most important EU countries in foreign trade with Denmark, the rest of Europe, Africa, North and South America, Asia and Oceania. The data were published in the ‘Survey on Foreign Trade in Organic Products 2003’ by Poul Henning Larsen, Statistics Denmark, (in Danish) in Statistiske Efterretninger 2004:25 of 29 November 2004.
Table 10 Assessment of data quality Statistics Denmark (trade level)
Relevance The DCPS is very relevant for market and policy stakeholders, organic certifiers,
companies involved in foreign trade in organic products, ministries administrating trade in agricultural products, market researchers and news media as well as for the European Commission and Eurostat, the UN and OECD. Statistics on foreign trade in organic products had not been produced before in Denmark.
annual imports of at least 1.5 million DKK (0.2 million €) and/or exports of at least 2.5 million DKK (0.33 million €). These limits have been set by Denmark in accordance with the EU regulation 1901/2000 dealing with intra-trade statistics. Estimates of the volume of intra-trade below this threshold and non-reported trade are based on fiscal information. In the survey of foreign trade in organic products the figures have been supplemented with information based on estimates from the VAT return, which covers all transactions in goods between Denmark and the EU member states.
The accuracy of the data on foreign trade with third countries is very high because all transactions above 1000 € or 1000 kg are included. The statistics on third countries are regulated by EU regulation 1917/2000 on extra-trade statistics.
However, the accuracy of the survey on foreign trade in organic products 2003 was subject to considerable uncertainty, as 15–20% of the data was either missing or so unreliable that the figures could not be included in the survey. To make up for this, supplementary estimates were made based on VAT figures. Therefore the final total figures are considered very reliable, but the detailed figures are not reliable. It is estimated that the uncertainty with respect to the detailed figures distributed by commodity country is of the order of c. 10% on average, corresponding to the supplement made to the reports from the VAT figures.
Timeliness and punctuality
According to EU regulation 1917/2000, the extra-European monthly trade statistics should be transmitted to the Commission (Eurostat) no later than six weeks after the end of the reference period. For intra-European trade statistics, EU regulation 1901/2000 requires the monthly statistics to be submitted to the Commission (Eurostat) no later than eight weeks after the end of the reference period for overall results and no longer than 10 weeks for detailed results.
It is not necessary to publish data on foreign trade in organic products on a monthly basis - annual data collection is more realistic.
Preliminary annual foreign trade statistics are available in May in the following year but since processing and quality checking of the data reported by the enterprises involved in the export/import of organic products takes considerable time, Statistics Denmark cannot publish the results until October or November of the following year.
Accessibility and clarity
The statistics on foreign trade are published in the monthly publication “Nyt fra Danmarks Statistik” (News from Statistics Denmark), in the monthly series, “Statistiske Efterretninger” (Statistical News), in the quarterly series “Statistiskservice” (Statistics Service) and in the monthly “Konjunkturstatistik” (Main Indicators). These publications are available to the public, but they are not free of charge. Statistics on foreign trade are also available in English from StatBank Denmark www.statbank.dk free of charge.
The 12-page ‘Survey on Foreign Trade in Organic Products 2003’ was published (in Danish) in Statistiske Efterretninger 2004:25 of 29 November 2004, and it can be bought from Danish Statistics for 37 DKK ~ 5 €.
Comparability Comparability over time: any gaps in the time series as a result of changes in
collection methods etc. are adjusted for by estimates to ensure that the foreign trade figures are comparable over time. Data comparability does not apply at the most detailed commodity level because the content of many product codes has changed over time.
Comparability with other statistics: the foreign trade figures are comparable with several other sources:
• The partner country’s recording of the same transaction (the mirror transaction). The comparison is hampered by differences in definitions and in the level of value for the recording of imports and exports. Payments in connection with foreign trade in products. Different basis of accrual and differences in valuation hamper comparison
The nomenclature used in the survey on foreign trade with organic products 2003 is the combined EU Nomenclature (CN-8). To improve the comparison of international statistical surveys the information has been published according to the UN International Trade Classification (SITC)
Coherence Apart from the foreign trade statistics information on external trade can be found in:
• the national accounts
• the business statistics
• the balance of payments which must relate to one another.
The share of estimated figures is in the order of 15–20 %, when the statistics are first published. There are some differences between the first and the final publication of foreign trade figures for any given month because the inaccurate data are checked and adjusted against information from VAT returns and other sources in the final publication.
For further information on the quality of foreign trade statistics in the EU and Denmark, can be found at:
o Foreign Trade Statistics – Quality Report: Foreign trade, European
Commission Working Papers and Studies, Theme 6. 2003 edition)
http://epp.eurostat.cec.eu.int/cache/ITY_OFFPUB/KS-AS-03-001/EN/KS-AS-03-001-EN.PDF
o Danish external trade statistics 2003
http://www.dst.dk/asp2xml/external/external.asp?title=Danish%20External%20Trade %20Statistics%202003&hreflang=da&path=/Vejviser/Portal/Udenrigshandel/METOD E/omudenrigshandelsstatistik.aspx&ancestor=Statistik&file=/upload/danish_external_ trade_statistics_2003.pdf
o The quality of foreign trade figures, prepared by Danish Statistics’ External
Trade Division, July 1, 2001
http://www.dst.dk/asp2xml/external/external.asp?title=QualityReport&hreflang=da&pa th=/Vejviser/Portal/Udenrigshandel/METODE/kvalitetsrapporter.aspx&ancestor=Statis tik&file=/upload/qualityreport.pdf
2.5 Retailer/Consumer level
2.5.1 Statistics Denmark
Since 1939 Statistics Denmark has collected data and calculated an index for the turnover in retail shops, and by now this is available for 49 product categories. The surveys cover all retailers with an annual turnover of more than 10 million DKK including VAT plus a stratified sample of retailers with an annual turnover of between 2.5 and 10 million DKK including VAT. Statistics Denmark estimates that reporting from the retailers in the ‘Foods and other daily commodities’ group accounts for 85% of the total turnover in this group. The survey is carried out six times a year but organic and conventional products are not recorded separately.