Experimental Comparison of the
Comprehensibility of a UML-based Formal
Specification versus a Textual One
Rozilawati Razali, Colin F Snook, Michael R Poppleton, Paul W Garratt, Robert J Walters,
Dependable Systems and Software Engineering Group, School of Electronics and Computer Science, University of Southampton, University Road, Southampton SO17 1BJ, United Kingdom
{rr04r, cfs, mrp, pwg, rjw1}@ecs.soton.ac.uk
The primary objective of software specification is to promote understanding of the system properties between stakeholders. Specification comprehensibility is essential particularly during software validation and maintenance as it permits the understanding of the system properties more easily and quickly prior to the required tasks. Formal notation such as B increases a specification’s precision and consistency. However, the notation is regarded as being difficult to comprehend due to its unfamiliar symbols and rules of interpretation. Semi-formal notation such as the Unified Modelling Language (UML) is perceived as more accessible but it cannot be verified systematically to ensure a specification’s accuracy. Integrating the UML and B could perhaps produce an accurate and approachable specification. This paper presents an experimental comparison of the comprehensibility of a UML-based graphical formal specification versus a purely textual formal specification. The measurement focused on the efficiency in performing the comprehension tasks. The experiment employed a cross-over design and was conducted on forty-one third-year and masters students. The results show that the integration of semi-formal and formal notations expedites the subjects’ comprehension tasks with accuracy even with limited hours of training.
Keywords: Notation comprehensibility, semi-formal and formal notations, empirical assessment
1. INTRODUCTION
Specification is a fundamental software artefact as it captures what a system should do. It is the primary point of reference for people who deal with a system particularly during the validation and maintenance processes. Many stakeholders rely on their understanding of the software specification and hence comprehensibility is an important factor. Specification comprehensibility is defined as the ease of understanding of a specification. The notation used plays a vital role. The use of mathematical or formal notation in a specification increases its precision, which enables greater consistency and correctness to be obtained [1,2]. On the other hand, a formal notation can also cause comprehension difficulties [3-5]. The notation is seen as being difficult to comprehend due to the usage of unfamiliar symbols and underlying rules of interpretation that are not apparent to many practitioners.
The usefulness of graphical representation in software specification has been recognised for some time [6-8]. The representation is perceived as easy to understand quickly as it is easier to visualise the mapping of symbols to the real world objects they represent [9,10]. A purely graphical representation however is not as expressive as the textual representation as some aspects of system properties cannot be specified completely using just diagrams [11]. A combined graphical representation with supporting textual representation can assist visualisation while still achieving the full expressiveness and precision of a textual representation.
By integrating formal and semi-formal notations, practitioners could therefore benefit from both notations and representations. One of the ideas towards this integration is to combine the formal notation used in a formal method, namely the B method [12], and the semi-formal notation used in the Unified Modelling Language (UML) [13]. UML-B [14] is one such integration. The rationale behind this integration is that the B method has strong industrial supporting tools such as Atelier-B [15] and B-Toolkit [16], and the UML has become the de facto standard for system development [17].
method. The measurement used in the evaluation focused on the efficiency in understanding both notations and performing the required tasks. In the following paragraphs, Section 2 to 6 explains the technical aspects of the experiment’s preparation and execution. Section 7 discusses the data analysis and finally, Section 8 concludes the paper with a summary of the main findings and future work.
2. OBJECTIVES
The main objective of this experiment was to evaluate the comprehensibility of the notation contained in a UML-B model compared to a traditional B model. A UML-B model comprises the semi-formal notation used in the UML, namely the class and statechart diagrams, and the formal notation used in the B method, namely the B notation. A B model comprises only the B notation.
The experiment was conducted to confirm or refute a theory that suggests the notation used in the UML-B method has a particular effect on the practitioners, making it better in some way than the notation used in the B method. This also includes another related theory that suggests the integration of graphical and textual representations is more effective in portraying information [18]. In essence, a UML-B model comprises graphical and textual representations whereas a B model contains only textual representation. The experiment therefore attempted to answer the following broad research questions:
Is a UML-Bmodel easier to understand (that is, efficiency in understanding and performing the required tasks) than a B model for practitioners with limited hours of training?
Does the graphical notation (such as semi-formal notation) in concert with textual notation (such as formal notation) make a representation more effective in the context of practitioners’ understanding?
The standard statistical inference and hypothesis testing was adopted in this experiment. The testing involves the construction of null (H0) and alternative (H1) hypotheses. The null hypothesis stated for this experiment was:
H0 The UML-B model is no more comprehensible than the B model
to be rejected in favour of the alternative hypothesis:
H1 The UML-B model is more comprehensible than the B model
A one-sided alternative hypothesis was employed for this experiment. This is because the UML-B method can only be considered as worthwhile if its notation could overcome the current barriers against formal notation such as used in the B method. In other words, the UML-B model should be better than the B model in terms of notation comprehensibility. After all, this is the theory that the experiment aimed to confirm or refute by providing some empirical evidence.
3. DESIGN
The experiment had a related within-subject design where each of the subjects was trained and assigned a task on both models. As there were two treatments to be tested in the experiment, the subjects were allocated randomly into two groups; Group X and Group Y. To reduce variability across groups, the blocking and balancing techniques were applied. The subjects were blocked based on their ability on the object-oriented technology and formal methods. Each subject from each block was then randomly assigned to one of the groups. Each group therefore comprised a mixture of subjects from various blocks of ability. As the distribution was balanced between groups, both groups were considered as equivalent.
Despite being able to eliminate between subjects variability, there is always a possibility that the cross-over trial could introduce several effects particularly period and carry-over effects. Period effects concern the chances of detecting effects due to the period when the treatment is applied rather than the treatment itself. Carry-over effects are where one treatment affects the treatment in a subsequent session. The effect of carry-over is independent of the period effect. A period effect is one that occurs in a given period irrespective of the order in which treatments are given. A carry-over effect has its origin in a preceding treatment and is thus order-dependent. The implication of these effects on the data will be discussed in detail later.
4. VARIABLES
The main difference between experiment and other empirical assessment methods is through the notion of independent and dependent variables. This experiment identified the notations used in the models as its independent variable. The experiment aimed to examine the effect of the notations on model comprehensibility so the identified dependent variables were:
• Score (Accuracy): The mark obtained. Each question was given a specific allocation of marks. The marking was based on specific keywords expected from the answers. Marks were awarded for the presence of these keywords. The questions were carefully constructed so that the marks could be easily decided. Acceptable answers were prepared beforehand. One person did the marking so that there was consistency throughout the process.
• Time Taken: The time taken to answer each question in minutes, excluding time to read and understand the question.
The score was chosen as the measure of comprehension because the subjects could only answer a question correctly only if they understood the object being evaluated. To avoid the formulation of correct answers from wild guess or hunch, the questions were constructed in such a way that the subjects could only derive the answers from the models. The time taken was decided to be the other measure because software engineering is not just about developing correct products but developing products in a cost-effective way, where the cost is primarily determined by the consumption of development time and budget [20]. A technology is better than the other if it allows software engineers to do their tasks correctly in least possible time.
The focus of this experiment was efficiency in understanding the models and performing the required tasks. A model is considered more comprehensible than another if it allows the subjects to answer the questions accurately in a shorter time. The score and the time taken were therefore used to determine another important measure namely rate of scoring. The rate of scoring was obtained by dividing the score by the time taken. The rate of scoring is a more meaningful measure of model comprehensibility compared to the score or the time taken alone because it measures both the accuracy and the efficiency of comprehension.
In software engineering, the blend of technical and human behavioural aspects lends itself to combining qualitative and quantitative approaches [21]. In fact, obtaining the qualitative measures is important for human-based experiments since more than one interpretation can be placed on the data, which are not readily facilitated by the statistical approaches [22]. Therefore, the quantitative data collection for this experiment was supplemented with some qualitative measures. The qualitative measures included the subjective rating of model comprehensibility, the subjects’ preference between the model notations and the subjects’ personal comments on the models.
5. SUBJECTS
Forty-one students participated in the experiment. This included twenty-seven third-year Undergraduate students and fourteen Masters students of Computer Science and Software Engineering courses at the University of Southampton, United Kingdom. They were students from various continents including Europe, Asia and Africa. The international students constituted half of the subjects and the proportion of women to men was 1:4. There were twenty-one students in Group X and twenty students in Group Y. Group X consisted of thirteen Undergraduate students and eight Masters students, whereas Group Y had fourteen Undergraduate students and six Masters students.
subjects were aware that the experiment was intended for research purposes. They were initially concerned at their assessment being affected by the experiment. However, they were reassured by the small motivational mark associated with it, which was designed to reflect serious participation in the experiment rather than test performance.
The experiment adhered to the University’s ethical policies and guidance for conducting research involving human participants. The tasks performed in the experiment were aligned with the expectation of the course and had pedagogical values. The subjects were motivated to participate as the level of understanding tested in the experiment was considered to be necessary for them to do their coursework and prepare for the examination. It served both as revision on the B method and first practice on the UML-B method. The qualitative part of the experiment provided a space for reflection on the learning.One of the exam questions was designed to draw on such reflection.
The subjects were in the final semester of their respective courses and had reasonable amount of experience and knowledge of software development. They were the next generation of professionals. Thus, they represented closely the population under study; software developers.
6. MATERIALS AND PROCEDURE
6.1 Design of the Materials
The materials used in the experiment included models written in each notation and a questionnaire on each of the models1. There was also an instruction sheet that explained the steps required when performing the tasks. Since the experiment had two treatments to be examined in each of the two sessions, four models that represented two separate case studies were developed. In the first session, Group X was given a UML-B model and Group Y was given the equivalent B model on the first case study. In the second session, Group X was given a B model and Group Y was given the equivalent UML-B model on the second case study. Two separate case studies were needed to avoid learning effects. The models for the second session were made equivalent in complexity to the first session so that the treatment effect to be tested remained the same but different enough in subject matter to avoid confounding the second session with learning gained from the first session. In each case, there was one class diagram with four classes and two statechart diagrams with two states each in the UML-B model. On the other hand, there were five pages of scripts for each of the B models.
The measurement of model comprehensibility was based on the following comprehension competency criteria: (1) Interpret the symbols used in the notations
(2) Understand the relation between inputs and outputs (3) Understand the mapping between model and domain (4) Modify by changing and adding new features to the model
Criterion (1) was included because symbols play an important role in any notation especially in symbol-extensive notations such as employed in formal notations. Subjects should be able to identify the input parameters required and trace through the transition steps in the operations to identify the output. Therefore, criterion (2) was selected to assess this aspect. Criterion (3) was chosen because it is essential for ensuring any model’s accuracy and completeness; a quality that is expected from any specification [23]. Due to its importance, two questions were designed for this criterion. Maintenance involves modification by changing certain system elements and by adding new features. Maintainers should be able to execute these activities successfully if they understand the models. Hence, criterion (4) was included.
There were five questions for each model. The questionnaires on both UML-B and B models were similar to each other except for the question for criterion (1). This cannot be avoided as each model has its own unique symbols that are important for subjects to interpret in order to comprehend the models. The questions were open-ended in nature rather than multiple-choices. This allowed the subjects to derive the answers independently without being influenced by the given selections. The questions were made simple and straightforward in order to avoid any confusion caused by the words used or the way they were constructed. As the objective was to assess the subjects’ comprehension level, the questions were constructed using the comprehension keywords proposed in Bloom’s Taxonomy [24].
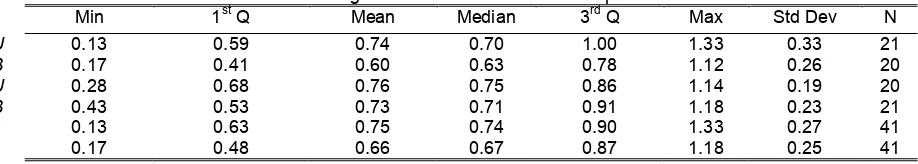
TABLE 1: Rate of scoring distribution for the overall comprehension task
Min 1st Q Mean Median 3rd Q Max Std Dev N
C1:U 0.13 0.59 0.74 0.70 1.00 1.33 0.33 21
C1:B 0.17 0.41 0.60 0.63 0.78 1.12 0.26 20
C2:U 0.28 0.68 0.76 0.75 0.86 1.14 0.19 20
C2:B 0.43 0.53 0.73 0.71 0.91 1.18 0.23 21
U 0.13 0.63 0.75 0.74 0.90 1.33 0.27 41 B 0.17 0.48 0.66 0.67 0.87 1.18 0.25 41 6.2. Pilot Study
The importance of performing a pilot study before the execution of an experiment cannot be over emphasised. Performing a pilot study can mean the difference between a success and a failure of an empirical assessment [25,26]. A pilot study was conducted to validate and verify the accuracy of the materials prepared for the experiment. These included the clarity of the instruction, the validity and complexity of the questions and the practicality of the tasks required relative to the time available for the experiment. The pilot study was also intended to identify any issues that might not have been realised during the preparation of the materials. Five participants who were postgraduate colleagues of the researchers were involved in the pilot study. The pilot study revealed that some instructions were not clear enough and that some tasks were too complex. This was corrected in the final version of the experiment.
6.3. Execution
The experiment was a paper-based exercise, which was conducted in a hundred-minute slot. The slot was divided into two sessions with thirty-five minutes each. In each session, each subject was given a specific model and its questionnaire. The instruction sheet was distributed and explained before the first session began. The materials for the first session were collected after thirty-five minutes had passed and the materials for the second session were distributed right after. During this time, the subjects had a break before starting the second session. After the second session had passed, an additional set of questions was distributed where the subjects were asked about the models comprehensibility subjectively. Five minutes were allocated for answering this qualitative questionnaire. The subjects were not allowed to communicate with each other or leave the room at any time until the experiment ended. The subjects were separated from each other as if in an examination session. During the tasks however the subjects were allowed to refer to textbooks or notes. The subjects were also instructed to inform the researchers if they had any trouble in understanding the questions. This was to ensure that any confusion that may have arisen was due to the model comprehensibility rather than the materials.
7. RESULTS AND ANALYSIS
7.1 Quantitative Measures and Analysis
The dependent variables of this experiment were score and time taken. These measures were taken to determine the rate of scoring, which was obtained by dividing the score by the time taken. The scale used for the rate of scoring was marks per minute (marks/min). There were two types of comprehension measurement and analysis; overall comprehension task and comprehension for modification task. The measurement for overall comprehension task was obtained by consolidating the total score and the total time taken for all five questions. The measurement for the modification task was obtained by considering the score and the time taken for the question on the model modification only.
Table 1 and Table 2 below illustrate the distributions for the overall comprehension task and the modification task respectively. Column Min shows the minimum values, column 1st Q shows the first quartile values, column Mean
shows the average values, column Median shows the middle values, column 3rd Q shows the third quartile values,
TABLE 2: Rate of scoring distribution for the modification task
Min 1st Q Mean Median 3rd Q Max Std Dev N
C1:U 0.00 (2) 1.00 1.20 1.21 1.69 2.00 0.62 18 (3)
C1:B 0.00 (2) 0.41 0.80 0.58 1.13 2.00 0.64 16 (4)
C2:U 0.33 (0) 0.46 0.72 0.63 0.77 1.60 0.37 19 (1)
C2:B 0.00 (1) 0.32 0.59 0.50 0.89 1.20 0.36 21 (0)
U 0.00 0.53 0.98 1.00 1.38 2.00 0.55 37 B 0.00 0.40 0.68 0.58 0.91 2.00 0.49 37
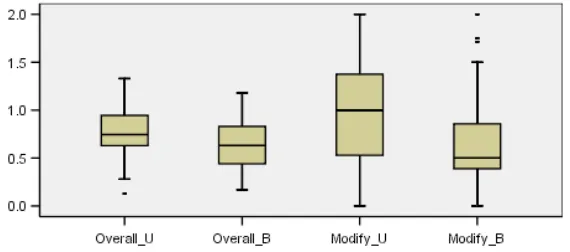
FIGURE 1: Box plots of the grouped rate of scoring for the overall comprehension task and the modification task
Note: Overall = Overall comprehension task; Modify = Modification task; U = UML-B models; B = B models
The collected data N were twenty-one for C1:U and C2:B and twenty for C1:B and C2:U, which resulted in forty-one data had been collected altogether for each model. For the modification task however, the data considered for the analysis was slightly less than the collected data. This was due to data cleaning, which was conducted in order to ensure the validity of the analysis. In particular, the analysis excluded the subjects who did not attempt the modification task at all, which numbers are stated in the brackets under the N column in Table 2. The excluded data were identified by the zero values (0) in time taken for the question on model modification. On the other hand, the subjects who had attempted the modification task for some time (non-zero time taken) but failed to get any score (zero score) were included in the analysis. There were two such subjects from the UML-B model and three subjects from the B model, as illustrated in the brackets under the Min column. The implication of these data is that the subjects had struggled to understand the model or perhaps had misunderstood the model. Either possibility indicates a problem in comprehending the model. This is the reason why they were included in the analysis.
It can be seen from Table 1, Table 2 and Figure 1 that the rate of scoring on the UML-B models is higher than that for the B models. The differences of mean and median values between both models are particularly apparent for the modification task. These differences may be a reflection of true differences in the population from which the samples were taken. It is possible however that the differences may have occurred by chance in the random samples. In order to assume that the differences obtained from the samples are true differences in the population, the standard statistical inference needs to be applied.
[image:6.595.156.441.224.350.2]Overall Comprehension Task:
0.01 <= t <= 0.16 (2 decimal places)
Modification Task:
0.03 <= t <= 0.50 (2 decimal places)
7.1.1. Period Effect Consideration
The analysis for the period effect consideration was performed by firstly obtaining the period difference, that is, the difference between the first period’s data and the second period’s data. While differences between period differences in the same sequence group can be regarded as being random, differences between any two period differences in different sequences would also reflect treatment differences. Therefore, comparing the means of the period differences for the two sequences would allow the treatment effect to be examined [31]. The first period was when the first treatment or model was given to the subjects. For example, the subjects in Group X were given the UML-B model while the subjects in Group Y were given the B model. The second period was when the subjects and models were switched. Since the variable of interest of the experiment was the rate of scoring, the differences in rate of scoring between those periods were calculated. The two-sample procedure using the bootstrap methods was then performed on the differences. Below are the generated bootstrap test results for the overall comprehension task and the comprehension for modification task respectively. The Observed entry gives the mean of the sample and the SE entry is the standard error, which is the standard deviation for the means calculated by the bootstrap method. These entries allow the t statistics to be calculated; 2.325 (overall comprehension task) and 2.371 (modification task). The Tilting Confidence Intervals [32] are the estimated range of mean differences at 95% confidence level. The Tilting Confidence Intervals was chosen instead of other intervals available in the method such as Percentiles and BCa Confidence Intervals because it is more accurate and efficient [28].
The generated values above were not quite reflecting the actual results that consider the period effect because the mean period difference for each sequence is an estimate of the difference between two treatments and also between two periods. This means the mean period difference for the “UML-B-then-B” sequence is an estimate of the difference between UML-B and B and the difference between the first period and the second period. Similarly, the mean period difference for the “B-then-B” sequence is an estimate of the difference between B and UML-B and the difference between the first period and the second period. In eliminating the period difference by subtracting the second estimate, which is the “B-then-UML-B” sequence, from the first estimate, which is the “UML-B-then-B” sequence, will give an estimate of twice the difference between UML-B and B [19]. In order to overcome this inaccuracy, the values were adjusted accordingly by dividing the mean and its associated standard error by two. The subsequent statistical analysis was based on the adjusted mean and standard error values. The calculated true treatment effect (t) that considers the period effect at 95% confidence interval for the respective
comprehension tasks are shown below. Indeed, they are the estimated differences between the expected rate of scoring under the UML-B model and that under the B model at 95% confidence interval. It is worth noting that they are about half of the generated values shown in the Tilting Confidence Intervals entry above. As mentioned earlier, this is due to the doubled estimation in the unadjusted values.
To test the significance of the results, the permutation test was performed. Since the research question was to determine whether or not the UML-B model is better than its equivalent B model, a one-sided direction testing was applied. The generated p-values (P) for the overall comprehension task and the comprehension for modification task are shown below. The p.value entry is the value to be assessed against the significance criterion (a = 0.05). The alternative entry is the indicator of the direction of the test, which in this case, the alternative hypothesis is greater than the null hypothesis. The data clearly show that the difference in the treatment effect between the UML-B model and the UML-B model is statistically significant (P<0.05). Therefore, the null hypothesis could be rejected in favour of the alternative hypothesis. It could be concluded that the UML-B is more comprehensible than the B model in terms of the efficiency in overall comprehension as well as comprehension for modification task purposes.
Overall Comprehension Task:
Summary Statistics:
Observed Mean Bias SE mean 0.1712 0.1705 -0.0006546 0.07362
Tilting Confidence Intervals:
2.5% 5% 95% 97.5%
mean 0.02517 0.05003 0.28993 0.31393
Modification Task:
Summary Statistics:
Observed Mean Bias SE mean 0.532 0.5413 0.009338 0.2244
Tilting Confidence Intervals:
Overall Comprehension Task:
Summary Statistics:
Observed Mean SE alternative p.value
0.1712 -0.0006786 0.07826 greater 0.012
Modification Task:
Summary Statistics:
[image:8.595.83.525.629.715.2]Observed Mean SE alternative p.value 0.532 0.008663 0.2301 greater 0.011
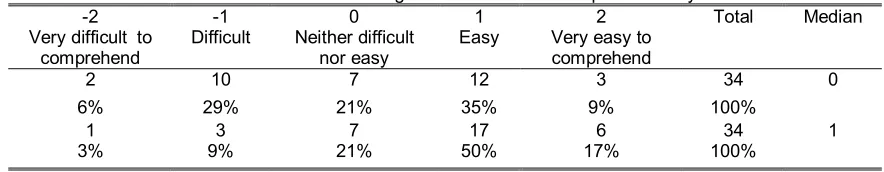
TABLE 3: Distribution of rating on model notation comprehensibility -2
Very difficult to comprehend
-1 Difficult
0 Neither difficult
nor easy
1 Easy
2 Very easy to comprehend
Total Median
2 10 7 12 3 34
UML-B 6% 29% 21% 35% 9% 100%
0
1 3 7 17 6 34
B
3% 9% 21% 50% 17% 100%
1
It can be seen that this experiment employed two statistical tests on the same data set; the overall comprehension task and the comprehension for modification task. It has been claimed that multiple tests on the same dataset can produce a proportionally large number of statistically significant results by chance [33]. Due to that reason, a method called Bonferroni [34] was considered in order to ensure the results obtained are still valid. In essence, the Bonferroni method requires the significance criterion (a) to be divided by the number of tests. Thus for this experiment, the Bonferroni adjustment is 0.025 (a = 0.05/2) for each test. Since the p-values obtained in the analysis are all less than 0.025 therefore, the results are still considered as statistically significant (P<0.025). 7.1.2. Carry-Over Effect Consideration
There is another effect that may influence the results obtained in a cross-over trial, namely the carry-over effect. Although the existence of the effect is admitted, to carry out tests for it however is not advisable [19]. This is due to some conflicting statistical theories, which seem to suggest that the tests for carry-over effect are useless. Moreover, it has been shown than if slightly more realistic forms of carry-over test apply, using the models and associated designs can actually be worse than doing nothing at all about the carry-over effect [35]. One possible approach to dealing with carry-over is that of using a wash out period. It is a period during which the effect of the first given treatment is believed to disappear. When a wash out period is employed, it is assumed that the measurement taken in the second treatment will not be affected by the first treatment. As far as the experiment is concerned, there was a wash out period between the two sessions. Due to time constraint however, the period was only a few minutes. The implication of this is that the period might have been insufficient for the first treatment’s effect to disappear. On the other hand, one can never be certain whether or not the wash out period meets its purpose even if a longer time is allowed. This is particularly true especially when the human’s mind and experience sustainability is concerned, which even vary from one person to the other. For instance, it can never be sure that the first treatment effect will disappear if the second session of the experiment is performed after a month or a year. In fact, this approach may introduce other confounding factors that might influence the results due to lack of controls that could be imposed on the subjects. For example, some subjects may be exposed to new knowledge so that the comparison of the two treatments is affected by uncontrolled variables. Another possible approach to the carry-over problem is to replicate the experiment several times with different designs. If several experiments with different designs investigated the same treatments and revealed similar results, one could be certain that the results are valid whether or not the carry-over has existed.
7.2 Qualitative Measures and Analysis
FIGURE 2: Percentage of model notations preference
29.4
44.1
26.5
0 10 20 30 40 50
P
erc
en
ta
g
e (%
)
UML-B B Both
The descriptive statistics shown above indicate that the subjects perceived the B model as more easy to comprehend than the UML-B model and the B model was preferred to the UML-B model. In a glance, one may suggest that the B model is better than the UML-B model from the subjects’ perspective. However, it is worth noting that the findings may be due to several reasons. Compared to the B method, the subjects were only exposed to the UML-B method a few days before the experiment was conducted. In fact, the lecture session was only about an hour. The subjects therefore had limited experience and time on learning and exploring the method. Unlike the B method, the UML-B method also lacks comprehensive references that elaborate the method with specific examples of application. The UML-B method is a subset of the UML and the B method, which the subjects have already known, but there are several integration rules that need to be understood. Thus, it is not surprising to discover that the subjects preferred the B model, as they were more familiar with the B method. This fact was indeed supported by the informal feedback received from the subjects. Perhaps the perception would be different if more resources were allocated for learning and exploring the UML-B method, which is worth-investigating in future.
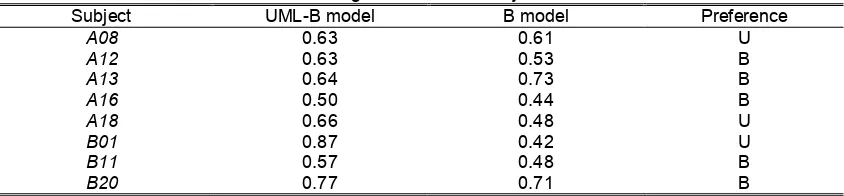
Besides the above measures, the subjects were also asked to provide personal comments on the models. The UML-B model was perceived as being easy to visualise and understand the scenario more quickly, easy to understand the relationships between operations, easy to develop especially on computers, easy for novices and more logical to developers. The model however was said to be useful only with good tool support. The UML-B model was also commented as being quite ‘messy’ since the information was scattered around the class and statechart diagrams. In general, the main difficulties of the UML-B model include the interpretation of specific symbols, understanding the integration between the UML diagrams and the B notation, and the tracing between chunks of information. Perhaps these are the reasons why some of the subjects perceived the UML-B model as difficult to understand. On the other hand, the B model was commented as being more formal, less ambiguous and easy to read since the information was kept together as a flow of information. However, the B model was claimed as being harder to develop, lacking visualisation, lengthy and too much text. The hardest parts to understand about the B model are generally about the interpretation of symbols used and the tracing between chunks of information. Another finding seems to suggest that even with very limited training on the UML-B method, one can still understand the model well. There were eight subjects who did not attend the UML-B lecture and thus depended on the available references or their own knowledge to answer the questions. The rate of scoring for these eight subjects is shown in the Table 4 below. It can be seen that seven out of eight subjects performed better on the UML-B model. Five of these subjects commented that they preferred the B model to the UML-B model. Despite the fact that these subjects disliked and had no training on the UML-B method, the quantitative measures show that they still performed better on the UML-B model than with the B model. However, the size of this sample is too small to perform reliable statistical significance testing.
Table 4: Rate of scoring distribution for subjects who were absent
Subject UML-B model B model Preference
A08 0.63 0.61 U
A12 0.63 0.53 B
A13 0.64 0.73 B
A16 0.50 0.44 B
A18 0.66 0.48 U
B01 0.87 0.42 U
B11 0.57 0.48 B
B20 0.77 0.71 B
(10/34)
(15/34)
[image:9.595.82.504.644.742.2]8. CONCLUSIONS AND FUTURE WORK
The findings of the experiment provide a preliminary indication that the integration of both semi-formal and formal notation is useful in promoting specification or model comprehensibility as compared to the formal notation alone. A model that integrates the use of both notations such as the UML-B model is capable of expediting the subjects’ comprehension task with accuracy even with limited training. The model allows the subjects to grasp the required information more quickly and use it to perform the subsequent tasks correctly. The results indicate with 95% confidence that a UML-B model could be up to 16% (overall comprehension) and 50% (comprehension for modification task) easier to understand than the corresponding B model. This finding is appealing as it suggests that introducing some graphical features of a semi-formal notation into a formal notation significantly improves the formal notation’s accessibility.
The findings also seem to support the theory that suggests the integration of graphical and textual representations is more effective in portraying information. In many cases, the UML-B model and the B model contain similar textual representation in the form of B notation except that the UML-B model uses the graphical representation of the UML in concert with the B notation to illustrate the semantics. Since the possible confounding factors had been randomised and treated accordingly in this experiment, the results suggest that the integration is better than the textual representation alone. As far as the experiment is concerned, this theory helps to explain why the UML-B model is more comprehensible than the B model.
The findings of the experiment indicate that one can still comprehend the notation in a UML-B model even with very limited hours of training. However, the underlying assumptions about the population that is represented by the sample should be understood. Practitioners should only be expected to perform well on the UML-B model if they have been exposed to both the UML and the B method. In addition, basic understanding of the theoretical aspects of formal method and object-oriented technology is also seen as necessary for promoting the comprehension. There are several ways in which the experiment and its findings could be improved. It has been pointed out that the hallmark of good experimentation is the accumulation of data and insights over time [36]. Therefore, one possible way of improvement is through replication, where the experiment will be repeated on different samples of the population with slightly different conditions and design. This would help in determining how much confidence can be placed in the results of the experiment. As the objective of a specification is to further stakeholders’ understanding of an application domain, the investigation of the notation will be extended to include the resulting cognitive model developed by the viewers. The measurement will not only assess the notation’s ability to represent information that can be understood but also its ability to facilitate the construction of application domain knowledge. The efficacy of the UML-B method will be further investigated by applying measurement on the model development through surveys. This would allow the strengths and the weaknesses of the method in software development to be fully assessed. The qualitative methodology such as found in the social sciences will be employed to gather a holistic understanding of the important factors and how and why they may influence the effectiveness of the method. The qualitative approaches also allow the users’ perception towards the method’s ease of use to be explored and better understood.
ACKNOWLEDGEMENT
R. Razali thanks the students (COMP3011-Spring 2006) participated in the experiment and the postgraduate colleagues (DSSE/ECS) involved in the pilot study.
REFERENCES
[1] Craigen, D., Gerhart, S and Ralston, T. (1995) Formal Methods Technology Transfer: Impediments and Innovation. In Hinchey, M. and Bowen, J. (eds), Applications of Formal Methods, Prentice-Hall, Englewoodcliffs, New Jersey.
[2] Hinchey, M. G. (2002) Confessions of a Formal Methodist. In Lindsay, P. (eds), Conferences in Research and Practice in Information Technology, Australian Computer Society.
[3] Finney, K and Fedorec, A. (1996) An Empirical Study of Specification Readability”, In Dean, N. and Hinchey, M. (eds), Teaching and Learning Formal Methods, Academic Press, New York.
[4] Finney, K. (1996) Mathematical Notation in Formal Specification: Too difficult for the Masses?. IEEE Transactions on Software Engineering, 22, 158-159.
[6] Vessey, I. and Weber, R. (1986) Structured Tools and Conditional Logic: An Empirical Investigation. Communications of the ACM, 29, 48-57.
[7] Cunniff, N. and Taylor, R. P. (1987) Graphical vs Textual Representation: An Empirical Study of Novices’ Program Comprehension. Empirical Studies of Programmers: 2nd Workshop, pp. 114-131.
[8] Scanlan, D. A. (1989) Structured Flowcharts Outperform Pseudocode: An Experiment Comparison. IEEE Software, 6, 28-36.
[9] Bauer, M. and Johnson-Laird, P. (1993) How Diagrams Can Improve Reasoning. Psychological Science, 4, 372-378.
[10] Stenning, K. and Oberlander, J. (1995) A Cognitive Theory of Graphical and Linguistic Reasoning: Logic and Implementation”, Cognitive Science, 19, 97-140.
[11] Petre, M. (1995) Why Looking isn't always Seeing: Readership Skills and Graphical Programming. Communications of the ACM, 38, 33-44.
[12] Abrial, J. R (1996) The B-Method - Assigning Programs to Meanings, Cambridge University Press.
[13] Object Management Group (2006) Introduction to OMG’s Unified Modeling Language (UML). [Online]. Available: http://www.omg.org/gettingstarted/what_is_uml.htm (Cited Jan 2007)
[14] Snook, C. and Butler, M (2006) UML-B: Formal Modelling and Design Aided by UML, ACM Transactions on Software Engineering and Methodology, 15, 92-122.
[15] ClearSy, AtelierB User Manual V3.6, ClearSy System Engineering, 2003, Aix-en-Provence, France.
[16] B-Core (UK) Limited, Oxon, UK (1999) B-Toolkit, On-line manual, [Online]. Available: http://www.b-core.com/ONLINEDOC/Contents.html (Cited Jan 2007)
[17] Pender, T. (2003) UML Bible, Wiley.
[18] Mayer, R. E., Bove, W., Bryman, A., Mars, R. and Tapangco, L. (1996) When Less is More: Meaningful Learning from Visual and Verbal Summaries of Science Textbook Lessons. Journal of Educational Psychology, 88, 64-73.
[19] Senn, S. (2002) Cross-over Trials in Clinical Research (Statistics in Practice), John Wiley & Sons. [20] Sommerville, I (2001) Software Engineering. 6th Edition, Addision-Wesley.
[21] Seaman, C. B. (1999) Qualitative Methods in Empirical Studies of Software Engineering. IEEE Transactions on Software Engineering, 25, 557-572.
[22] Daly, J. (1996) Replication and a Multi-Method Approach to Empirical Software Engineering Research. PhD thesis, University of Strathclyde, Glasgow, UK.
[23] Piattini, M., Genero, M., Poels, G. and Nelson, J (2005) Towards a Framework for Conceptual Modelling Quality”, In Genero, M, Piattini, M and Calero, C. (eds), Metrics for Software Conceptual Models, Imperial College Press, London.
[24] Bloom, B. S. and Krathwohl, D. R. (1956) Taxonomy of Educational Objectives: The Classification of Educational Goals, by a Committee of College and University Examiners. Handbook I: Cognitive Domain. Longmans, New York.
[25] Pfleeger, S. L (1995) Experimental Design and Analysis in Software Engineering: Part 1-5. ACM SIGSOFT Software Engineering Notes, 20, No.1-5.
[26] Kitchenham, B. A and Pfleeger, S. L (2002) Principles of Survey Research: Part 1-6. ACM SIGSOFT Software Engineering Notes, 27, No.1-6.
[27] Efron, B. and Tibshirani, R. (1993) An Introduction to the Bootstrap, Chapman and Hall, New York, London. [28] Moore, D. S. and McCabe, G. P. (2006) Introduction to the Practice of Statistics, 5th Edition, W. H. Freeman,
New York.
[29] Efron, B. and Tibshirani, R. (1986) The Bootstrap Method for Standard Errors, Confidence Intervals and other measures of statistical accuracy. Statistical Science, 1, 1-35.
[30] Insightful Corporation (2006) [Online]. Available: http://www.insightful.com/products/splus/default.asp (Cited Jan 2007)
[31] Jones, B. and Kenward, M. G. (2003) Design and Analysis of Cross-over Trials, 2nd Edition, Chapman and
Hall, London.
[32] Efron, B. (1981) Nonparametric Standard Errors and Confidence Intervals. Canadian Journal of Statistics, 36, 369-401.
[33] Courtney, R. E and Gustafson, D. A. (1992) Shotgun Correlations in Software Measures. Software Engineering Journal, 8, 5-13.
[34] Rosenberger, W. F. (1996) Dealing with Multiplicities in Pharmacoepidemiologic Studies. Pharmacoepidemiology and Drug Safety, 5, 95-100.
[35] Senn, S. (1992) Is the Simple Carry-over Model Useful?. Statistics in Medicine, 11, 715-726.