THE STUDY OF LUMINANCE EFFECT ON
SURFACE ROUGHNESS OF METALLIC SURFACE
BY USING VISION SYSTEM TECHNIQUE
MOHAMMAD NOOR ZAIDI BIN HAMDAN
B051310154
THE STUDY OF LUMINANCE EFFECT ON SURFACE ROUGHNESS
OF METALLIC SURFACE BY USING VISION SYSTEM
TECHNIQUE
This report is submitted in accordance with requirement of the University Teknikal Malaysia Melaka (UTeM) for Bachelor Degree of Manufacturing Engineering
(Robotics and Automation) (Hons.)
by
MOHAMMAD NOOR ZAIDI BIN HAMDAN B051310154
940109-12-5545
Disahkan oleh:
_____________________________ ______________________________ Alamat Tetap: Cop Rasmi:
2083 FELDA GUNUNG BESOUT 2 35600 SUNGKAI
PERAK
Tarikh: _______________________ Tarikh: _______________________
*Jika Laporan PSM ini SULIT atau TERHAD, sila lampirkan surat daripada pihak berkuasa/organisasi berkenaan dengan menyatakan sekali sebab dan tempoh laporan PSM ini perlu dikelaskan sebagai SULIT atau TERHAD.
UNIVERSITI TEKNIKAL MALAYSIA MELAKA
BORANG PENGESAHAN STATUS LAPORAN PROJEK SARJANA MUDA
Tajuk: THE STUDY OF LUMINANCE EFFECT ON SURFACE ROUGHNESS OF METALLIC SURFACE BY USING VISION SYSTEM TECHNIQUE
Sesi Pengajian: 2016/2017 Semester 2
Saya MOHAMMAD NOOR ZAIDI BIN HAMDAN (940109-12-5545)
mengaku membenarkan Laporan Projek Sarjana Muda (PSM) ini disimpan di Perpustakaan Universiti Teknikal Malaysia Melaka (UTeM) dengan syarat-syarat kegunaan seperti berikut:
1. Laporan PSM adalah hak milik Universiti Teknikal Malaysia Melaka dan penulis. 2. Perpustakaan Universiti Teknikal Malaysia Melaka dibenarkan membuat salinan
untuk tujuan pengajian sahaja dengan izin penulis.
3. Perpustakaan dibenarkan membuat salinan laporan PSM ini sebagai bahan pertukaran antara institusi pengajian tinggi.
4. *Sila tandakan (√)
(Mengandungi maklumat yang berdarjah keselamatan atau kepentingan Malaysiasebagaimana yang termaktub dalam AKTA RAHSIA RASMI 1972)
(Mengandungi maklumat TERHAD yang telah ditentukan oleh organisasi/ badan di mana penyelidikan dijalankan)
SULIT
TERHAD
DECLARATION
I hereby, declared this report entitled “The Study of Luminance Effect on Surface Roughness of Metallic Surface by Vision System Technique” is the results of my own research except as
cited in reference.
Signature : ……….
Author’s Name : MOHAMMAD NOOR ZAIDI BIN HAMDAN
APPROVAL
This report is submitted to the Faculty of Manufacturing Engineering of Universiti Teknikal Malaysia Melaka as partial fulfilment of the requirements for the degree of
Bachelor of Manufacturing Engineering (Robotics and Automations) (Hons.).The members of the supervisory committee are as follow:
i
ABSTRAK
ii
iii
ABSTRACT
iv
DEDICATION
Only
My beloved father, Hamdan Bin Tahir My appreciated mother, Zakiah Binti Salleh
My adored sister and brothers, Fatin Nur Adilah Binti Hamdan Mohammad Noor Aiman Bin Hamdan
v
ACKNOWLEDGEMENT
In the name of ALLAH, the most gracious, the most merciful, with the highest praise to Allah that I manage to complete my project titled “The Study of Luminance Effect on Surface Roughness of Metallic Surface by Vision System Technique” successfully without any major difficulties.
First things first, I would like to express my deepest appreciation to all those who provided me the possibility and efforts to complete this final year project report especially to my beloved father, Hamdan Bin Tahir and my mother, Zakiah Binti Salleh who are always be there for me, supporting and giving me some motivation along conducting this project.
Besides, a special gratitude I give to my respected final year project supervisor, Dr. Ruzaidi Bin Zamri, a person who give a lot of contribution in bringing up brilliant solutions or ideas and encouragement, helped me to coordinate my project especially in writing this final report.
Furthermore I would also like to acknowledge with much appreciation the crucial role of the technician, Puan Shamsiah Hasita Bt. Shafie, who gave the permission to use Fluid Power Laboratory in Fakulti Kejuruteraan Pembuatan, all required equipment and the necessary materials to complete the task regarding my final year project. A special thanks goes to my team mates under the same supervised, who are helping to support each other to complete our own project.
vi
TABLE OF CONTENT
ABSTRAK i
ABSTRACT iii
DEDICATION iv
ACKNOWLEDGEMENT v
TABLE OF CONTENT vi
LIST OF TABLES ix
LIST OF FIGURES x
CHAPTER 1 - INTRODUCTION
1.1 Background 1
1.2 Problem Statement 2
1.3 Objectives 2
1.4 Scope 2
1.5 Summary 3
CHAPTER 2 - LITERATURE REVIEW
2.1 Introduction 4
2.2 Surface Roughness Measurement 4
2.3 Image Processing 5
2.4 Contact Method 6
2.4.1 Stylus Method 7
2.5 Non-contact Method 7
2.5.1 Light Scattering 7
2.5.2 Machine Vision Based Technique 8
2.6 Luminance Light 9
2.6.1 Light-emitting Diode (LED) 10
2.6.2 Incandescent Light Bulb 11
2.6.3 Fluorescent Lamp 13
vii
2.8 Summary 18
CHAPTER 3 - METHODOLOGY
3.1 Introduction 19
3.2 Gantt Chart 19
3.3 Overall Flow Chart of study 20
3.4 Identifying Project Title 21
3.5 Literature Review 21
3.6 Defining the Objective and Scopes 21
3.7 System Structure 22
3.7.1 Hardware and Software component 23 3.7.2 MITUTOYO Surface Measurement 24
3.8 Model Development 24
3.9 Report and Submission 25
3.10 Summary 25
CHAPTER 4 - RESULTS AND DISCUSSIONS
4.1 Introduction 26
4.2 Specimen and Defected Region 26
4.3 Image Processing Methods 26
4.3.1 MATLAB Graphical User Interface (GUI) 27
4.3.2 Result of Images 27
4.3.3 Mean Gray Level Value (Ga) 36
4.4 Contact Method 37
4.4.1 Average Surface Roughness (Ra) 38 4.5 Data plotting and line regression 39 4.6 Surface Roughness (Ra) Model Calculation 43
4.6.1 Red LED 43
4.6.2 White Fluorescent 45
4.6.3 Yellow Bulb 47
4.7 Finding Correlation 49
4.7.1 Red LED 49
viii
4.7.3 Yellow Bulb 53
4.8 Summary 55
CHAPTER 5 - CONCLUSION AND RECOMMENDATIONS
5.1 Conclusion 56
5.2 Recommendation 57
5.3 Sustainability Elements 57
5.4 Long Life Learning 57
REFERENCES 58
Appendix A 60
Appendix B 61
Appendix C 62
Appendix D 64
Appendix E 66
ix
LIST OF TABLES
Table 2.1: List of journals and findings 15 Table 3.1: Objectives and Scope definition 21 Table 3.2: Hardware and Software component 23 Table 4.1: Result for Red LED images of specimen 27 Table 4.2: Result for White Fluorescent images of specimen 30 Table 4.3: Result for Yellow Bulb images of specimen 33
Table 4.4: Mean Gray Value (Ga) 36
Table 4.5: Result of MITUTOYO Surface Measurement 38
Table 4.6: Data for Red LED 39
Table 4.7: Data for White Fluorescent 40
Table 4.8: Data for Yellow Bulb 41
Table 4.9: New Ra for Red LED 43
Table 4.10: New Ra for White Fluorescent 45
Table 4.11: New Ra for Yellow Bulb 47
x
LIST OF FIGURES
Figure 1.1: Metal Sheet JIS G3141 (Source: Google Image) 3 Figure 2.1: Parameter of defining the luminance ( Source: Encyclopaedia ) 10 Figure 2.2: Parts of LED light (Source: Encyclopaedia) 11 Figure 2.3: Typical Incandescent bulbs (Source: Google Image) 13 Figure 2.4: Fluorescent light bulb appearance (Source: Google Image) 14
Figure 3.1: Flow Chart 20
Figure 3.2: System Structure 22
Figure 3.3: MITUTOYO Surface Roughness Measurement Tool 24 Figure 4.1: Graph Ra Vs Ga for Red LED 40 Figure 4.2: Graph Ra Vs Ga for White Fluorescent 41 Figure 4.3: Graph Ra Vs Ga for Yellow Bulb 42
Figure 4.4: Graph New Ra for Red LED 44
1
CHAPTER 1
INTRODUCTION
1.1 Background
Nowadays, machine vision is one of the equipment and method that applied the vision-based automatic measurement and experimental investigation for instance applications as production check-up, production process control, and robots-guided in advanced industries. The potential of this machine vision technology is very wide and it depends on what type of purpose that can be used.
However, some of conventional machine vision are still developing such as markets-metrology, defect recognition, image tracing, and bar-code reader. Unfortunately only at a pace reflecting the maturity of the technology give a lot of advantage to its consumers. Besides that, the latest machine vision algorithms depend on controlled parts presentation, lighting and optics for robust and faster processing. Users have been considering Graphical User Interface (GUI) on new machine vision applications that work flexible in generally independent situations.
For example, the camera captures and freeze the image of the object placed on a moving conveyor. The crucial information of parameter is acquire from the image of the object and a script file or algorithms is generated by the software and the image is saved as a template for further measurements. When the measurement starts, the images of the objects which come under the camera are captured and the script is run which compares the images with the template and reflects status either accept or unaccepted on the GUI depending on how many the crucial dimensions of the image matches with the template.
2
huge amount of the most visible occurrence light in addition to the revealed surface effects so that the reflection proportion is additionally condensed. In this respect it is also significant whether there is only a simply penetrable thin coat of paint on the object or the experiment item is completely coloured.
1.2 Problem Statement
There are many aspect to be tackle in the study of luminance effect on surface roughness of metallic surface by vision system technique such as the measurement of reading of surface roughness (Ra) of material on different type of light exposure on the metal sheet JIS G3141 which could give different result to be analyse later by using developed Graphic User Interface (GUI) that measure and calculate the mean grey value (Ga). Then, from the collected data will be developed the different surface roughness models and lastly how to determine which model is the best represent the surface roughness using vision based technique.
1.3 Objectives
The objectives of this study are:
a) To measure surface roughness of metal sheet JIS G3141 by using white fluorescent light, bulb light and LED light.
b) To develop surface roughness models from collected data to represent Ga and Ra relationship.
c) To determine the best model which represent the surface roughness using vision based technique.
1.4 Scope
3
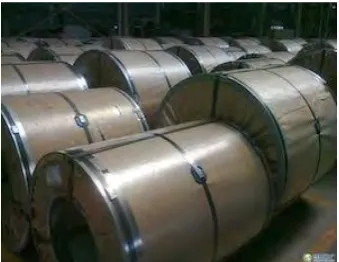
[image:18.595.222.392.194.325.2]in Figure 1.1: Metal Sheet JIS G3141 surface that commonly used in industry, by using OMRON CCD camera and MITUTOYO Surface Measurement tools as the apparatus of the machine vision system to measure the intensity of light with the surface roughness (Ra) each of specimens that will be analysed by using certain parameter algorithm developed in GUI of MATLAB Image Acquisition Toolbox.
Figure 1.1: Metal Sheet JIS G3141 (Source: Google Image)
1.5 Summary
4
CHAPTER 2
LITERATURE REVIEW
2.1 Introduction
In Chapter 2, many previous studies related to this project are discussed that involve in surface roughness on the object and the method that be used in measurement. All the information are used to design the methodology in Chapter 3 included reference book, journal and etc. In this chapter will focus on surface roughness measurement on defected specimen by using machine vision system.
2.2 Surface Roughness Measurement
All the surfaces of the specimen may not fulfil functional requirements and no need to be equally finished or called as defected. The geometrical specifications of a surface measurement include, macro-deviations, surface waviness and micro irregularities. The surface roughness is measured by the height, Rtand mean roughness
index Ra represent the micro-irregularities. The evaluation are normally made on along a
line, running at right angle 90o or perpendicular to the general direction of tool marks on
the surface. It can be conclude that the mean roughness index (Ra) is the arithmetic mean
of the absolute value of the highest hi between the actual and mean profile of the surface
of the specimen measured.
5
amplitude parameter that used to measure the vertical characteristics of the surface deviations.
Dumazet et al (2006) found that the measurement of surface, optical simulations, samples realization of gilded surfaces were made for studying the visual appearance and the substrate colour influence of the gilded surfaces mainly encountered in sculpture.
2.3 Image Processing
The first step in recognizing structures in an object consuming machine visualisation process is to acquire images instead of the object itself. Many methods are used to gather data that is altered into binary in term of Black and White images representing the image that scanned from an object. Once an image or images have been composed using several technique, certain processes must be taken place to choice and recognize the several features are correlated. These processes are allocated into contact and non-contact method. Ballard and Brown (1982) stated that after several form of emission, which has been imitated after or spread over an object records in a device, image formation happens.
The image itself characterized in different dimension and illumination resolution. All the different dimension shows the quantity of pixels representing the whole image. The illumination levels develops the grayscale image so that image pixels mix together by increasing the number of represented bits later the image of different dimension and illumination resolution be influenced by on the purpose. This situation is essentially which is the most accurate resolution need to be matched for the application so that separation and sorting methods work properly. The defect recognition on the specimen, it is mostly established that a single desires doubled the different dimension resolution of the lowest piece to be discovered and a lowest of 8 bits of illumination resolution.
6
decision based on extracted information. But, in practice, it is more than the above process.
Vilbett et al (2006) explained the methods on how the surfaces were examined for roughness by using laser scanning microscopy, colour, and glossy image. When a device gathers a captured image, the image is shattered up into distinct parts of figures which is acknowledged as pixels, which are the parameter within the image of the examples and the illumination values correlated with it.
Megahaed et al (2011) during a symposium they discovered and highlighted some application opportunities available in the use of control charts with image data and provide some advice to practitioners. They also give some guideline to other researcher to conduct towards their research study.
2.4 Contact Method
For this method, in order to acquire the data of measurement process of surface roughness, the sensor of the measurement tools comes in contact with the surface of the specimen and calculate the actual parameter of the desired surface. This method is normally used as it is the most accurate in taking data for measurement surface roughness.
7 2.4.1 Stylus Method
The stylus sensor comes in contact to the surface roughness to scans the surface and the input converts the mechanical movement of the stylus sensor into the output via transducer which is an electrical signal later will be transfer to the computer. This method has finite dimension, by other means it is not mathematical point. According to ISO standards a stylus sensor might have an included angle of 60 or 90 degrees and a tip radius of curvature about of 2, 5 or 10 micrometres. The stylus sensor tip radius is very crucial part in measuring the surface profile.
2.5 Non-contact Method
This method is said to be a lot safer because of without any contact to the surface of specimen which mean there is no contact between the sensor and surface with any of these technique. This method is prevent the specimen from additional unexpected defect.
2.5.1 Light Scattering
. Manoj & Shivakumar (2010) stated that a beam of light with a certain wavelength is occurred as incident light on the surface of testing object at the angle which can be as the controlled variable. Once the surface is ideally exposed, the incident light beam is reflected in the secular direction, at the specific angle of the incidence represent the similarities of the angle of reflection. Once the surface is declared as rough, an originality or all of the incident light beam are scattered off from the reflective surface area, creating a diffuse beam.
8
(TIS). These two methods based on light scattering to predict the roughness of object surface.
2.5.2 Machine Vision Based Technique
The illumination such a very important role within the machine vision system itself in order for capturing image. Measuring the influence of lighting source, such as the angle of grazing and distance between surface specimen and the light source, optical surface-finished parameters extracted from the original-captured image (Z. Zhang, Chen, Shi, Ma, & Jia, 2009). In several advanced manufacturing, machine vision system has been very excellent employed to be implement including to material handling, assembly and product quality inspection (Manoj & Shivakumar, 2010).
Machine vision based techniques covered the area unit appropriate for on-line evaluation of surfaces of machined specimens included the area unit safe on surfaces being measured by the measuring instrument. Implementation of a vision system to get surface image and quantified the surface roughness employing a multivariate analysis. The mean gray value (Ga) of the surface image was calculated and calibrated with the various average surface roughness (Ra) of the surface measured by the stylus technique. By using the Gray Level Co-occurrence Matrix (GLCM), this method considered the unique relationship of pixels on the surface image. The surface roughness is extracted by discovering the correlation of average surface roughness (Ra) with the options of GLCM of the surface image (Jeyapoovan & Murugan, 2013).
9
2.6 Luminance Light
The term of luminance defined as photometric measurement of the brightness concentration per unit area of light get through in a given way. It portrays the amount of light that passes through, is produced or reflected from an appropriate area, and drops within a given solid angle. The SI unit for luminance is candela per square metre (cd/m2). A non-SI term for the same unit is the "nit". The Centimetre-Gram-Second (CGS) unit of luminance is the stilt, which is similar to one candela per square centimetre or 10 kcd/m2.
Dörband et al (2012) stated that luminance is frequently used to specify issuance or reflection from flat and diffuse surfaces.
Dror et al (2001) explained the spatial structure of real-world illumination possesses some of the statistical regularities observed in the natural image statistics literature. Besides, the illuminance specifies how much luminous power will be distinguished by an eye staring at the surface from a particular angle of vision. Luminance is thus a sign of how bright and clear the surface will appear. In Figure 2.1 shows the parameter of defining luminance of light. In this case, the firm angle of interest is the solid angle subtended by the eye's pupil. Luminance is used in the video industries to illustrate the illumination of displays.
A normal computer show releases between 50 and 300 cd/m2. In addition, the sun
has luminance of about 1.6×10⁹ cd/m2 at noon. Luminance is said as invariant in