1
F-18 FDG PET-CT FOR RESPONSE EVALUATION IN
HEAD AND NECK MALIGNANCY
A dissertation submitted in partial fulfilment of MD Nuclear Medicine
examination of the Tamil Nadu Dr. M.G.R Medical University, Chennai
2
CERTIFICATE
This is to certify that the dissertation entitled “F-18 FDG PET-CT for response
evaluation in head and neck malignancy” is the bonafide original work of Dr. Justin
Benjamin submitted in partial fulfilment of the requirement for MD Nuclear Medicine
Degree Examination of the Tamil Nadu Dr. M.G.R Medical University, Chennai to be
held in May 2019.
Guide:
Dr. Regi Oommen, Professor,
Department of Nuclear Medicine,
Christian Medical College,
3
Co-investigators
1. Dr Julie Hephzibah Professor,
Head of the Department, Nuclear
Medicine, Christian Medical College &
Hospital, Vellore – 632 004
2. Dr Nylla Shanthly Physician,
Department of Nuclear Medicine,
Christian Medical College &
Hospital, Vellore – 632 004
3. Dr David Mathew
Assistant Professor,
Department of Nuclear Medicine,
Christian Medical College &
Hospital, Vellore – 632 004
4. Dr Simon Pavamani, Professor
Department of Radiation Oncology,
Christian Medical College &
Hospital, Vellore – 632 004
5. Dr Rajnikanth. J, Professor
Department of Head and Neck
Surgery, Christian Medical College &
4
CERTIFICATE
This is to certify that the dissertation entitled “F-18 FDG PET-CT for response
evaluation in head and neck malignancy” is the bonafide original work of Dr. Justin
Benjamin submitted in partial fulfilment of the requirement for MD Nuclear Medicine
Degree Examination of the Tamil Nadu Dr. M.G.R Medical University, Chennai to be
held in May 2019.
Principal Head of Department:
Christian Medical College,
Vellore
Dr Julie Hephzibah
Head of the department,
Nuclear Medicine,
5
ANTI-PLAGIARISM CERTIFICATE:
This is to certify that this dissertation work titled “F-18 FDG PET-CT for response
evaluation in head and neck malignancy” of the candidate Dr. Justin Benjamin with
registration Number 201634051 in the branch of MD Nuclear Medicine has been
submitted for verification. I personally verified the urkund.com website for the
purpose of plagiarism Check. I found that the uploaded thesis file contains from
introduction to conclusion pages and result shows 3% percentage of plagiarism in the
dissertation.
Guide & Supervisor,
Dr Regi Oommen,
Professor, Nuclear Medicine
6
ACKNOWLEDGEMENTS:
First and foremost, I am deeply indebted to my Lord and Saviour, Jesus
Christ, for all His grace and strength during the course of the study.
Next, I would like to thank my beloved wife, Dr Jija Elizabeth for her
constant prayers and support.
I would like to express my sincere gratitude to my professor and guide, Dr.
Regi Oommen for all his valuable guidance and suggestions from the conception of
this study till its completion.
I would like to record my thanks to Dr Julie, Dr Nylla, Dr David, Dr Simon
Pavamani and Dr Rajnikanth for all their input and timely help. I am very grateful to
my colleagues, Dr Saumya, Dr Junita, Dr Vishnu and Dr Praneeth for their support.
I would also like to thank Mrs Mahasampath Gowri for helping me with the
analysis of the data.
I owe much to my family and friends for their constant encouragement
7
DECLARATION
I, Dr. Justin Benjamin, hereby declare that this dissertation entitled “F-18 FDG
PET-CT FOR RESPONSE EVALUATION IN HEAD AND NECK
MALIGNANCY” is an original work done by me in partial fulfilment of the
requirement for M.D Nuclear Medicine Degree Examination of The Tamil Nadu Dr
M.G.R Medical University, Chennai to be conducted in May 2019.
Candidate:
Dr. Justin Benjamin
Post Graduate Resident,
Department of Nuclear Medicine
Christian Medical College & Hospital,
8
Contents
I. INTRODUCTION ... 9
II. AIMS AND OBJECTIVES ... 13
III. LITERATURE REVIEW ... 15
A. Positron Emission Tomography ... 16
1. Principles of F-18 and FDG Production... 16
2. Coincidence detection ... 18
3. Tumour and FDG metabolism ... 20
4. PET development ... 23
5. Scanning procedure ... 24
6. Assessment of PET scans ... 25
B. Head and neck cancer ... 29
1. Staging in HNSCC ... 31
2. Utility of 18-FDG PET-CT in Staging ... 33
3. Radiotherapy planning ... 36
4. Neck Dissection ... 37
5. Treatment response assessment ... 40
6. Effect of SUV ... 44
7. Interpretation pitfalls ... 45
IV. METHODOLOGY ... 47
A. Study design and setting ... 48
B. Inclusion criteria ... 48
C. Methods ... 49
D. Image interpretation ... 50
E. Definitions ... 56
F. Statistical analysis ... 56
V. RESULTS ... 57
A. Patient and tumour characteristics ... 58
B. TNM Classification ... 61
C. Deauville Criteria Score ... 63
D. Follow-up ... 66
VI. DISCUSSION ... 68
VII. LIMITATIONS OF THE STUDY ... 74
VIII. CONCLUSION ... 75
IX. REFERENCES ... 76
9
10 The annual incidence of head and neck squamous cell cancer (HNSCC)
is about 680,000 new cases in the world, with a crude rate of 9.7 per 100,000 persons
and a cumulative risk of 1.06 (1). Options such as radiation therapy (RT) alone or with
concomitant chemoradiation therapy (CRT) plays a significant role in the curative
treatment of locally advanced disease (stages III-IV).
F-18 fluorodeoxyglucose (18F-FDG), a radiolabelled glucose analogue, is one of the
most widely used tracer in positron emission tomography (PET) studies in oncology.
Quantification of tracer uptake can be carried out in diverse ways, from visual analysis
to a simple calculation of fluorodeoxyglucose (FDG) uptake level for example, the
standardized uptake value (SUV) and by more complicated analyses, calculating the
metabolic variation with time (metabolic rate) of FDG uptake.
In the management of HNSCC patients, functional imaging performed with 18F-FDG
PET-computed tomography (CT) has several applications (2). F-18 FDG PET-CT is
endorsed by the National Comprehensive Cancer Network (NCCN) guidelines for
diagnosis and staging (3). F-18 FDG PET-CT can identify an occult primary tumour
(4) and is very accurate in detecting metastases or second primary tumours elsewhere
in the body (2). Accurate delineation of target volumes is critical for intensity
modulated radiation therapy (IMRT) treatments.
The response of HNSCC to treatment depends on many factors such as clinical history
(previous treatments), tumour characteristics (stage and biology), surrounding
microenvironment, and host immunoresponse.
Numerous studies have confirmed the role of predictive molecular biomarkers such as
11 or epidermal growth factor receptor expression (5). The role of imaging-based
biomarkers has been explored too, but none of them can be used routinely to improve
the selection of responders before the start of or during treatment (6–10).
It has been well-known that 18F-FDG PET-CT plays a significant role in the
assessment of the response after CRT or RT alone. The pre-eminence of functional
over conventional imaging in response evaluation consists of its ability to
semiquantitatively assess glucose uptake as a cancer cell viability indicator. PET-CT
has shown high negative predictive value (NPV) if performed at least 8 to 16 weeks
after completion of treatment (11,12). After concurrent CRT for locally advanced
HNSCC, locoregional recurrence develops in 20% to 30% of patients, typically in the
gross tumour volume, suggesting that dose escalation or additional interventions could
help in improving local tumour control. FDG PET-CT might be used to identify the
biological target volume (BTV) inside the target volume. Evidence exists that local
recurrences characteristically occur within areas of high FDG uptake (13).
Such areas could be treated with a boost dose using IMRT techniques to reduce the
risk of recurrence. In recent years, there has been increasing interest in the role of
18F-FDG PET-CT acquired during CRT, defined as ad interim FDG PET (PETint),
with the aim to identify tumour responsiveness at an early stage of treatment (14).
Early identification of poor responders or nonresponders may allow modification of
the treatment plan (volume and doses) and/or implementation of alternative
therapeutic strategies to intensify treatment. Few data are available on at least two
18F-FDG PET-CT scans over the whole RT course to evaluate changes in FDG
12 this intensive monitoring during the treatment would also be to adjust the treatment
plan according to the change in tumour volume in response to RT (adaptive RT) (17).
13
14 Aim: To assess response evaluation of nodal status in post treatment
18F-FDG-PET-CT scans in HNSCC using a 5-point Likert scale (Deauville score (DS)).
Objectives:
1. To assign Likert scale (Deauville criteria score (DS)) and SUVmax to all
follow up PET scans
2. To determine whether interpretation of follow up PET scans can be improved
15
16
A.
Positron Emission Tomography
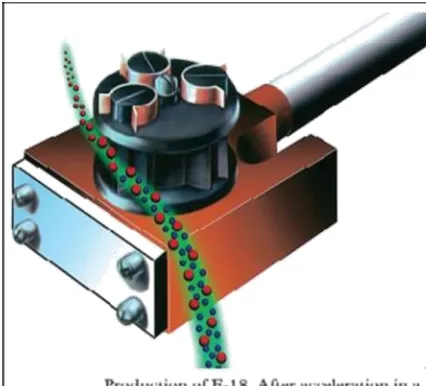
1.
Principles of F-18 and FDG Production -
Positron Emission Tomography(PET) is a nuclear imaging modality which enables studies of the uptake and
metabolism of a positron emitting radionuclide. These can be visualized and
quantified. Those which have protons excess have two modes of decay - by
electron capture (EC) or positron decay. PET scanner cannot image isotopes
undergoing EC. PET imaging uses radioactive substances such as Fluorine-18,
Carbon-11, and Oxygen-15 which are positron emitters. Fluorine, 18F is the
most common radionuclide in oncologic imaging, the generation of which
happens by a powerful accelerator
called as cyclotron. In this
accelerator the protons are
accelerated and merged with
18-Oxygen (18O) that simultaneously
evaporates a neutron.
The half-life of 18F is 110
minutes. It decays in the following
manner:
[image:16.595.300.513.349.542.2](where is a positron, ν is a neutrino)
.
Figure 1: Production of F18. Calif: Crump Institute
17 PET facilities therefore need a certain proximity to the cyclotron site where the tracer
is produced. 18F, as an unstable radionuclide, is attached to deoxyglucose to produce
2-deoxy-2-FDG (glucose analogue).
Emission of positron from 18F causes it return to a stable 18O nuclide. After
travelling few millimetres, positron collides with several electrons and loses energy.
Annihilation phenomenon is produced by colliding with yet another electron almost at
rest. The mass of the positron and electron is extinguished In this process and two
photons of 511keV are produced, travelling in equal and opposite directions (180°
angle). Coincidence occurs in a PET camera, when photons that are opposite to each
other and simultaneously, hit the detectors are registered in the gamma detectors and a
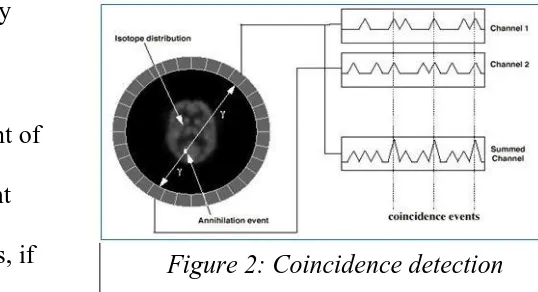
18 1.
Coincidence detection -
The nearly back-to-back two gamma rays is the keyto PET. The detectors are made of crystals which have high atomic numbers
and densities; for example, bismuth germinate (BGO), cerium-doped
gadolinium silicate (GSO) or cerium doped lutetium oxyorthosilicate (LSO).
For 511 keV photons, the coincidence detection efficiency for 25 mm LSO or
BGO crystals is approximately
80%.
There is a likelihood that event of
annihilation must have straight
line between the two detectors, if
two detectors which are placed on opposite sides of the patient record an event
at nearly the same time. Two detectors are said to be “in coincidence” when the
events are detected by camera at almost the same time in both detectors. The
key to PET images his ability to identify these coincident events is (18). This
“electronic collimation” through coincidence detection makes PET more
[image:18.595.263.532.228.374.2]efficient than other nuclear medicine studies.
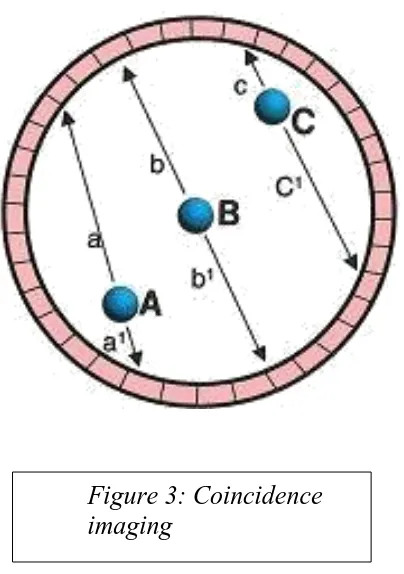
19 Coincidence imaging.
The photons emitted by annihilation points A and C are in coincidence, but the distances they will travel before they reach the scintillation crystals are
different. There is a predetermined time window within which detected photons are considered to be in coincidence. Therefore, even though photons a and a1
and c and c1 are coincident, they will be
electronically rejected as non-coincident. However, the coincident photons from point B are likely to reach the
[image:19.595.70.272.94.381.2]scintillation crystals within the time window and will be accepted as coincident. Kapoor et al, 2004 Figure 3: Coincidence
20
2.
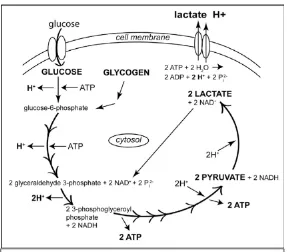
Tumour and FDG metabolism -
Glucose is transferred into cells byfacilitative glucose transporters (GLUT) proteins. There are known 13 isoforms
of GLUT holding different affinities for hexoses. Overexpression of GLUTs,
especially GLUT1 happens early in many types of malignant transformation
which reflects an increased glucose demand in tumour cells (19). In the start of
the 20th century, biochemist Otto Warburg, described how glucose is avidly
consumed by cancer cells and produce lactic acid even under aerobic
conditions which was called the Warburg effect, also identified as aerobic
glycolysis (20). This shift to aerobic glycolysis is probably multifactorial and
Ngo et al explains it in the following manner. Cancer cells releases lactate
which is beneficial for the microenvironment and helps in tumour growth and
probability of metastasis. Furthermore, with a less involved oxidative pathway,
the amount of reactive oxygen species is reduced that influences cellular
activities affecting apoptosis. Another reason is that the generation of biomass
instead of energy is important if the proliferative capacity is to be maintained
(21). In glycolysis there is a ten-step pathway in which one glucose molecule is
converted into two pyruvate molecules, two ATP and two reduced
nicotinamide adenine dinucleotide, NADH. In the presence of oxygen,
pyruvate can be further metabolized to acetyl-CoA which is a major fuel for the
citric acid cycle. In anaerobic condition, in cells that lack mitochondria or if a
Warburg effect is present, pyruvate is reduced to lactate that is a less efficient
pathway in terms of generating ATP (22) (fig 4). The augmented urge for
21 tissue is a prerequisite for PET. FDG uptake in the cells occurs by the same
GLUTs, as glucose. They also share the primary glycolytic step, a
phosphorylation, catalysed by hexokinase. Unlike glucose-6-phosphate,
phosphorylated FDG is not further metabolized and being a polar molecule
[image:21.595.155.442.310.562.2]becomes trapped in the cell.
22 During the accumulation phase extra glucose demanding cells will accumulate
more FDG compared with normal cells and this relative difference in FDG
accumulation will show uptake on the PET scan (fig 5). The fact that the
amount of FDG uptake is correlated with the glucose demand is of very
[image:22.595.72.527.71.296.2]essential value in oncologic imaging and therefore tumour viability.
Figure 5 Relative difference in FDG accumulation between tumour cells and normal cells will be revealed on PET-CT imaging.
23 1.
PET development -
The first images using annihilation radiation followingpositron emission were produced in the early 50’s, initially attempting to pick
up brain tumours. This application had a simple probe and two opposed
coincidence detectors. It was in the middle of 1970s that more powerful
cyclotrons, producing isotopes including 11C, 13N, 15O and 18F became
widely available. 18F-FDG was first produced in 1978. A concurrent technical
development to more sensitive and sophisticated detection devices ultimately
resulted in high resolution images acquired from multiple small detectors
placed in a circle around the positron-emitting subject. The resolution of
modern PET cameras in clinical use is approximately 5mm. Compared to CT
or MRI the spatial resolution in PET is poor. In order to obtain structural
correlation and attenuation correction, modern PET cameras are integrated with
CT scanners (and recently also, MRI scanners). These dual modality systems
can automatically fuse both functional and structural images.
This is remarkable since studies published ten years ago or more usually refer
to PET as single PET studies but currently, as in this study, PET implies
PET-CT. PET is combined with a contrast enhanced CT for attenuation correction
and anatomic localization.
In staging procedures (23) as well as for distinguishing a benign versus
24
Imaging procedure - PET studies are performed after a four to six hour fasting
period. This is because FDG competes with endogenous glucose for uptake into
the cells and the FDG uptake in tumour cells can be reduced by increased
serum glucose levels (25). In addition, another factor which disturbs the image
quality is meal associated insulin secretion which can cause a diffuse muscular
FDG uptake (26). The blood glucose is then measured and should be <150
mg/dl. If the blood glucose is higher, the patient is scheduled at a later date.
After an intravenous injection of FDG, with a dose of 3.7 MBq/kg body weight
to maximum 370 MBq, the patient rests for the forty-five minutes to one-hour
uptake period. The scan time for acquired images is two minutes per bed
position. CT scan is performed initially, on free breathing and at low amperage
dose. This CT scan provides an attenuation map in order to correct PET
images, which is actually a distribution map of attenuation coefficients
measured by CT and helps to obtain more legible PET images, thereby
25 2.
Assessment of PET scans -
Most publications regarding PET-CT in HNSCChave been dealing with response to treatment assessment. Conventionally, in
1980s according to the World Health Organization response evaluation criteria
and from 2000 according to Response Evaluation Criteria in Solid Tumours
(RECIST), the tumour response is measured by tumour shrinkage (28). In
bulky tumours especially, the tumour shrinkage occurs later than the metabolic
response and this will occur even if minor clones of resistant tumour cells are
present which make evaluation of the metabolic response in these scenarios
valuable. In view of the status of PET technique in 1999, European
Organization for Research and Treatment (EORTC) PET study group brought
out a paper with recommendations on how to measure FDG uptake for tumour
response monitoring (22). During that time integrated PET and CT scanners
were yet to be integrated. Based on the EORTC paper, Wahl et al in 2009
summarized the present status, recent studies and an update on RECIST and
they introduced PET Response Criteria in Solid Tumours (PERCIST) (29).
PERCIST wass intended to be used in clinical trials and in structured
quantitative reporting of PET results but it is not widely used. Several
technical, physical and biological factors influence the PET outcome. Though
they have a relatively small effect, the accumulation of small errors can lead to
substantial differences in outcome. The most common factors influencing PET
assessment according to Boellard include camera related factors such as
relative calibration and incorrect harmonization of clocks between camera and
26 wrong time interval for decay correction, scan acquisition, image
reconstruction limits and the determination of region of interest (ROI).
Biologic factors relate to the blood glucose level, the accumulation phase,
inflammatory changes, the comfort of patients, motion and breathing (30).
a. Quantitative assessment –In this analysis, a ROI encompassing the tumour is
drawn manually or by software solutions. The amount of radioactivity within
this ROI is measured.
b. Semiquantitative assessment - Standardized uptake value (SUV) is called a
semiquantitative measurement of activity in a region at a fixed time point. SUV
relates tissue activity to injected activity and the body mass (or area) of the
patient.
SUV = mean regional activity (Bq / mL)
injected activity (Bq) / body weight (g)
This is one of the most widely used method of calculating FDG uptake in PET.
In the SUV measurement the body weight is also a factor to be considered.
Another factor is the plasma activity of FDG that is assumed to be steady.
Various types of SUV methods are used, the most common are:
• SUVmax, the highest single pixel/voxel value and the most frequently used
parameter
• SUVmean, the mean SUV value of a number of voxels in a volume of
interest.
• SUVpeak, the average SUV within a small, fixed-sized ROI, centred on a
27 The type of SUV method to be selected depends on whether the metabolically most
active portion of the tumour is more important or the total tumour volume? Or are
they equally important? Vanderhoek et al have analysed tumour response with these
different types of SUV methods. On average, a 20% variation of individual tumour
response was noted (ranging up to 90%). The tumours ending up in different
categories of response were found to be more than 80% when different SUV methods
were used (31).
Using SUV as outcome, with the PERCIST criteria comparison of different studies is
still difficult because of the different parameters and the different formulas used for
calculation.
In a clinical setting, SUV may not give additional information to a visual
evaluation and cannot replace, but might support, the nuclear physician in the
interpretation of PET images.
Other parameters based on SUV are metabolic tumour volume (MTV) and total
lesion glycolysis (TLG), also called SUVtotal. Both of them help in prognosis and are
used as biomarkers of therapeutic response (32). Different methods with
various thresholds can be used to find out MTV and no absolute standard is
standardised. On pre-treatment scans MTV has a higher prognostic value than
SUVmax (32). TLG combines both metabolic and anatomic data and the total tumour
28 c. Qualitative assessment - In this assessment, the distribution and intensity of the
FDG uptake in suspected tumour foci are compared with the uptake in normal
structures such as surrounding tissue, brain, mediastinal blood pool and liver.
For a good qualitative interpretation, it requires clinical experience, knowledge
of normal distribution and artefacts as well as awareness of expected disease
pattern. Qualitative assessment usually ends up in either of these three
categories: positive/indicative for tumour, negative/not indicative for tumour or
equivocal. The data on reproducibility of qualitative assessment is scarce. A
Likert scale helps to improve qualitative assessments and PET reports. A
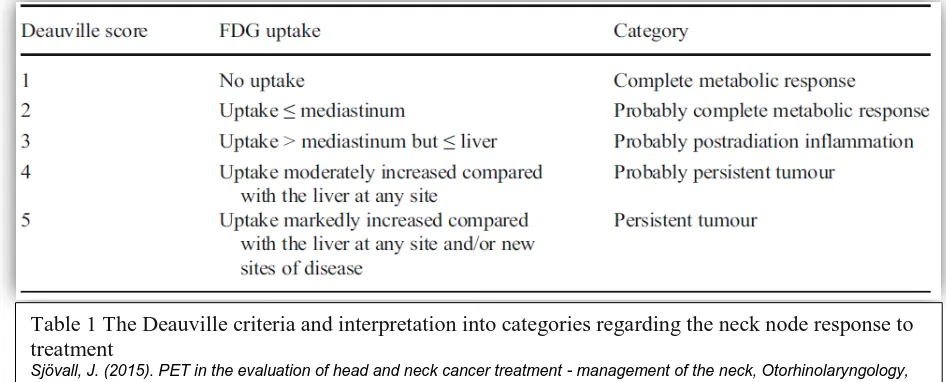
5-point Likert scale, the Deauville criteria, is validated for lymphoma studies and
the concordance between readers is good (33).
Recently the Hopkins criteria was introduced for head and neck cancer, that
[image:28.595.79.552.475.666.2]also shows substantial inter-reader reliability (34).
Table 1 The Deauville criteria and interpretation into categories regarding the neck node response to treatment
29
B.
Head and neck cancer
Head and neck cancers have taken a great toll of lives among other cancers in
developing countries across the globe. In India, HNSCC’s have been a significant
problem constituting approximately one-third of all cancer cases. On the other hand,
in the developed world it constituted only 4–5% (35). Upto 95% of the carcinomas
affected mucosal linings of the upper aerodigestive tract and they involved the lip, oral
cavity, nasal cavity, paranasal sinuses, pharynx, and larynx. The accurate staging at
diagnosis optimised treatment planning with improved outcomes.
18F-FDG PET-CT has shown significant value at diagnosis for accurate staging,
prompt planning of treatment, and prognostication of many different types of cancer,
including HNSCC. More importantly, it also helps in long term surveillance after
definitive therapy for assessing response.
However, the poor spatial resolution of PET and the lack of anatomic landmarks can
make precise localization of disease difficult. In addition, normal anatomic structures
may show variable FDG uptake causing errors in interpretation. As a result, combined
PET-CT scanners have become available that allow for both structural and functional
characterization of disease at the same time (36). There is improved localization of
abnormalities, better differentiation of therapeutic changes for residual disease, and
improved assessment of extent of tumour.
Hence PET-CT has transformed the staging and surveillance of patients with
HNSCC by allowing further accurate staging, more focussed treatment modalities,
30 overtreatment. Besides, the combined modality has improved the confidence of
radiologists (2).
Functional imaging with 18F-FDG PET-CT have been used to improve
characterization of both primary tumours and metastatic cancer.
Chemoradiotherapy (CRT) has turned out to be a backbone of primary treatment in
patients with HNSCC because it provides higher response rates than RT alone.
Negative 18F-FDG PET or PET-CT findings after concurrent CRT have a high
negative predictive value (NPV) (95%) (37,38). Therefore, in many centres, CRT has
become the favoured first line of treatment for several types of HNSCC, especially of
the base of the tongue, tonsil, larynx and hypopharynx. FDG PET-CT is highly
sensitive (>95%), for identifying malignancy in the head and neck region (39).
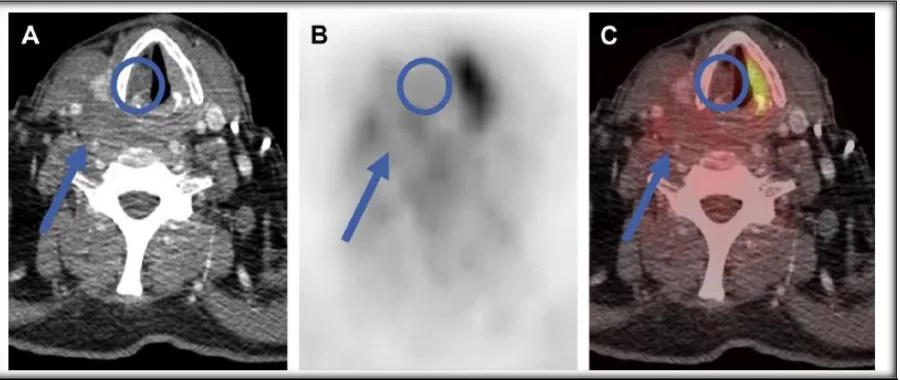
Fig. 6 False-positive PET suggests nodal disease. (A) Axial PET image is worrisome for left Zone II lymphadenopathy (arrow). (B) Fused PET/CT image correctly localizes the FDG uptake to the submandibular gland, avoiding a false-positive interpretation.
31 The main indication of 18F-FDG PET-CT in newly diagnosed HNSCCs is FDG avid
cervical lymph node detection, which is one of the most important prognostic factors.
18F-FDG PET-CT is particularly useful for staging, restaging, RT planning and
assessment of treatment response in HNSCC patients, due to its superior accuracy
over clinical examination and conventional anatomic imaging (40).
Goerres and colleagues (41) showed that PET-CT found distant metastases or second
primaries in 24% of their patients newly diagnosed with SCC of oral cavity initially
screened by clinical exam, CT, and chest x-ray. Similarly, Ha and colleagues (42)
found that the TNM score was altered in 31% of their patients with previously
untreated HNSCC initially staged with CT or MRI. PET-CT allows for better
characterization of equivocal abnormalities on CT by PET and for more accurate
anatomic localization of abnormalities on PET by CT (43). PET-CT is the modality of
choice for staging of patients with advanced HNSCC with superior sensitivity than
conventional modalities for the detection of metastases.
1.
Staging in HNSCC
The tumour-node-metastasis (TNM) staging system of the American Joint Committee
on Cancer is most commonly used to prognosticate and guide therapy for HNSCC.
(44)
In a study done by Rhode. et al, in total, 307 patients with histologically
verified HNSCC were included. Use of PET-CT significantly altered the stratification
of tumour stage when compared with either chest x-ray plus head and neck
MRI (CXR/MRI) or chest CT plus head and neck MRI (CCT/MRI) (χ2, P < 0.001 for
32 associated with significant differences in mortality risk on Kaplan-Meier analyses (P ≤
0.002 for all PET-CT-based comparisons). Furthermore, overall discriminative ability
was significantly greater for PET-CT (C-index, 0.712) than for CXR/MRI (C-index,
0.675; P = 0.04) or CCT/MRI (C-index, 0.657; P = 0.02) (45).
FDG PET-CT is a valuable imaging tool for identifying unknown primary tumours in
patients with known cervical node metastases leading to management change and is
the standard of care for the initial staging of stage III and IV HNSCCs, for assessing
therapy response when performed at least 12 weeks after CRT, and for avoiding
unnecessary planned neck dissection. Irrespective of the size of residual neck nodes,
neck dissection is evaded if PET-CT findings are negative because survival outcomes
are not compromised. FDG PET-CT helps in detecting recurrences and metastases
during follow-up when suspected because of clinical symptoms and is also a
prognostic marker for patient survival outcomes, for 5 years. Using FDG PET-CT for
routine surveillance of HNSCC after 6 months of treatment without any clinical
suspicion should be discouraged (46).
Diagnosing an unknown primary tumour, identifying regional lymph node
involvement and distant metastases, and providing prognostic information are the
major clinical applications of this method. Other used of FDG PET-CT are for precise
delineation of the tumour volume for RT planning and dose painting, and for
33
2.
Utility of 18-FDG PET-CT in Staging
T Staging
The T component in the TNM staging system is built on primary tumour size and
extent of local disease involvement, which varies for various regions in head and
neck.
Krabbe and colleagues (48) reported that sensitivity and specificity of FDG PET-CT
for detecting primary tumour are greater than 90%. Due to the spatial resolution of
PET, small lesions (few millimetres) may not be detected, especially along superficial
mucosal surfaces (49), which is compounded by physiologic FDG uptake in the head
and neck by lymphoid tissues in Waldeyer’s ring, vocal cords, and muscles. In
addition, necrotic primary tumours may not show FDG uptake above background
(Fig. 5) (50). In these situations, contrast-enhanced PET-CT can especially be useful
for augmenting diagnostic accuracy by distinguishing normal muscles and other
[image:33.595.77.527.467.657.2]anatomic structures from pathologic cystic and necrotic tumours.
Fig. 7 False-negative CT overlooks nodal disease. (A) On axial unenhanced CT, the 4-mm lymph node (arrow) is too small to be suspicious by size criteria alone. Tiny calcific foci and a rounded configuration are clues to the true diagnosis. (B) Increased FDG uptake (arrow) correctly suggests malignancy (metastatic papillary thyroid carcinoma).
34
N staging
The N component in TNM staging system refers to the metastatic regional lymph
nodes, among the most significant prognostic factors in HNSCC with the presence,
location and size of the node being important factors (16). Survival decreases to upto
62% in patients with positive nodes, which underscores the importance of accurate
nodal staging (51).
Ryu et.al in their prospective study found that PET-CT changed the clinical workup
(CWU) based TNM classification of 83 lesions in 79 (31.9%) patients; in two patients,
both T and N changed. In the remaining two patients, both N and M changed. In the
remaining 169 (68.1%) patients, PET-CT and CWU findings presented similar TNM
classification. Of the 79 patients with discordant TNM classification, histopathology
was available in 68 (86.0%). In another three patients, the TNM classification was
confirmed either by subsequent imaging and clinical follow-up. It was not possible to
definitively confirm the stage in the remaining eight patients. These cases were not
included when comparing the PET-CT stage and CWU stage in terms of diagnostic
accuracy (52).
Detection of distant metastasis
Overall incidence of distant metastasis in HNSCC is dependent on the stage of
disease, particularly the nodal stage. Overall, it is relatively low with a range of 2 –
18% but tends to be higher with primaries of hypopharynx and nasopharynx (53).
Therefore, screening for distant metastasis, is generally limited to patients with
advanced disease, particularly advanced nodal staging or extension towards the
35 The following is a list of subdivisions of patients with HNSCC in whom screening for
distant metastases would be specified (54).
• ≥ 4 lymph nodes metastases
• Bilateral lymph node metastases
• Metastatic lymph node size ≥ 6 cm
• Zone IV lymph node metastases
• Recurrent HNSCC
• Second primary tumour
As lungs are the most common site of metastasis, patients with high risk HNSCC are
usually staged with CT chest, which is generally more sensitive than PET for very
small pulmonary lesions due to the high contrast between aerated lung and solid
metastases. However, when nodules of uncertain causation are identified, PET can
help to find out those that are around 10mm or larger in size. Nevertheless, as with
nodal involvement, no imaging technique is currently available to spot microscopic
disease. This point is illustrated by a study that demonstrated that on clinical follow up
of patients who had no evidence of distant metastasis on staging CT chest, 11%
developed distant metastases within 12 months after curative treatment without
evidence of loco-regional relapse, presumably from previously occult metastatic
disease.
Numerous studies have, however, been performed to assess the sensitivity of PET-CT
in the detection of distant metastasis for HNSCC. In a recently published prospective
study, 34 patients with previously untreated HNSCC underwent staging PET as well
36 was correctly able to identify previously unrecognized metastases in 6% of the
patients, all of which were extra-thoracic. Ng et al. compared the use of PET with
extended field CT (from base of skull to lower abdomen), and they found that
sensitivity in detecting distant metastases was 76.9% for PET, and 50% for CT
(P=0.039) (56). The overall sensitivity increased to 80.8% if PET and CT were
compared side by side. The enhancement in detection of distant sites of disease by
PET led to alteration of treatment in 13.1% of patients, and a significant difference in
survival rates was observed between positive and negative scans.
3.
Radiotherapy planning
Molecular imaging with 18F-FDG provides a unique opportunity for RT planning in
HNSCCs in terms of selection and delineation of target volumes as well as dose
planning (57). Looking at target volume selection, the additional value of 18F-FDG
PET-CT is finding occult primary tumour in patients with cervical lymph node
metastasis with the possibility of decreasing the RT target volume, and consequently
the acute and late side effects of RT, as well as detection of distant metastases with
high sensitivity (58). For precise delineation of target volumes and organs at risk, the
goal of using molecular imaging is to augment the treatment plan thanks to its superior
sensitivity and contrast resolution over anatomical imaging techniques (59). In the
initial experience of Daisne et al., gross tumour volume (GTV) demarcated from
18F-FDG PET was closest to the pathologic GTV from surgical specimens, and
significantly smaller than GTV delineated by CT and MRI (60). However, subsequent
data were less consistent (59). The main disadvantage is the lack of a standardized
37 shape of the resulting GTV. Further applications of 18F-FDG PET-CT for RT
planning are under clinical investigation, and include the likelihood of directing dose
escalation to 18F-FDG-avid sub-volumes of the tumour as well as adapting the RT
plan during treatment which comes from the information on the biological and
molecular tumour changes induced by therapy (59,61–63).
Moreover, the possibility of targeting radiation-resistant regions within the tumour on
the basis of biologic information of molecular imaging is under investigation, for
example the identification of the hypoxic volume within the GTV by using
hypoxia-related PET tracers to deliver higher doses to hypoxic cells (63).
4. Neck Dissection
Spread by the lymphatics has been shown in HNSCC and in a fairly predictable
manner (64). However, this rationale is recently interrogated in a subgroup of patients
with p16-positive tumours where a haematogenous spread of tumour cells is suggested
as the pattern of distant metastasis (65).
The lymphatic spread has been recognized from the 19th century when the first
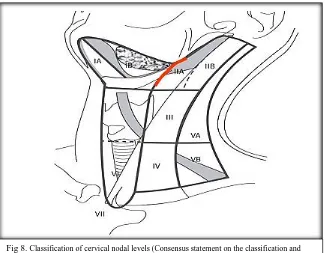
surgical lymphadenectomies, ND, were described (66). The anatomy of the neck is
divided into six different neck node levels (some refer the superior mediastinal nodes
caudal to the suprasternal notch but cranial to the innominate artery to a seventh
38
The degree of the ND depends on several variables: the location of the primary
tumour, lymph node metastases, the risk of microscopic/occult
disease and whether staging or curative procedure is required. The ND procedure is
performed for a few hours under general anaesthesia, followed by few days of
hospitalization.
Consequences of neck dissections
A ND with clear margins is a safe procedure with decent therapeutic outcome but can
be associated with a high rate of morbidity. A thorough assessment before the
operation is essential in order to avoid cardiovascular events linked with anaesthesia
as risk factors for HNSCC includes smoking and drinking which also contributes to
comorbidities.
It is important to prepare for a safe airway during induction of anaesthesia because the
primary tumour itself and/or given RT might alter the upper airway anatomy and
[image:38.595.112.437.70.323.2]induce trismus.
39 Although uncommon, intra- or postoperative bleeding, infection, chylous fistulas and
flap necrosis can occur as immediate surgical complications. Also a partly temporary
facial and/or submental oedema maybe be expected after the procedure. The ensuing
scarring and sometimes altered contour of the neck, can be apparent as a cosmetic
problem.
Numerous cutaneous sensory nerves are per se sacrificed during a ND and can
sometimes lead to persistent, dull neck pain. Depending on the tumour location, other
nerves might also be sacrificed or accidentally injured. Lower lip weakness is
produced by injury to the facial nerve (marginal branch) and Horner syndrome may be
seen due to sacrificing of the cervical sympathetic chain. Severe dysphagia may be
caused by bilateral hypoglossal nerve damage but unilateral resection is usually well
tolerated in that aspect.
A winged scapula, a shoulder droop, a reduced range of movement and a dull pain
occurs due to injury to the accessory nerve that causes shoulder weakening and is one
of the most common nerve damaged. Even if a functional or selective ND is
performed, the sheer manipulation to keep the accessory nerve intact, sometimes
seems to disturb the nerve or nerve compression might be caused by postoperative
related fibrosis. (68,69).
Dysphagia, a sequela usually ascribed to RT, is recently associated with ND as well.
ND increases the risk to 4-folds of feeding tube dependency 18 months after surgery
compared with RT or CRT alone (70). There is chance of aspiration due to dysphagia.
40 after RT than those who had undergone operation (p=0.013, Lindblom et al,
unpublished data). Injured sensory fibres from the vagal nerve might be one of the
causes of a reduced sensibility in the supraglottic and glottic regions.
It has been reported by Donatelli Lassig et al that quality of life one year after CRT in
combination with ND compared with CRT alone does not differ significantly, as
measured by Short Form Health Survey (SF-36). The ND group only reported greater
levels of pain (71).
On the other hand, Eickmeyer et al, have observed 5-year survivors after HNSCC
treatment. Diverse quality of life parameters were addressed as well as
measurement of shoulder mobility. A significant adverse long-term effect on shoulder
mobility was noted and even worse if the accessory nerve was sacrificed. A ND also
had undesirable impact on activity in general, speech and eating in public (72). This
has caused a debate whether planned ND following CRT with curative intent is
required.
5.
Treatment response assessment
An accurate response evaluation is essential in the management of patients with
HNSCC treated with CRT. 18F-FDG PET-CT is commonly used to assess treatment
response, since it detects viable tumour within residual masses, thus overcoming the
known drawbacks of morphological imaging modalities. In particular, 18F-FDG
PET-CT has a high NPV (> 95%) that spares the patient of needless diagnostic invasive
procedures and neck dissection in many cases (about 75%), with a significant effect
on patient outcome and morbidity, and low risk of under-treatment (about 2%)(73)
Early detection of residual or recurrent disease following RT is a diagnostic challenge
41 (74). Correctly identifying patients requiring salvage-tailored treatments is the key
role of a diagnostic tool evaluating treatment efficacy. Moreover, an early detection of
relapse could help in the selection of patients who could be successfully retreated (75).
In this setting, 18F-FDG-PET-CT is an exciting modality to evaluate response to
treatment, as it can assess metabolic activity-rendering malignant process.
PET/ CT staging has a prognostic role in HNSCC. PET-CT staging separated the
hazard ratios for both progression free survival (PFS) and overall survival (OS) better
than CWU staging, regardless of which treatment was employed. Multivariate analysis
revealed that PET-CT staging independently predicted worse PFS and OS (52).
Timing
- The timing is very important in determining the accuracy of 18F-FDGPET-CT, as RT-induced inflammation of the mucosal tissues surrounding the tumour could
hinder the interpretation of images in both the early and late phases of treatment. The
best timing to evaluate tumour response during RT in HNSCC patients is not yet
defined, because a significant increase in FDG uptake early (within the third week of
CRT) in the treatment due to inflammatory reactions and repair processes has been
reported (76). For the purpose of RT replanning, Hentschel et al (77) suggested that
therapy-associated inflammation of the mucosal tissue surrounding the tumour limits
the proper definition of tumour volume mainly from the third week of concomitant
CRT. They also found that whereas the median SUVmax decreased, the median
values of gross tumour volume delineated on the PET images and metabolic tumour
volume seemed to increase during RT.
The timing of a post-RT PET-CT is often debated, and different protocols have been
42 after 12 weeks post-RT was shown to be dependable when neck node response was
assessed (79). Full effect following RT must be allowed before therapy evaluation; on
the contrary, should a salvage treatment be required this should be performed without
unnecessary delay. Therefore, the ideal timing of PET-CT is debated since fulfilment
of both criteria is necessary.
The PET-NECK trial found that PET-CT–guided surveillance resulted in fewer neck
dissections than did planned dissection surgery (54 vs. 221); the rates of surgical
complications were similar in both the groups (42% and 38%, respectively). The
2-year overall survival rate was 84.9% (95% confidence interval [CI], 80.7 to 89.1) in
surveillance group and 81.5% (95% CI, 76.9 to 86.3) in planned-surgery group. The
hazard ratio for death slightly favoured PET-CT–guided surveillance and indicated
noninferiority (upper boundary of the 95% CI for the hazard ratio, <1.50; P = 0.004)
(37). They came to a conclusion that neck lymph node dissection was only indicated
when PET-CT presented an incomplete or equivocal response) to planned neck
dissection in a total of 564 patients with locally advanced HNSCC (Stage N2 or N3
disease), who underwent CRT for primary treatment (37).
Ong et al. studied 65 patients (84 heminecks) after concurrent CRT. 18F-FDG
PET-CT was performed on all patients at least 8 weeks after the end of therapy. The
standard of reference consisted of histopathology of neck dissection specimens or
clinical and imaging follow-up. In this study, the sensitivity and specificity were 71%
and 89%, respectively, with a positive predictive value (PPV) of 38% and a NPV of
97%. All false-positive lymph nodes in neck dissection specimens showed either
43 18F-FDG uptake in lymph nodes. Nevertheless, the fraction of false positive studies
could be decreased from 27% to 10% when the neck was assessed by combined
PET-CT rather than by structural imaging alone, while maintaining a high NPV of 97%.
The true value of post therapy 18F-FDG PET in patients treated with current RT or
CRT is the high NPV. Many patients who might otherwise proceed to biopsy or
planned ND can in fact be observed with clinical follow-up and periodic imaging
studies (80).
It is the consensus view of the multidisciplinary head and neck cancer team at
Memorial Sloan-Kettering Cancer Centre that a dedicated neck CT scan
with intravenous contrast material and 18F-FDG PET (potentially in a single imaging
session) should be performed about 10–12 weeks after the end of therapy, unless it is
felt that clinical management requires imaging earlier. This time point strikes a
balance between the clinical desire for early, yet accurate, response assessment and
the surgeon’s desire not to unnecessarily perform a neck dissection on tissues in which
extensive fibrosis and scar tissue have developed as the result of CRT.
Shrinkage of large nodal masses will take time; early imaging after the end of therapy
will only cause uncertainty and will rarely provide guidance for management (38).
18F-FDG-PET-CT could have a potential interesting role in patients’ follow-up with
HNSCC. In spite of that, the clinical advantages and economic costs of this issue have
not yet been largely addressed. One of the largest studies has been published by a
group from Pittsburg (75). They retrospectively evaluated 388 patients to assess the
recurrence rate after radical CRT among patients who underwent PET-CT
44 37 symptomatic). Indeed, 95% (95% CI, 87–98%) of asymptomatic recurrences were
observed within 2 years of follow-up. The authors wanted to evaluate patients for
recurrence with PET-CT at 2, 5, 8- and 14-months post-treatment as their study
demonstrated that PET-CT detected almost all HNSCC recurrences within 2 years.
6.
Effect of SUV
Two meta-analyses were conducted to estimate the effect of SUV on the prognosis of
HNSCC. First, Zhang et al (81) evaluated the potential of SUV [SUVmax and mean
SUV (SUVmean)] as a prognostic marker. They concluded that increased
SUVmax/mean of primary tumour is a poor prognosis factor and has a potential value
in predicting local tumour control, disease-free survival and overall survival.
Thereafter, Xie et al (82) did another meta-analysis to evaluate the prognostic value of
SUV, confirming that low primary tumour SUV was linked with better survival
prognosis. It should be noted that SUV estimates suffer from poor reproducibility
between centres because there is lack of standardization of the acquisition and
processing protocols.
In a study done by Hall-Edwards Radiotherapy Research Group, UK (83), the overall
PPV of PET-CT was low but was found higher for nodal recurrence compared with
primary site recurrence. The PPV of a PET-CT with SUVmax > 6 was 100% for nodal
disease and 92% for primary disease with SUVmax > 8. They found that these results
could contribute to developing risk-stratified follow-up schedules. Further assessment
should be undergone by patients with an early positive PET-CT at the primary site due
45
7.
Interpretation pitfalls
A diversity of possible 18F-FDG-PET-CT interpretation pitfalls and artefacts can be
observed on routine head and neck studies. Among the various causes, the most
common interpretation pitfalls are caused by variable physiological FDG uptake in
salivary glands, within Waldeyer’s ring, muscles or brown adipose fat (BAT) and by
increased FDG uptake owing to inflammatory and infectious conditions, recent
surgery, previous CRT, contralateral cranial nerve palsy and thyroid nodules with high
glucose metabolism. Less often, lesions may be missed on PET-CT because of low
FDG avidity, small lesion size or owing to low scanner resolution. Common artefacts
seen in the head and neck area are related to metallic implants and dental hardware or
may arise due to patient motion between the CT and the PET acquisition (84).
The head and neck muscles often show physiological uptake. It is frequently possible
to trace a linear uptake from origin to insertion on fused images. The factors that
decrease muscular uptake such as talking, chewing and eating after the FDG injection
must be avoided (85).
False negative PET scans might be caused by various factors. There is a phenomenon
called the partial volume effect wherein small tumours,
approximately less than 5 mm, may not be consistently detected. It refers to two
different camera related issues that cause underestimation of the activity of a small
source – one is the limited spatial resolution and the other is image sampling
technique. PET camera resolution is one of the main causes of the extent of this
46 The type of tumour is also an issue. As examples, adenoid cystic carcinomas,
well-differentiated sarcomas, extranodal marginal zone lymphomas and also any type of
necrotic tumour may not be FDG avid.
If the malignant lesion is situated in the proximity of an area with high FDG
accumulation like close to the brain or the tonsils the lesions might be overlooked or
47
48 A. Study design and setting
The present study was retro-prospective analysis of nodal status of pre and post-RT
PET-CT in patients diagnosed with HNSCC (n=45) from May 2013 - March 2018.
Patients provided consent for the scans (but was under a waiver of informed consent
approved for those in the retrospective series), and the study was approved by the
Institutional Review Board.
B. Inclusion criteria
Patients with node positive SCC of the larynx, hypopharynx and oropharynx, planned
for organ preservation therapy with curative intent, and with no prior neck surgery,
were included in the study. Patients were only eligible if the neck nodes demonstrated
hypermetabolism on the pre-RT PET scan.
49 C. Methods
All 45 eligible patients (35 male, 10 female; mean age ± SD, 53 ± 13 years)
underwent a pre-RT PET-CT scan before the start of RT. Another post-RT PET-CT
scan was performed 12 weeks after completion of RT. Patients without a pre-RT
PET-CT study, without primary HNSCC, and with node negative scans were excluded.
The median time from completion of RT to post-RT PET-CT was 92 days; 80% of the
patients had their post-RT PET-CT scan between 77 and 147 days after therapy.
The PET result helped in the decision regarding neck dissection versus observation.
The multidisciplinary team ultimately decided whether patients with an equivocal
post-RT PET-CT scan would undergo neck dissection or be scheduled for third PET
(PET3) scan. The decision was based on a various prognostic factors including initial
N classification, human papillomavirus (HPV)/p16-status if possible, performance
status and also the post-RT clinical response. Clinical follow-up examinations were
scheduled every 3 months during the first 2 years after either neck dissection or
negative PET3, every 4 months in year 3 and every 6 months during the last 2 years of
follow-up.
PET imaging in accordance with our standard clinical PET protocol, the patients were
injected intravenously with FDG 3.7 MBq/kg body weight to a maximum dose of 370
MBq after a 4-6 hour fasting period. All patients were imaged with an integrated
PET-CT system (Siemens Biograph True Point 6). After a 45 min - 1-hour uptake period at
rest, images were acquired for 2 minutes per bed position. At baseline and for
follow-up studies, the CT scan was acquired together with the PET scan. CT scans helped in
50 D. Image interpretation
All PET scans were visually evaluated by nuclear medicine physicians regarding
metabolic response (87).
In this study two experienced readers, without prior knowledge of the clinical
outcome, re-evaluated all patients regarding metabolic neck node response. Images
were assessed and SUVmax levels obtained using Multimodality workplace (Siemens
Syngo 2009B, VE36 A SL10P25 sMMWP SPO4). Metabolic responses were scored
according to the Deauville score (88).
Overall assessment is denoted by the overall score, which is the highest score among
the scores for all the neck nodes. The Deauville scores are given in Table 1 together
51 Examples of corresponding PET images are shown in the following figures. If FDG
uptake was seen in the neck nodes, the highest uptake was scored
.
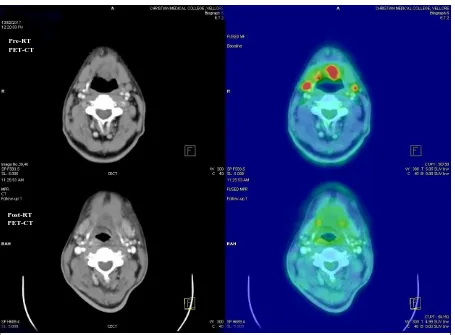
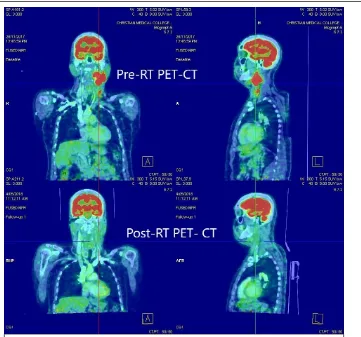
Fig: 9 - 65/M with Carcinoma tongue, T4N2M0 with pre-RT PET showing bilateral level 2a with highest SUV of 7.85 and post RT PET after 12 weeks showing no nodal recurrence – DS 1
Pre-RT PET-CT
[image:51.595.72.527.129.464.2]52
Fig: 10 - 50/M with Carcinoma left oropharynx, T1N2bM0 with pre-RT PET showing left level 2, 3 nodes with highest SUV of 9.12 and post- RT PET after 12 weeks showing significant regression
Fig: 11 - In the same patient, Post-RT PET showed left level 3 node with SUV of 2.97 and when compared with mediastinal blood pool was found to have DS 2.
[image:52.595.123.484.405.742.2]53
[image:53.595.127.469.364.703.2]Fig: 13 - In the same patient, Post-RT PET showed right level 2 node with SUV of 2.47 and when compared with mediastinal blood pool was found to have DS 3.
54
Fig: 14 - 55/F with carcinoma right pyriform sinus, T3N0M0 with pre-RT PET showing right level 2, 3 nodes with highest SUV of 9.68 and post- RT PET showing residual right level 3 node
[image:54.595.130.468.396.737.2]55
Fig: 16 - 51/M with carcinoma hypopharynx, T4N2aM0 with pre-RT PET showing right level 2, 3 nodes with highest SUV of 26.78
[image:55.595.155.441.420.615.2]56 E. Definitions
A complete response to RT in the neck and regional control (RC) was defined as no
residual or recurrent tumour in the neck after completion of RT until the last date of
follow-up in our institution. A residual tumour in the neck was categorized as
persistent tumour, according to the pathology report, after neck dissection planned as a
result of the post-RT PET or PET3 scan. The Deauville criteria Likert scale was
dichotomized into responders (scores 2 and 3) and nonresponders (scores 4 and 5).
A post-RT PET scan demonstrating a DS of 2 or 3 was considered true negative if the
patient did not have any tumour on histopathological correlation after neck dissection,
or any neck relapse during follow-up. In false-negative post-RT PET scans, either
residual tumour was found or a relapse occurred during the follow-up period. Scans
reported as showing DS of 4 or 5 were considered true-positive if neck dissection
revealed residual tumour, according to the pathology report, or if there was
progressive neck disease in patients with non-operable disease during the clinical
follow-up. It would be considered false-positive on post-RT PET scans, if no residual
tumour, according to the pathology report, was found in the neck dissection specimen.
F. Statistical analysis
Data were summarized using the mean (SD)/Median for continuous variables based
on the normality. The categorical data were expressed as number and frequency. The
change in SUV from pre-RT PET to posRT PET was analysed using paired
t-test. The association between the categorical data were analyzed using Fisher's exact
test. The log-rank test was used to compare the categorical predictors over the
recurrence. A p value of <0.05 was considered statistically significant. All the analysis
57
58
A.
Patient and tumour characteristics
Forty-five patients (35 male and 10 female) who fulfilled the criteria were included in
the given study period
.
Characteristic Value
Age (years), median
(range) 18-80, 54
Gender
Female 10 (22.2%)
Male 35 (77.8%)
Primary site (n=45)
Nasopharynx 9 (20%)
Tonsil 5 (11.1%)
Oropharynx (other than
above) 12 (26.7%)
Hypopharynx 9 (20%)
Larynx 10 (22.2%)
T classification (n=45)
T1 6 (13.3%)
T2 8 (17.8%)
T3 15 (33.3%)
T4 16 (35.6%)
N classification
N0 11 (24.5%)
N1 10 (22.2%)
N2 22 (48.9%)
N3 2 (4.4%)
Treatment
Radiotherapy 45
[image:58.595.173.426.149.552.2]Concurrent chemotherapy 43
59 Fifteen out of forty-five patients (33.3%) were under the age of 50 years and thirty out
[image:59.595.186.417.72.266.2]of forty-five patients (66.7%) were above the age of 50 years
.
Figure: 19 Age-wise distribution
411
27
3
0 5 10 15 20 25 30
18 - 30 31- 50 51 -70 > 70
No.
of p
at
ien
ts
Age (years)
[image:59.595.70.537.330.646.2]Age Distribution N = 45
60 The primary site of tumour was classified as nasopharynx (20%), tonsil (11.1%),
[image:60.595.126.474.132.444.2]oropharynx (26.7%), hypopharynx (20%) and larynx (22.2%)
.
Figure: 20 Primary site
9 512 9
10
0 5 10 15
Nasopharynx Tonsil Oropharynx Hypopharynx Larynx
No. of patients
61
B.
TNM Classification
[image:61.595.117.469.75.734.2]Figure: 21 T classification
Figure: 22 N classification
68
15 16
0 5 10 15 20
T1 T2 T3 T4
No. of pts
T classification
11 10
22 2
0 5 10 15 20 25
N0 N1 N2 N3
No. of pts
62
Figure: 23 M classification
43
2
M classification
M0
63 C. Deauville Criteria Score
Deauville score was assessed based on the nodal FDG activity of post RT-PET scans
when compared with pre-RT-PET scans. It was compared with mediastinal, liver
blood pool or both. Then it was categorised into the following groups: DS 1, DS 2-3
and DS 4-5. DS 1 was found in 22 patients, DS 2-3 in 19 patients and DS 4-5 in 4
[image:63.595.127.468.263.576.2]patients.
Figure: 24 Distribution of DEAUVILLE SCORE (DS)
22
49%
19
42%
4
9%
Distribution of DEAUVILLE SCORE (DS)
64 Of the 22 patients in the DS-1 group, the SUVmax levels of the most active neck node
in pre-RT PET scans were ranging from 2.6-23.72 (median SUVmax 8.8) and the
neck nodes did not show any FDG activity in their respective post-RT PET scans.
Of the 10 patients in the DS-2 group, SUVmax levels of the most active neck node in
pre-RT PET scans of DS-2 group were ranging from 2.5-21.1 (median SUVmax 7.9)
and as compared to SUVmax levels measured in their respective post-RT PET scans
were ranging from 1.83-2.97 (median SUVmax 2.27). Using Wilcoxon signed-rank
test, the p-value was found to be 0.0051 while comparing pre and post-RT SUVmax
levels showing that RT/CRT had significantly reduced the SUVmax levels of the
nodes.
Figure: 25 Comparison of pre and post RT PET SUVmax in DS 2
21.1 2.83 10.28 6.73 16.9 3.29 2.5 4.01 13.34 9.122.31 2.16 2.3 2.35
1.95 2.24 2.21 2.83 1.83 2.97 0 5 10 15 20 25
Pt 1 Pt 2 Pt 3 Pt 4 Pt 5 Pt 6 Pt 7 Pt 8 Pt 9 Pt 10
Comparison of pre and post RT PET
SUVmax in DS 2
65 Of the 9 patients in the DS-3 group, SUVmax levels of the most active neck node in
pre-RT PET scans were ranging from 2.7-21.45 (median SUVmax 5.3) and as
compared to SUVmax levels measured in their respective post-RT PET scans were
ranging from 2.42-3.65 (median SUVmax 3.06). Three out of these nine patients had
histopathologically confirmed residual tumour cells on follow-up. Using Wilcoxon
signed-rank test, the p-value was found to be 0.01 while comparing pre and post-RT
SUVmax levels showing that RT/CRT had significantly reduced the SUVmax levels
[image:65.595.126.469.358.662.2]of the nodes in this group.
Figure: 26 Comparison of pre and post RT PET SUVmax in DS 3
4.34 3.08 5.33 21.45 2.7 14.68 4.45 6.74 8.3
3.65 3.3 3.41
2.47 2.42 2.51 2.75 3.06
3.42 0 5 10 15 20 25
Pt 1 Pt 2 Pt 3 Pt 4 Pt 5 Pt 6 Pt 7 Pt 8 Pt 9
Comparison of pre and post RT PET
SUVmax in DS 3
66 Of the 4 patients in the DS 4-5 group, SUVmax levels of the most active neck node in
pre-RT PET scans were ranging from 6.69-28.26 (median SUVmax 18.23) and as
compared to SUVmax levels measured in their respective post-RT PET scans were
ranging from 5.63-15.27 (median SUVmax 10.13) and all of them had disease
progression. The number of patients was too small to allow a reliable calculation for
[image:66.595.127.469.270.565.2]p-value for comparing the effect of RT on pre and post-RT SUVmax levels.
Figure: 27 Comparison of pre and post RT PET SUVmax in DS 4-5
D.
Follow-up
The median follow-up time from the date of completion of RT was 12 months (range
4–53 months) and two patients died within the period of the study, one of them was
due to recurrent cholecystitis and the other due to disease progression. Of the 45
patients, seven were found to have disease progression during the follow-up period
from the date of the scan to the last patient encounter at our institution. Of these, 28.26 9.68 6.69 26.78 12.42 5.63 7.85 15.27 0 5 10 15 20 25 30
Pt 1 (DS 4) Pt 2 (DS 4) Pt 3 (DS 5) Pt 4 (DS 5)
Comparison of pre and post RT PET
SUVmax in DS 4-5
67 progression was confirmed in 5 (71.4%) patients by tissue diagnosis and 2 (38.6%)
patients by imaging and clinical follow-up. They were all in DS 3-5 groups.
There was no disease progression in DS 1-2 groups.
It was found that 38/41 patients with DS 1-3 had no nodal recurrence showing a high
NPV of 93%. Of the 4 patients with DS 4-5 all had active disease showing PPV of
100%.
Applying Fisher’s exact test, the p-value was found to be 0.004. This highlighted that
DS 2-3 was useful in predicting absence of nodal recurrence and DS 4-5 in predicting
disease progression.
DS 2 DS 3 DS 4-5
Total
No nodal
recurrence
10
6
0
16
Disease
progression
0
3
4
7
[image:67.595.149.447.341.478.2]Total
10
9
4
23
68
69 As there are 680,000 new HNSCC cases in the world per year it was imperative that
there was development of functional imaging like F-18 FDG PET-CT and it was also
endorsed by the current NCCN guidelines for diagnosis and staging. This was because
18F-FDG PET-CT can identify an occult primary tumour and is very accurate in
detecting metastases or second primary tumours elsewhere in the body, and precise
delineation of target volumes is critical for IMRT treatments.
The response of HNSCC to treatment depends on various factors such as clinical
history (previous treatments), tumour characteristics (stage and biology), surrounding
microenvironment and host immunoresponse.
It has been well-known that 18F-FDG PET-CT is a powerful predictor in the
assessment of the response after CRT or RT alone. The pre-eminence of functional
over conventional imaging in response evaluation consists of its ability to
semiquantitatively assess glucose uptake as a cancer cell viability indicator.
Early identification of poor responders or nonresponders may allow modification of
the treatment plan (volume and doses) and/or implementation of alternative
therapeutic strategies to intensify treatment. Therefore, utilising a Likert scale such as
DS which could categorise the responders from non–responders, would prevent
unnecessary prophylactic neck dissections.
In this study there was a good concordance between the DS and SUVmax. All
methods of assessment predicted RC with high significance and almost similar to each
other. The D also showed encouraging results in discriminating responders from
nonresponders on PET scans judged as equivocal. SUVmax is an estimation of tumour
70 (29). It is a single-voxel value unfavourably affected by noise (31) and need not
necessarily reflect the metabolic activity of the tumour as a whole. There was
significant difference in SUVmax between patients with and without
residual/recurrent tumour after completion of RT in DS 2-3 groups only.
Nevertheless, measurement of SUVmax is affected by technical, biological and
physical factors (30), and in spite of an attempt to establish common criteria there are
still many diverse ways of calculating and presenting SUVmax. Published cut-off
values are usually specific to the method and to the institution (29). In this study, as
also shown previously, SUVmax did not give any additional value when compared
with visual inspe