INJURY AND REGENERATION OF COMMON REEF-CREST CORALS AT LIZARD ISLAND, GREAT BARRIER REEF, AUSTRALIA
Thesis submitted by Vicki R. Hall
June 1998
THESIS DEDICATION
This thesis is dedicated to the loving memory of my father and grandfather. To my father, thank-you for always believing in my academic abilities and for encouraging me to further my education, I hope I have made you proud. To my grandfather, my sincere thanks for the financial support that has enabled me to
ABSTRACT:
Corals are frequently injured by natural processes and human activities. The response of scleractinian corals to damage is dependent on the nature and extent of damage, the characteristics of the injury, the life-histories of the coral, and the prevailing abiotic and biotic conditions. In this thesis I have examined several aspects of injury including (1) the nature and extent of natural injury, (2) the response of corals to injuries with
different characteristics and (3) the influence of morphology and life-history in response to damage.
The spatial and temporal patterns of coral injury were recorded to determine the nature and extent of damage in common reef-crest corals at Lizard Island. The total amount of partial mortality on reef-crest corals was low (<2%) although there was a three-fold difference among sites. Sites with low partial mortality had reef-crest assemblages dominated (both numerically and in cover) by tabular and bushy corals. These corals have low levels of partial mortality, and on average, fewer small colonies with injuries. Conversely, the site where the partial mortality was three times higher had a lower abundance and cover of tabular corals, and an increase in the number and cover of massive and digitate corals. Massive and digitate corals, on average, have a higher amount of partial mortality and more small colonies with injuries.
suggesting a fast turn-over of injuries. Under catastrophic conditions, there were many more pre-existing injuries, a high number of new injuries, and more injuries increasing in size than recovering, resulting in an accumulation of injuries.
The regeneration of injuries was influenced by the characteristics of the injury including initial size, type, and position within the colony The complete regeneration of an injury was more probable for small injuries (0 - 4 cm2) than larger injuries. However,
recovery rates were also dependent on the type of injury as scraping injuries had a much faster regeneration rate than tissue mortality or breakage. Additionally, recovery was influenced by the position of injuries within colonies for one species Porites mayeri where the rate of regeneration of central injuries was greater than edge injuries. Conversely, the recovery of central and edge injuries was similar for A. robusta, A. hyacinthus, A. palifera, Pocillopora damicornis, and Porites lichen. Variations in levels of partial mortality, zones of tissue from which regeneration can take place, degrees of settlement by other organisms, intensities of damage, and amounts of resources available for regeneration all contributed to the differences in recovery rates found between injuries with varying characteristics.
The regeneration of injuries requires resources that are in limited supply. In this study, there was a marked effect of injury on reproduction for A. hyacinthus, A. gemmifera and G. retiformis, inferring a trade-off between reproduction and regeneration. Presumably the resources usually available for gamete production are being reallocated towards polyp regrowth and defence against fouling organisms. In contrast, injury had no effect on the survival or growth of colonies over nine months for the three species. This result suggests that future reproduction is being preserved through the iteration of new polyps but at the expense of current reproduction. It also suggests that these species are resistant to damage since their survival was unaltered by damage in the short-term.
retiformis and A. gemmifera, seemed to invest more resources towards defence than the shorter-lived A. hyacinthus since the number of new injuries present on colonies was higher for the latter species. Conversely, the shorter-lived coral invested more in tolerance strategies by responding to infrequent damage events or minimal tissue losses with rapid regrowth. The cost of such a strategy is that shorter-lived species are more vulnerable to repetitive injury.
Experimental studies showed that branching species had more regrowth potential than massive and semi-massive species supporting the hypothesis by Jackson (1979) that morphology plays a role in the pattern of investment in regeneration and defence. The morphology of a coral influences its longevity, reproductive output, growth rate, and other life-history processes including regeneration. Consequently, the morphological strategy of an organism has evolved over time in response to a large number of biotic and abiotic processes including partial mortality.
STATEMENT OF ACCESS
I, the undersigned author of this work, understand that James Cook University will make this thesis available for use within the University Library and, via the Australian Digital Theses network, for use elsewhere.
I understand that, as an unpublished work, a thesis has significant protection under the Copyright Act and;
I do not wish to place any further restriction on access to this work
Or
I wish this work to be embargoed until
Or
I wish the following restrictions to be placed on this work:
ELECTRONIC COPY
I, the undersigned, the author of this work, declare that the electronic copy of this thesis provided to the James Cook University Library, is an accurate copy of the print thesis submitted, within the limits of the technology available.
_______________________________ _______________
DECLARATION
ACKNOWLEDGMENTS
Many people have contributed in a variety of ways to this thesis, and to all of you I would like to extend my heart-felt gratitude. Firstly, I would like to thank my closest friends, Jackie, Gilianne, Margaret, Kerri, Judy, Natalie and Alison for their
encouragement and support throughout my studies at James Cook University. I would also like to thank Jessie, Ilona, Di, Bronwen, Faye, Lyn, Ian, Dave, Rob, Simon and Kerry for providing me with an endless stream of laugher-filled lunches.
My supervisor, Terry Hughes has provided me with a great deal of editorial support and has taught me an enormous amount about the intricacies of writing scientific papers, presenting seminars, and reviewing manuscripts. He has also assisted in the application of external funding for this PhD and covered the costs of my initial field trips. The use of underwater cameras, some diving gear, and laboratory equipment (e.g.
slide-projectors, digitiser, computers and laser printer) were all provided by Terry. I am most grateful for his considerable input towards my PhD.
Jason Tanner has acted as an unofficial supervisor throughout my PhD and has
generously given up his time to review many earlier drafts of my data chapters. Chris Alexander and the Coral Reef Discussion Group have also offered comments on some data chapters. Jason Tanner, Chris Alexander and Howard Choat have all been very supportive and encouraging throughout my PhD.
There was quite a large laboratory component to this study which was made possible by the assistance of several people. Zollie Florian offered help with microscopy, Francis Pantus very kindly allowed me the use of his image analysis program, Image-it, Gordon Bailey and Vince Pullella provided computer support, Larnie Linton and Jo Sadler helped with coral polyp dissections, Rachael Groves and Leigh Winsor assisted with histology, Jackie Wolstenholme offered her expertise in coral taxonomy, and Bette Willis supplied laboratory space and some technical equipment as did the School of Earth Sciences.
The statistical analysis of my data was very challenging. I would like to thank Natalie Moltschaniwskyj, Jason Tanner and particularly Glen De’ath for providing me with statistical advice. Additionally, discussions about damage in coral with many colleagues has been very rewarding. I would like to thank Buki Rinkevich, Joe Connell, Uri Oren, Esther Kramarsky-Winter, Erik Meesters, Robyn Cumming, Paul Marshall, Vicki Nelson, Tony Rauphael, Vicki Harriett and Katharina Fabricius for their stimulating conversations about coral damage. Kerry Neil and Rowan Pratt took the time to read the final draft of my thesis, for this special effort I am most
appreciative.
This project would not have been possible without funding. I would like to thank the following granting bodies for their financial support: Lizard Island Research Station Fellowship (Australian Museum), Australian Federation of University Women, Australian Coral Reef Society, CRC Reef, Department of Marine Biology, and the Great Barrier Reef Marine Park Authority.
An initial investigation into the biochemical and histological aspects of this project was carried out. I would like to thank David Yellowlees, Bill Folley and Brett Moloney for their assistance with the biochemistry and Buki Rinkevich for providing a very detailed description of the histology of regenerative processes in corals. Your help was most appreciated and I hope to continue this work in the future.
TABLE OF CONTENTS Page
Title Page ……….…………... i
Thesis Dedication ………. ii
Abstract ……….. iii
Statement of Access ……….. vi
Declaration ……….….. vii
Acknowledgments ………..………. viii
Table of Contents ……….………...… x
List of Tables ……….……….….. xiv
List of Figures ……….………. xvii Chapter 1 General Introduction ……… 1
1.1. Introduction ……….…... 1
1.1.1. Nature and extent of damage ………..…..………... 2
1.1.2. Characteristics of injuries ………..……… 2
1.1.3. Life-histories of corals ……… 3
1.1.4. Pre-existing biotic and abiotic conditions ………. 3
1.2. General Aims and Significance ……… 4
Chapter 2 The nature and extent of natural injury on reef-crest corals at Lizard Island ………. 6
2.1. Abstract ………..……..… 6
2.2. Introduction ……….……….... 8
2.3. Materials and Methods ………..………..……….... 9
2.3.1. Description of study sites …….……….………... 10
2.3.2. Spatial patterns of injury ……….………... 10
2.3.2.1. Patterns of tissue loss among sites ……….………. 12
2.3.2.3. Coral community composition and size-
structure within sites ……… 13
2.3.3. Temporal patterns of injury ………. 13
2.3.3.1. The fate of injuries ……….... 14
2.3.3.2. The addition of new injuries ………. 15
2.4. Results ………..…….. 16
2.4.1. General summary of results ……….…….... 16
2.4.2. Spatial patterns of injury ……….. 16
2.4.2.1. Patterns of tissue loss between sites ……....………. 16
2.4.2.2. The effect of morphology and colony size on injury patterns at the four sites ……… 18
2.4.2.3. Coral community composition and size- structure among sites ……….…… 20
2.4.3. Temporal patterns of injury ……….………….... 24
2.4.3.1. Initial status of injuries ……….….... 24
2.4.3.2. Fate of injuries ………..… 27
2.4.3.3. New injuries ……….…….… 29
2.4.3.4. Frequency of injury ……….………. 33
2.5. Discussion ……….. 34
2.5.1. Spatial patterns of injury ……….……… 34
2.5.2. Temporal patterns of injury ……….… 36
Chapter 3 Interspecific differences in the regeneration of artificial injuries on scleractinian corals. ………. 41
3.1. Abstract ……….………….…. 41
3.2. Introduction ……… 42
3.3. Materials and Methods ……….……….. 46
3.3.1. Experiment 1 (Interspecific differences in recovery and injury position within colonies ) ………..……… 47
3.3.2. Experiment 2 (Interspecific differences in recovery and injury types) ………..… 48
3.3.2.2. Tissue loss versus branch removal ………….…….. 50
3.3.3. Statistical analysis ……….….. 50
3.4. Results ……….... 51
3.4.1. Experiment 1 (Interspecific differences in recovery and injury position within colonies) ………. 51
3.4.2. Experiment 2 (Interspecific differences in recovery and injury types) ………..……… 53
3.5. Discussion ……….……….. 56
3.5.1. Interspecific differences in regeneration ………….…………. 56 3.5.2. Injury characteristics ……… 58 Chapter 4 The response of Acropora hyacinthus and Montipora tuberculosa to scraping injuries, tissue mortality and breakage ….…… 61
4.1. Abstract ………..… 61
4.2. Introduction ……… 62
4.3. Materials and Methods ………... 65
4.3.1. Amount of regeneration ……….….. 66
4.3.2. Amount of algal settlement ……….…. 66
4.3.3. Zone of tissue available for regeneration ………. 68 4.3.4. Analysis of data ………..…. 68
4.4. Results ……….... 69
4.4.1. Amount of regeneration ……….….. 69
4.4.2. Amount of algal settlement ……….. 70
4.4.3. Zone of tissue available for regeneration ………. 73 4.5. Discussion ………... 75
5.1. Abstract ……….….. 79
5.2. Introduction ……… 81
5.3. Materials and Methods ………..… 83
5.3.1. Response to injury: experimental design ………. 83
5.3.2. Effects of injury on colony growth, regeneration and survival ……….…. 85
5.3.3. Effects of injury on reproduction ………. 86
5.3.4. The loss of reproductive output as a result of injury ………… 87
5.4. Results ……….... 88
5.4.1. Response to injury by scleractinian corals ………... 88 5.4.2. The effect of injury on colony growth, regeneration and survival ……….……….. 88
5.4.3. The effect of injury on reproduction ………..…….…. 89
5.4.3.1. Colony-wide effect of injury on reproduction …….. 89
5.4.3.2. Localised effects of injury on reproduction …….…. 91
5.4.4. Loss of reproductive output associated with injury …………. 95
5.5. Discussion ………... 98
5.5.1. Response to injury ………..……. 98
5.5.2. Strategies of resistance ……… 99
5.5.3. Trade-offs between growth, reproduction and survival ……. 100
Chapter 6 General Discussion ……… 104
LIST OF TABLES Page
Table 2.1. The number of small and large injuries present at South Island,
Lizard Head, Washing Machine and North Reef, Lizard Island ………….. 17 Table 2.2. The distribution of colonies within injury categories amongst sites for
morphological groups and colony size ………. 19 Table 2.3. The results of the logistic regression analyses assessing the effects
of site, morphology, and colony size on (1) uninjured and injured
colonies and (2) injured colonies with < 5% and > 5% partial mortality …. 20 Table 2.4. The percentage of uninjured colonies among morphological
groups and colony sizes and the percentage of colonies with low and
high amounts of partial mortality for morphological groups ………. 21 Table 2.5. A summary of the analysis of variance (ANOVA) results testing for
differences in mean number of colonies per transect and (b) mean percent cover between sites and morphological groups ……….…….... 22 Table 2.6. The results of logistic regression analysis assessing the effects of
morphological group and sites on the distribution of small and
large colonies ……….... 24 Table 2.7. The number of injuries that regenerated, shrank, stayed the same,
or grew over 12 months, cross-classified by initial state, species and
census interval ………..…… 30 Table 2.8. A repeated measures ANOVA testing the effect of species and colony
size on the number of new injuries per colony over time for the two
consecutive censuses ………. 31 Table 2.9. The number of censuses in which colonies sustained injuries
recorded over 3 - 4 monthly intervals from 1994 - 1995 and 1995 - 1996 for small and large colonies of G. retiformis,
A. hyacinthus and A. gemmifera ……… 33 Table 3.1. A list of studies showing the places and scleractinian corals for which
Table 3.3. An ANOVA table for the comparison of the amount of regeneration between species and injury position for experiment 1
at North Reef, Lizard Island ……….…………. 52 Table 3.4. (a) Linear extension of new growth for the two injury types (tissue
removal and branch removal) inflicted on A. millepora and
A. gemmifera in experiment 2b. (b) Injury size and regeneration for the two injury types inflicted on A. millepora and A. gemmifera in
experiment 2b ………..………….. 55 Table 4.1. A summary of the repeated measures ANOVA testing for differences
in regeneration between species and injury types, and how these patterns
change between censuses ………... 71 Table 4.2. A summary of the repeated measures ANOVA testing for differences
in the amount of algal colonisation between species and injury types,
and how these patterns change over time …………..………..…….. 73 Table 4.3. The zone of tissue available for regeneration to original injury area
for each injury type and species, and the results of the t-test analysing differences between species in the amount of tissue available for
regeneration for each injury type ………...…… 74 Table 4.4. A summary of the repeated measures analysis of covariance
(ANCOVA) testing for differences in regeneration between
species for breakage injuries and how these patterns change between census after the effect of tissue area available for regeneration
has been adjusted for. ……….……….…..… 75 Table 5.1. A summary of ANCOVA results testing the effects of injury size and
frequency of damage on colony growth (cm2) and regeneration (cm2)
for each species ……….. 92 Table 5.2. A summary of ANOVA results testing colony-wide effects of injury
size and frequency of damage on egg volume per polyp (mm3) and
polyp fecundity for the three species ………...….. 93 Table 5.3. A summary of ANOVA results testing the effects of injury (size
polyp fecundity for the three species ……….... 94 Table 5.4. The mean egg number per polyp and mean egg size for samples
collected close to and away from the injury site for colonies of
LIST OF FIGURES Page
Figure 2.1. A map of Lizard Island showing the location of study sites ……….… 11 Figure 2.2. The mean partial mortality per transect for the four study
sites around Lizard Island ……….……….… 17 Figure 2.3. The number of colonies per transect among morphological
groups at each site around Lizard Island ……….. 23 Figure 2.4. The coral cover per transect of morphological groups at each
site around Lizard Island ………..……… 23 Figure 2.5. The distribution of small and large colonies among
morphological groups and sites at Lizard Island ……….. 24 Figure 2.6. The number of small and large injuries on colonies of
G. retiformis, A. gemmifera and A. hyacinthus in February 1994
and February 1995 ………..….. 25 Figure 2.7. The range and average numbers of injuries per colony present
on large and small colonies of G. retiformis, A. gemmifera and
A. hyacinthus at the start of each census ………..….. 26 Figure 2.8. The distribution of injuries between small and large colonies
in February 1994 and February 1995 ……….……… 27 Figure 2.9. A classification tree showing the relationship between fate
and initial state, species and census ……….…….. 28 Figure 2.10. The mean number of new injuries per colony over time for
large and small colonies of G. retiformis, A. gemmifera and A. hyacinthus . 32 Figure 3.1. A photographic series showing the recovery of the tissue and
scraping injuries inflicted on Porites over time ………. 49 Figure 3.2. The amount of regeneration of a central and edge injury for
several common reef-crest species over 71 days ………..………… 52 Figure 3.3. The percentage of injury regeneration over time for P. australiensis
and M. tuberculosa showing the size of the injury and the zone of
tissue available for regeneration ………..………. 67 Figure 4.2. The mean regeneration of injuries for injury type and species
after 12 and 24 days ………..… 70 Figure 4.3. The mean algal settlement for injury type and species after
12 and 24 days ………..…. 72 Figure 4.4. A scatter plot of the relationship between the amount of
regeneration (cm2) and the amount of algal settlement (cm2)
over 12 and 24 days ………..… 72 Figure 5.1. An outline of the injury regimes inflicted on the three species ……….
84 Figure 5.2. (a) Final colony size (cm2) adjusted for initial colony size by
ANCOVA showing the effects of injury size and frequency of damage on absolute colony growth for each species. The amount of
regeneration (cm2) over nine months, adjusted for initial injury size
by ANCOVA, for each injury treatment by species ……….. 90 Figure 5.3. The proportion of polyps with mature gonads averaged over
colonies for injury treatments and position effects within colonies
for the three species ………..…… 96 Figure 5.4. The average egg volume per polyp (mm3) for injury treatments
CHAPTER 1: GENERAL INTRODUCTION
1.1 INTRODUCTION
Coral reefs are one of the most diverse and complex ecosystems in the world and provide important resources for a large number of taxa, including humans (Hatcher et al. 1989). The increasing level of human exploitation of these resources in the past two decades has resulted in the degradation of many reefal ecosystems (Colloquium and forum on global aspects of coral reefs, Miami 1993). Unfortunately, while the impact of humans on reefs has been well documented, our understanding of the mechanisms of effect, and their consequences has been much less substantial (Hatcher et al. 1989). With the exception of a few notable studies, mainly in the Caribbean and the Red Sea, this lack of understanding of mechanisms and their specific consequences is particularly true for studies of damage in scleractinian corals. Monitoring programs assessing the status of coral reefs have focused on the loss of species diversity and coral cover without any in-depth knowledge of species-specific sensitivities to damage, or the complex processes influencing recovery. The general objective of this thesis is to further our knowledge of the processes associated with injury and regeneration for scleractinian corals.
Scleractinian corals are modular organisms that grow by the iterations of polyps and shrink through the loss of polyps (e.g. Hughes and Jackson 1985; Babcock 1991). The loss of polyps through damage from an individual colony resulting in a dead patch is known as partial mortality. Partial mortality in corals is caused by both natural
processes such as predation, competition, disease, and physical disturbances, as well as anthropogenic activities including diving, fishing, boating, mining and coastal
development (e.g. reviews by Connell 1973; Brown and Howard 1985; Craik et al. 1990; Grigg and Dollar 1990). The ability of corals to recover from damage (regeneration) is dependent on the nature and extent of damage, the resulting
1.1.1. NATURE AND EXTENT OF DAMAGE
The nature and extent of damage to corals is highly variable (Bythell et al. 1993; Meesters et al. 1996, 1997a). This variability results from the unpredictable nature of the large number of agents that can cause damage in corals, as well as the varying susceptibilities of corals to injury. For example, the agents of coral damage are often patchy in nature and operate to different extents, both within and between different habitats and depths (e.g. Drupella, Cumming 1996; Tropical storms, Bythell et al. 1993). Vulnerability to damage is often associated with morphology since the shape of a coral significantly influences the type of interaction that it will have with the
surrounding environment (Jackson 1979). Differences in physical defenses (e.g. skeletal density of branches and polyps, nematocyst densities and spiky protrusions) among morphologically similar species may also change their vulnerability to damage (Bythell et al. 1993; Meesters et al. 1996, 1997a).
1.1.2. CHARACTERISTICS OF INJURIES
In corals, the ability to recover from damage is partially determined by the
1.1.3. LIFE-HISTORIES OF CORALS
The life-history traits peculiar to a particular coral species have evolved over time in response to a large number of biotic and abiotic processes including partial mortality. The ability of corals to resist damage has occurred through the evolution of defenses such as hard skeletons, a protective mucous coating, and nematocysts. However, due to the unpredictable nature of the numerous agents that can cause damage in corals, investment in a whole suite of defenses covering all possible scenarios would be too costly. Consequently, corals have also evolved the ability to regenerate polyps lost as a result of damage. Investment in defenses to protect against damage or the regeneration of lost parts once damage has occurred requires resources. If these resources are in finite supply, then a trade-off must occur in the allocation of resources between defence, regeneration and the other life-history traits (Stearns 1991). Trade-offs between
regeneration and other life history traits have been demonstrated experimentally for several coral species (e.g. growth, Loya 1976; Bak 1983; Meesters et al. 1994; reproduction, Rinkevich and Loya 1989; Van Veghel and Bak 1994).
1.1.4. PREVAILING BIOTIC AND ABIOTIC CONDITIONS.
1.2. GENERAL AIMS AND SIGNIFICANCE
Evidently, the underlying processes associated with the regeneration of injuries in scleractinian corals is complex and related to the nature and extent of injury, the characteristics of the injury, the life-histories of corals, and the prevailing biotic and abiotic conditions. Studies examining these processes have been conducted
predominantly on common species of corals from the Caribbean and the Red Sea, with very few studies of this nature having been carried out on the speciose fauna of the Great Barrier Reef, Australia. Consequently, the major aim of this study is to broaden and extend our knowledge of the processes of injury and regeneration of scleractinian corals, with a particular emphasis on common reef-crest species from the Great Barrier Reef, Australia. Several aspects of injury have been examined in this thesis including (1) the nature and extent of natural injury, (2) the response of corals to injuries with different characteristics and (3) comparisons of morphological and life-history
strategies of corals that enable them to respond to potential damage in different ways.
The spatial and temporal patterns of coral injury will be investigated in Chapter 2 to determine the nature and extent of natural injury on reef-crest corals at Lizard Island. Studies of the spatial patterns of coral injuries provide a snapshot of the dynamics of partial mortality, and allow inferences to be made about the relative vulnerabilities of corals to damage as a function of colony size, morphology and location. Temporal studies of coral injury, on the other hand, examine rates of injury and recovery, and provide an insight into the effects of differing injury regimes on the population dynamics of corals.
Morphological theory predicts that sessile, marine animals that are strongly committed to their place of settlement will invest more resources towards defence and maintenance than more fugitive species (Jackson 1979). In Chapter 3, I will examine differences in the responses of eleven species of corals with varying morphologies to injury to
Recovery of different types of injury appears to be linked with the amount of tissue and skeleton that must be replaced, as well as the ability of the coral to out compete
organisms that have settled onto the injured area. In Chapter 4, I will examine if (1) the amount of colonisation of the injured site by algae, (2) the area of tissue from which regeneration can occur, and (3) regeneration rates, vary among colonies with tissue mortality, scraping or breakage injuries for two common reef-crest corals, Acropora hyacinthus and Montipora tuberculosa.
Life-history theory predicts that organisms with indeterminate growth will balance resource allocation between somatic longevity and reproductio (Kirkwood 1981). In Chapter 5, I investigate the effects of injury on colony growth, reproduction and survival for Acropora hyacinthus, A. gemmifera and G. retiformis to determine if there are any trade-offs between regeneration and the other life-history traits. Two factors, injury size and frequency of damage will be varied to test the hypothesis that the impact of an injury will depend on the size and frequency of damage: the larger and more frequent the injury, the greater the impact.
In conclusion, by examining the following three aspects of injury and regeneration: (1) the nature and extent of natural injury (2) the response of corals to injuries with
different characteristics and (3) the influence of morphology and life-history on response to damage, for common reef-crest corals of the Indo-Pacific, a better
CHAPTER 2: THE NATURE AND EXTENT OF NATURAL INJURY ON REEF-CREST CORALS AT LIZARD ISLAND
2.1. ABSTRACT
The spatial and temporal patterns of injury on reef-crest corals around Lizard Island were recorded to determine the nature and extent of damage in common reef-crest corals at Lizard Island. The total amount of partial mortality (proportion of coral cover that is dead) on reef-crest corals was low (< 2%) although there was a three-fold
difference among sites. Reef-crest assemblages with low levels of partial mortality were dominated (both numerically and in cover) by tabular and bushy corals. These corals had low amounts of partial mortality and on average fewer small colonies with injuries. In contrast, the reef-crest assemblage were the partial mortality was three times higher had a lower abundance and percent cover of tabular corals and an increase in the number and cover of massive and digitate corals. Massive and digitate corals, on average, had a higher amount of partial mortality and more small colonies with injuries.
The pattern of injury over time (net effect of initial injury status, fate of injuries over 12 months and the addition of new injuries) for Goniastrea retiformis, Acropora
gemmifera and A. hyacinthus was dependent on species, colony size, initial injury size and census year. Goniastrea retiformis had a high number of pre-existing injuries, slow regeneration rates, and few new injuries, suggesting that injuries tended to accumulate on colonies over time. The addition of new injuries was also low for Acropora
The number of injuries initially present on colonies, and the addition of new injuries was influenced by colony size. This effect was most pronounced for A. hyacinthus
since there was at least an order of magnitude difference in the size of small and large colonies. For all species, small colonies had fewer pre-existing injuries, and for A. hyacinthus colonies in both censuses, the frequency of injury was higher for large colonies. In contrast, the fate of a pre-existing injury was independent of colony size since most injuries did not change their status over 12 months in either census year, and only a relatively small proportion (< 10%) regenerated, shrank, or grew in size.
2.2 INTRODUCTION
Corals are modular organisms that grow by the iteration of polyps and shrink through the loss of polyps (e.g. Hughes and Jackson 1985; Babcock 1991). Loss of polyps from an individual colony through damage is known as partial mortality. Partial mortality in corals is caused by abiotic and biotic disturbances such as predation, competition, disease, physical disturbances and anthropogenic activities including diving, fishing, boating, mining and coastal development (e.g. reviews by Connell 1973; Brown and Howard 1985; Craik et al. 1990; Grigg and Dollar 1990; Brown 1997). Mortality in scleractinian corals has often been quantified in terms of loss of coral cover (review by Connell 1996). However, few studies have focused on partial mortality in individual colonies (but see Hughes and Jackson 1980, 1985; Done 1987; Babcock 1991; Bythell
et al. 1993; Meesters et al. 1996, 1997a; Ruesink 1997) despite the fact that losses of living tissue through partial mortality often can have far greater demographic
consequences (in terms of reproduction and survival) for coral populations than whole colony mortality. Studies on the spatial and temporal patterns of natural injury are fundamental to an understanding of the processes that structure coral reef communities (e.g. disturbance, competition and predation).
Recent studies of partial mortality have shown that injury patterns differ among colonies of different sizes and shapes, between habitats or depth zones, and among species with similar morphologies (Bythell et al. 1993; Meesters et al. 1996, 1997a). The presence of an injury on a colony at a particular time is a function of how
are often patchy in nature and operate to different extents in different habitats and depths (Cumming 1996; Bythell et al. 1993; Meesters et al. 1997a). Vulnerability to damage is often associated with morphology since the shape of a coral significantly influences the type of interactions that it will have with the surrounding environment. Corals closely associated with the bottom (e.g. encrusting species) are greatly affected by benthic interactions while more upright species (e.g. tabular and branching species) are likely to be subjected to biological and physical interactions within the water column (Jackson 1979). Given an equal chance of injury, the amount of damage recorded on different species at a particular time is also variable (Bythell et al. 1993; Meesters et al. 1996) due to differences in physical defenses (e.g. skeletal density of branches and polyps, nematocyst densities, spiky protrusions) and regeneration
capabilities (Loya 1976; Bak 1979; Bak and Steward-Van Es 1980; Bak 1983; Bythell
et al. 1993; Meesters et al. 1996, 1997a).
The general aim of this chapter is to quantify the nature and extent of natural injury in corals to determine their importance in structuring coral communities. Specifically, I will examine (1) the spatial pattern of injury in terms of partial mortality for reef-crest coral communities at four sites, (2) the distribution of uninjured and injured colonies and high and low levels of partial mortality on corals as a function of colony
morphology and colony size, (3) the influence of coral composition and size-structure on spatial patterns of injury, and (4) the temporal patterns of injury over two years.
2.3. MATERIALS AND METHODS
2.3.1. Description of study sites
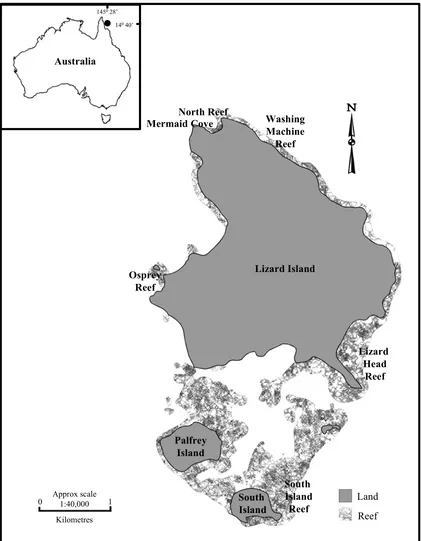
This study was conducted on the fringing reefs around Lizard Island (14040’, 145028’), a continental island of the Great Barrier Reef, approximately 25 km off the eastern coast of mainland Australia. The Lizard Island complex consists of Lizard Island and three smaller islands, Palfrey, South, and Bird Islets, all of which are connected by reefs (Pichon and Morrissey 1981). These islands are protected from oceanic swells by the outer barrier reef. The study sites were South Reef, Lizard Head, Washing Machine, North Reef, and Mermaid Cove (Figure 2.1). South Reef and Washing Machine are exposed sites subjected to the dominant southeast trade winds. In contrast, Mermaid Cove, North Reef and Washing Machine are relatively protected sites, sheltered from the southeast trade winds by Lizard Island. The section of reef that was examined at all sites was the reef crest. The reef crest is defined as the narrow strip of reef between the reef flat and reef slope (Pichon and Morrissey 1981).
2.3.2. Spatial patterns of injury
To determine the extent of natural injury to reef-crest corals at Lizard Island I recorded the amount of injury present at four sites in February 1994: South Island, Lizard Head, Washing Machine and North Reef (Figure 2.1). The number of injuries per colony, injury size, and colony size were measured, and individual colonies were categorised into five morphological groups for scleractinian corals along ten, 5 metre line transects at each site. The position of the initial line transect at each site was haphazardly chosen and each transect thereafter was separated by 5 meters. The five morphological groups were bushy corals (Pocilloporid and Acroporid colonies), massive corals (Poritids, Faviids and Mussids), tabular Acroporids, digitate Acroporids, and others (consisting mainly of Isoporans and Montiporids).
Figure 2.1. A map of Lizard Island showing the location of study sites.
Reef Land
0 Approx scale1:40,000 1
Kilometres
South Island Palfrey
Island
Lizard Island
South Island Reef Osprey
Reef
Lizard Head
Reef Mermaid Cove
North Reef
Washing Machine
Reef
140 40’
1450 28’
Injuries less than 1cm2 were counted but not accurately measured. The projected area of an injury was estimated by multiplying the length and breadth together since the shape of most injuries resembled that of a rectangle. In contrast, most colonies are elliptical in shape so the formula for calculating the area of an ellipse was used to estimate colony size.
2.3.2.1. Patterns of tissue loss among sites
The amount of injury at a particular site is a function of the amount and frequency of damage occurring as well as how fast an injury is regenerated. A measure of rates of injury and recovery is provided by partial mortality which is the proportion of total coral cover that is dead. To investigate whether the pattern of injury and recovery differed among sites, the amount of partial mortality per transect was quantified for each of the four reef-crest sites around Lizard Island. Differences between sites were tested with an analysis of variance (ANOVA). The data were arcsin square-root
transformed to meet the assumptions of the ANOVA. An a posteriori Tukey’s test was used to distinguish significant differences between sites.
2.3.2.2. The effect of morphology and colony size on injury patterns
2.3.2.3. Coral community composition and size-structure within sites
The size-structure and composition of a given coral community influences community level injury patterns since vulnerability to damage is size-specific and related to morphology. The coral communities at the four sites are described in terms of numerical abundance and percent cover of the five morphological groups. Percent cover is estimated by summing the intercept of each group along each transect and dividing this number by the total length of the transect. An ANOVA was used to test for differences between sites in mean percent cover and number of colonies per transect. The data was log- transformed to meet the assumptions of ANOVA. The size-structure of the morphological groups was examined in relative terms, that is, the proportion of small and large colonies among morphological groups and sites. Differences in the distribution of colonies among these groups were tested with a logistic regression analysis (as described previously).
2.3.3. Temporal patterns of injury
To determine natural rates of injury and regeneration for large and small reef-crest corals I recorded the number of new injuries, and followed the fate of old injuries on individual colonies belonging to three species and two size-classes every 3-4 months for 2 years at Mermaid Cove, Lizard Island (Figure 2.1). The survey commenced in
February 1994 and ended with a final census in February 1996. A total of 8 censuses were conducted over this period.
colony were used to mark individual corals and facilitate their relocation during subsequent censuses. A total of 90 colonies were tagged, 15 colonies per species and size-class. Due to tag losses and a few colony deaths after one year of monitoring (February 1994 - 1995), a new set of colonies were tagged and monitored in the second year (February 1995 - 1996). The final number of colonies per species and size-class ranged from 8 - 11.
The addition of new injuries, and the fate of old injuries were observed by comparing photographic images of the tagged colonies from consecutive censuses. The colonies were photographed with a Nikonos V underwater camera. Colonies of Acropora hyacinthus and A. gemmifera were photographed from above at a height of
approximately 3 meters. A tile of known area was placed in each photograph and used as a size calibration. The horizontal plane of large colonies of A. hyacinthus and A. gemmifera is an appropriate way to monitor the incident of injury because their growth form is relatively two-dimensional. In contrast, G. retiformis has a more
three-dimensional shape and thus required a rather different sampling protocol. Goniastrea retiformis colonies were divided up into quarters by placing two small chains at right angles over the colony. Each quarter and the horizontal plane were photographed, usually from a distance of 1m. The size standard for each of these photographs was a reference tile of known area. Small colonies were photographed with a 35 mm close-up lens, with a ruler attached to the close-up frame providing a scale.
2.3.3.1. The fate of injuries
Using the photographs taken at the beginning of February 1994 and February 1995, I individually labelled and then classified into two size-classes (small, < 1cm2 and large, >1 cm2) each injury present on tagged colonies. This classification will be referred to as initial injury size from herein while injuries present on colonies at the beginning of each census will be referred to as pre-existing injuries. I subsequently traced the fate of these pre-existing injuries by following their transitions between size-classes from
increased in size either migrated to the larger class or stayed in the larger size-class.
Differences in the distribution of injuries among injury size, years, species and colony size were determined using a log-linear analysis. Colonies were nested within yearly censuses to maintain temporal independence, an assumption of the analysis. F-tests were used to compute probabilities because the data were over dispersed (Collett 1991; De’ath and Moran 1998). A tree-based model was used to explore the relationship between the fate of injuries and census intervals, species, initial injury size and colony size (Clark and Pregibon 1997). These models split the data set into increasingly homogeneous subsets resulting in the production of a classification tree.
2.3.3.2. The addition of new injuries
For each yearly period, the number of new injuries present on the photographed colonies each 3 - 4 months was recorded for small and large colonies belonging to the three species. New injuries were detected on colonies by comparing photographs from consecutive censuses. The census intervals for the first yearly period (1994 - 1995) were February to May, May to August, August to November and November to February, and the census intervals for the second yearly period (1995 -1996) were February to June, June to October and October to February. Changes in the number of new injuries present on colonies among species and colony sizes over time were tested using a repeated measures ANOVA. The two yearly periods were analysed separately. The ANOVA model consisted of species and colony size as fixed factors and colonies as a random factor nested within the fixed factors. The data were log-transformed to conform to the assumptions of the analysis.
2.4. RESULTS
2.4.1. General summary of results
The spatial and temporal patterns of injury on reef-crest corals around Lizard Island were influenced by colony size, location, species, initial injury size and time. For the spatial study, the incidence of partial mortality was low, and differed among sites due to variations in the composition and size-structure of the reef-crest assemblages, and the contrasting injury profiles of small and large colonies with differing morphologies. The pattern of injury over time (net effect of initial injury status, fate of injuries over 12 months and the addition of new injuries) for G. retiformis, A. gemmifera and A. hyacinthus was dependent on species, colony size, initial injury size and census year. The results of the spatial and temporal studies of injury have been discussed in detail below.
2.4.2. Spatial patterns of injury
The injury profile of 673 colonies was surveyed at 4 sites around Lizard Island and a total of 4374 injuries were recorded. Of the total number of colonies recorded, 287 were small (< 100cm2) and 386 colonies were large (> 100cm2). The number of uninjured colonies surveyed was low, making up 27% of the total (n = 184). The majority of these uninjured colonies (72%) were small in size (n = 132 and 52 for uninjured small and large colonies respectively). For injured colonies, the majority of injuries present were < 1cm2 in size with only 18% of the total number of injuries being > 1cm2. This pattern was consistent over all sites (Table 2.1).
2.4.2.1. Patterns of tissue loss between sites
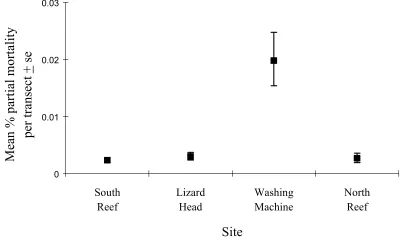
Partial mortality was relatively low at all sites (Figure 2.2). Nevertheless, striking differences were detected in the amount of partial mortality present between sites. The average amount of partial mortality per transect was approximately three times higher at Washing Machine than the other three sites (ANOVA, F3,36 = 18.67, p = 0.0001, Figure
partial mortality per transect for South Island, North Reef and Lizard Head (Tukey’s Test, Figure 2.2).
Figure 2.2. Mean percent partial mortality per transect for the four study sites around Lizard Island. (Error bars = one SE).
0 0.01 0.02 0.03
South Reef
Lizard Head
Washing Machine
North Reef
Site
Mean % partial mortality
per transect
+
[image:36.595.110.512.203.454.2]se
Table 2.1. The number of small (< 1 cm2) and large (> 1 cm2) injuries present at South Island (SI), Lizard Head (LH), Washing Machine (WM) and North Reef (NR), Lizard Island.
Site Number of
Small Injuries
Number of Large Injuries
Percentage of Small Injuries
Percentage of Large Injuries
SI 1146 160 88% 12%
LH 745 128 85% 15%
WM 645 186 79% 21%
NR 1050 305 77% 23%
2.4.2.2. The effect of morphology and colony size on injury patterns at the four sites
The number of injured and uninjured colonies and colonies with low and high levels of partial mortality was consistent among sites for the different colony sizes and
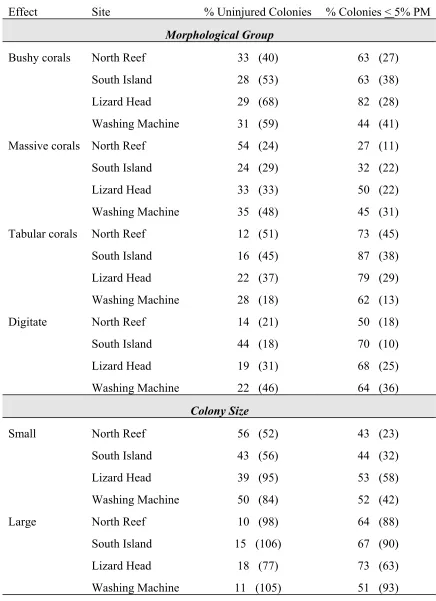
morphological groups (Table 2.2). For the four morphological groups there were generally fewer uninjured colonies than injured colonies and most injured colonies had low amounts of partial mortality. Approximately 50% of small colonies and less than 25% of large colonies were uninjured and there was an even mixture of injured colonies of both size classes with < 5% (low) and > 5% (high) partial mortality.
Table 2.2. The distribution of colonies within injury categories (uninjured versus injured and < 5% and > 5% partial mortality (PM)) amongst sites for morphological group and colony size expressed as a percentage of the total (n).
Effect Site % Uninjured Colonies % Colonies < 5% PM
Morphological Group
Bushy corals North Reef 33 (40) 63 (27)
South Island 28 (53) 63 (38)
Lizard Head 29 (68) 82 (28)
Washing Machine 31 (59) 44 (41)
Massive corals North Reef 54 (24) 27 (11)
South Island 24 (29) 32 (22)
Lizard Head 33 (33) 50 (22)
Washing Machine 35 (48) 45 (31)
Tabular corals North Reef 12 (51) 73 (45)
South Island 16 (45) 87 (38)
Lizard Head 22 (37) 79 (29)
Washing Machine 28 (18) 62 (13)
Digitate North Reef 14 (21) 50 (18)
South Island 44 (18) 70 (10)
Lizard Head 19 (31) 68 (25)
Washing Machine 22 (46) 64 (36)
Colony Size
Small North Reef 56 (52) 43 (23)
South Island 43 (56) 44 (32)
Lizard Head 39 (95) 53 (58)
Washing Machine 50 (84) 52 (42)
Large North Reef 10 (98) 64 (88)
South Island 15 (106) 67 (90)
Lizard Head 18 (77) 73 (63)
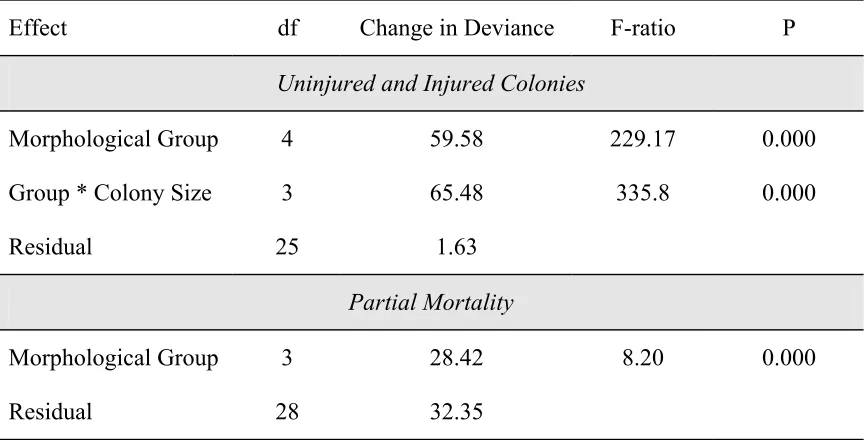
Table 2.3. Analysis of deviance for logistic regression models assessing the effects of site, morphology and colony size on (1) uninjured and injured colonies and (2) injured colonies with < 5% and > 5% partial mortality.
Effect df Change in Deviance F-ratio P
Uninjured and Injured Colonies
Morphological Group 4 59.58 229.17 0.000
Group * Colony Size 3 65.48 335.8 0.000
Residual 25 1.63
Partial Mortality
Morphological Group 3 28.42 8.20 0.000
Residual 28 32.35
2.4.2.3. Coral community composition and size-structure among sites
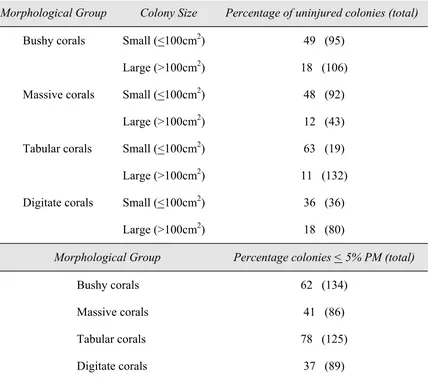
Table 2.4. (a) The percentage of uninjured colonies among morphological groups and colony sizes and (b) the percentage of colonies with < 5% partial mortality (PM) for the four morphological groups.
Morphological Group Colony Size Percentage of uninjured colonies (total)
Bushy corals Small (<100cm2) 49 (95)
Large (>100cm2) 18 (106)
Massive corals Small (<100cm2) 48 (92)
Large (>100cm2) 12 (43)
Tabular corals Small (<100cm2) 63 (19)
Large (>100cm2) 11 (132)
Digitate corals Small (<100cm2) 36 (36)
Large (>100cm2) 18 (80)
Morphological Group Percentage colonies < 5% PM (total)
Bushy corals 62 (134)
Massive corals 41 (86)
Tabular corals 78 (125)
Digitate corals 37 (89)
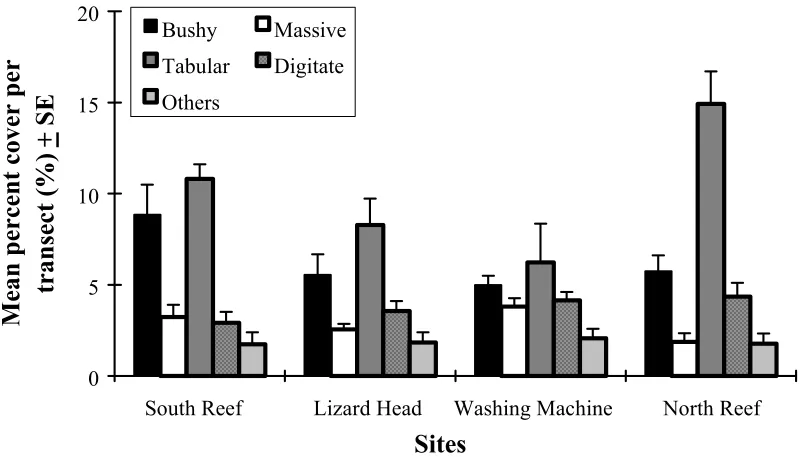
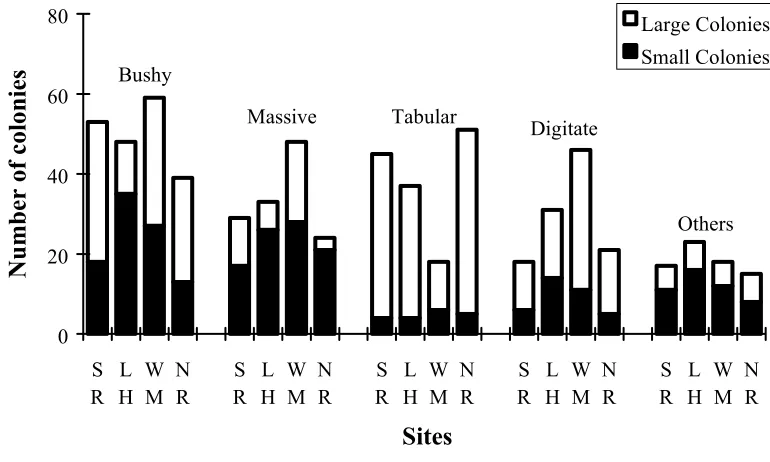
The percent coral cover per transect was also low (< 20%) and showed a similar pattern among sites to that observed for coral abundance (Figure 2.3). The average percent cover was similar for all morphological groups among sites with the exception of tabular corals which differed significantly between North Reef and Washing Machine by a factor of two (Figure 2.4). The distribution of small (<100cm2) and large
small in size, and tabular and digitate corals had a greater number of large colonies (Figure 2.5). Overall, tabular corals were at least an order of magnitude larger in size than the other three main morphological groups (average size + SE for tabular, bushy, digitate and massive corals were respectively: 4579 + 73 cm2, 425 + 24 cm2, 306 + 7 cm2, and 181 + 7 cm2).
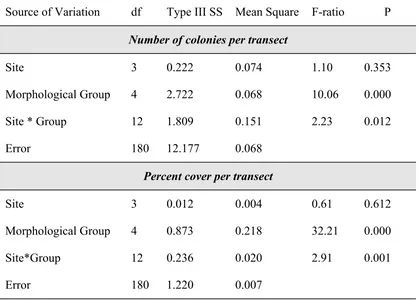
Table 2.5. A summary of the ANOVA results testing for differences in (a) mean number of colonies per transect and (b) mean percent cover between sites and morphological groups.
Source of Variation df Type III SS Mean Square F-ratio P
Number of colonies per transect
Site 3 0.222 0.074 1.10 0.353
Morphological Group 4 2.722 0.068 10.06 0.000
Site * Group 12 1.809 0.151 2.23 0.012
Error 180 12.177 0.068
Percent cover per transect
Site 3 0.012 0.004 0.61 0.612
Morphological Group 4 0.873 0.218 32.21 0.000
Site*Group 12 0.236 0.020 2.91 0.001
Figure 2.3. The number of colonies per transect among morphological groups at each site around Lizard Island. (Number of transects = 10, error bars represent one SE).
0 3 6 9
Sites
Mean number of colonies
per transect
+
SE
Bushy Massive Tabular
Digitate Others
South Reef Lizard Head Washing Machine North Reef
Figure 2.4. The coral cover per transect of morphological groups at each site around Lizard Island. (Number of transects = 10, error bars represent one SE).
0 5 10 15 20
Sites
Mean percent cover per
transect (%)
+
SE
Bushy Massive
Tabular Digitate Others
[image:42.595.114.517.471.702.2]Figure 2.5. The distribution of small and large colonies among morphological groups and sites at Lizard Island. (SI = South Island; LH = Lizard Head; WM = Washing Machine; NR = North Reef).
0 20 40 60 80 S R L H W M N R S R L H W M N R S R L H W M N R S R L H W M N R S R L H W M N R Sites
Number of colonies
Large Colonies Small Colonies Bushy
Massive Tabular Digitate
[image:43.595.122.507.181.412.2]Others
Table 2.6. Analysis of deviance for the logistic regression model assessing the effects of morphological group and sites on the distribution of small and large colonies.
Effect df Change in deviance F-ratio P
Morphological Group 4 117.39 10.434 0.000
Residual error 15 42.19
2.4.3. Temporal patterns of injury
2.4.3.1. Initial Status of Injuries
A total of 1579 injuries were recorded initially on colonies of G. retiformis, A.
The initial distribution of these injuries was dependent on their size, species and census year (Log-linear Analysis, F-ratio = 7.747(2,7), P = 0.0168). The proportion of small and
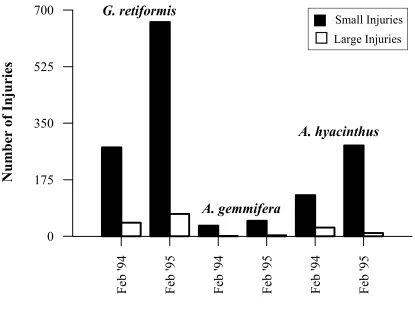
large injuries present on colonies was fairly consistent for all species and both censuses, with over 80% of these injuries being < 1cm2 in size (Figure 2.6). In contrast, the number of injuries varied among species and census years. Goniastrea retiformis
colonies had the highest number of injuries (total number = 1031), twice that of A. hyacinthus colonies and 12-times that of A. gemmifera colonies. The number of injuries present on G. retiformis colonies in February 1994 was approximately half that
[image:44.595.104.519.371.684.2]observed in February 1995.
Figure 2.6. The number of small and large injuries on colonies of G. retiformis, A. gemmifera and A. hyacinthus in February 1994 and February 1995.
Feb '
94
Feb '95 Feb '94 Feb '95 Feb '
94
Feb '95
0 175 350 525
700
G. retiformis
A. hyacinthus
A. gemmifera
Census Interval
Nu
mb
er
of In
jurie
s
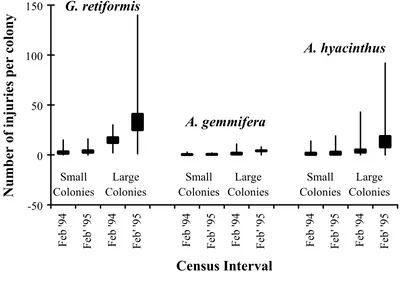
Similarly, the number of injuries present on A. hyacinthus colonies was greater in February 1995 than February 1994, by a factor of two for small injuries and a factor of three for large injuries. This increase in the number of injuries in February 1995 for both G. retiformis and A. hyacinthus was caused by the random selection of colonies that had, on average, more injuries per colony , and the inclusion of one large G. retiformis colony with an exceptionally high number of injuries (Figure 2.7). In contrast, the number of small and large injuries on A. gemmifera were similar for both years.
Figure 2.7. The range ( | ) and average number of injuries per colony + SE ( ) present on large and small colonies of G. retiformis, A. gemmifera and A. hyacinthus in
February 1994 and February 1995. (Sample sizes for small and large colonies of G. retiformis, A. gemmifera and A. hyacinthus are 11,11,9,10,10,9,10,9,10,8,10, and 10 respectivlely).
-50 0 50 100 150
Feb '94 Feb' '95 Feb '94 Feb' '95 Feb '94 Feb' '95 Feb '94 Feb' '95 Feb '94 Feb' '95 Feb '94 Feb' '95
Census Interval
Number of injuries per colony
Small Colonies
Large Colonies
Small Colonies
Large Colonies
Large Colonies Small
Colonies
G. retiformis
A. gemmifera
A. hyacinthus
found on large colonies, with less than 20% of injuries being present on small colonies (Figure 2.8). Furthermore, there were approximately twice as many injuries present on large colonies in February 1995 than February 1994 (Figure 2.8), mainly due to a general increase in the number of injuries on colonies for A. hyacinthus and G. retiformis (Figure 2.7).
Figure 2.8. The distribution of injuries between small and large colonies in February 1994 and February 1995.
0
500
1000
Small ( 100 cm )
<
2Large (> 100 cm )
2Colony Size
Number of I
njuries
February 1994
February 1995
2.4.3.2. Fate of Injuries
small injuries was further dependent on species and census year (Classification Tree, secondary and tertiary splits, Figure 2.9). For colonies of G. retiformis, the status of small injuries did not change over 12 months for either census period (i.e. 96% of injuries stayed the same size, Table 2.7). In contrast, the status of small injuries was more dynamic for the two Acropora species, with a small proportion of injuries getting larger or recovering, and the majority of injuries staying the same size (Table 2.7).
Figure 2.9. A classification tree showing the relationship between fate and initial injury size, species and census. The proportion of injuries belonging to each fate have been provided beneath the terminal split, along with the number of injures (n) for that subset of data. (Reg = regeneration; Shrank = injuries that decreased in size from large to small; Same = injuries stayed the same size; Grew = injuries that increased in size from small to large).
Initial Injury Size
Small Large
G. retiformis Acropora species
Species Species
Year February ‘94 - ’95
Feruary ’95 -’96
G. retiformis
A. gemmifera A. hyacinthus
FATE Reg = 0.00 Same = 0.96 Grew = 0.04
n = 938 FATE Reg = 0.39 Same = 0.57 Grew = 0.04
n = 160
FATE Reg = 0.14 Same = 0.61 Grew = 0.25
n = 329
FATE Reg = 0.00 Shrank = 0.03
Same = 0.97 n = 115
FATE Reg = 0.03 Shrank = 0.43
There was also a change in the fate of small injuries between yearly intervals,
particularly for A. hyacinthus (Table 2.7). In the first census, the proportion of small injuries regenerating was higher (48%) than the proportion of small injuries getting larger (1%) while the opposite pattern was true for the second census (14% of small injuries regenerating and 28% of small injuries getting larger). The fate of large injuries was dependent on species (Classification Tree, secondary split, Figure 2.9). The
majority of large injuries (97%) belonging to colonies of G. retiformis and A. gemmifera
did not change status over a 12 month period (Table 2.7, Figure 2.9). In contrast, the fate of large injuries for A. hyacinthus were more dynamic, with a small proportion of large injuries shrinking into the smaller size class or regenerating (Table 2.7, Figure 2.9). The fate of injuries was not influenced by colony size since the majority of injuries stayed the same size, irrespective of colony size (n = 156 and 1168 for small and large colonies respectively), and less than 10% of injuries shrank/regenerated or grew in size (shrank/regenerated: n = 22 and 112; grew: n = 14 and 107 for small and large colonies respectively).
2.4.3.3. New Injuries
A total of 989 new injuries were recorded on 117 colonies over two 12 month periods, 456 new injuries from Feb’94 - Feb’95 and 533 new injuries from Feb’95 - Feb’96. The majority of these injuries (n = 890) were less than 1 cm2 in size. The new injuries were observed predominantly on A. hyacinthus (n = 868) with only 80 and 41 new injuries being found on G. retiformis and A. gemmifera respectively. The average number of new injuries differed among species and colony size for each yearly census (between subject effects, Table 2.8, Figure 2.10). Additionally, the accumulation of injuries on A. hyacinthus, A. gemmifera and G. retiformis over 3 -4 monthly intervals was highly variable for the 1994 - 1995 census interval but consistent over time for the 1995 - 1996 census interval (within subject effects, Table 2.8, Figure 2.10). Generally, the average number of new injuries was consistenly low for G. retiformis and A.
variable (Figure 2.10). Average numbers of new injuries for large A. hyacinthus
[image:49.595.94.530.262.642.2]colonies were approximately 2 - 5 times higher in the second census, with the exception of August 1994, where the number of new injuries recorded was 5 times higher than any other census interval between Feb’94 - Feb’95.
Table 2.7. The number of injuries that regenerated, shrank, stayed the same, or grew over 12 months, cross-classified by initial injury size, species and census interval.
SMALL INITIAL SIZE
Census Fate
Species Interval Regenerated Same Status Grew
G. retiformis Feb’94 - Feb’95 4 261 10
Feb’95 - Feb’96 0 639 24
A. gemmifera Feb’94 - Feb’95 2 27 4
Feb’95 - Feb’96 7 38 3
A. hyacinthus Feb’94 - Feb’95 61 65 1
Feb’95 - Feb’96 39 163 79
LARGE INITIAL SIZE
Census Fate
Species Interval Regenerated Shrank Same Status
G. retiformis Feb’94 - Feb’95 0 1 40
Feb’95 - Feb’96 0 3 66
A. gemmifera Feb’94 - Feb’95 0 0 1
Feb’95 - Feb’96 0 0 4
A. hyacinthus Feb’94 - Feb’95 0 16 11
Table 2.8. Repeated measures ANOVA testing the effect of species and colony size on the number of new injuries per colony over time for the two consecutive years. (a = Feb’94 -‘95 and b = Feb’95 - 96).
a. Feb’94 -May’94, May’94 - Aug’94, Aug’94 - Nov’94 and Nov’94 - Feb’95.
Between Subject Effects
Source of Variation df Type III SS Mean Square F-ratio P
Species 2 2.001 1.001 15.26 0.000
Colony Size 1 0.414 0.414 6.31 0.015
Species*Colony Size 2 0.998 0.499 7.61 0.001
Error 51 4.197 0.066
Within Subject Effects
Time 3 0.668 0.223 3.20 0.024
Time*Species 6 1.721 0.287 4.12 0.001
Time*Colony Size 3 0.686 0.229 3.29 0.022
Time*Colony Size*Species 6 1.595 0.266 3.82 0.001
Error 192 13.353 0.070
b. Feb’95 - June’95, June’95 - Oct’95 and Oct’95 - Feb’96.
Between Subject Effects
Source of Variation df Type III SS Mean Square F-ratio P
Species 2 3.764 1.882 9.87 0.000
Colony Size 1 2.608 2.608 13.68 0.000
Species*Colony Size 2 2.871 1.436 7.53 0.001
Error 51 9.726 0.191
Within Subject Effects
Time 2 0.095 0.048 1.02 0.366
Time*Species 4 0.376 0.094 2.01 0.099
Time*Colony Size 2 0.213 0.106 2.28 0.108
Time*Colony Size*Species 4 0.223 0.056 1.19 0.319
Figure 2.10 . The mean number of new injuries per colony over time for large and small colonies of G. retiformis, A. gemmifera and A. hyacinthus. (Error bars represent one SE). Feb '94 - May'94 May'94 - Aug'94 A ug' 94 - N ov '9 4 N ov'94 - Feb'95 Feb '95 - Ju ne'95 June'95 - O ct '95 Oct'95 - Feb'96 Feb '94 - May'94 May'94 - Aug'94 A ug' 94 - N ov '9 4 N ov'94 - Feb'95 Feb '95 - Ju ne'95 June'95 - O ct '95 Oct'95 - Feb'96 0 5 10 15 0 5 10 15
SMALL COLONIES LARGE COLONIES
0 5 10 15 0 5 10 15 0 5 10 15 0 5 10 15
A. hyacinthus
G. retiformis
A. gemmifera
Mean number
of new inju
2.4.3.4. Frequency of Injury
The number of census intervals during which a colony sustained an injury was low for both colony sizes of G. retiformis and A. gemmifera and for small colonies of A. hyacinthus (Table 2.9). In fact, most of these colonies were either injured only in one census period or not at all. In contrast, large colonies of A. hyacinthus were injured more often, with 2 or 3 injury events being the most common observed. The frequency of injury among species and colony sizes was consistent over years.
Table 2.9. The number of censuses in which colonies sustained injures recorded over 3 - 4 monthly intervals from 1994 - 1995 and 1995 - 1996 for small and large colonies of
G. retiformis, A. gemmifera and A. hyacinthus.
Colony Frequency of Injury
Species Size None Once Twice 3-times 4-times
Februrary 1994 - February 1995
G. retiformis Small 5 6 0 0 0
Large 4 5 0 0 0
A. gemmifera Small 7 3 0 0 0
Large 4 6 0 0 0
A. hyacinthus Small 6 4 0 0 0
Large 0 3 3 3 1
February 1995 - February 1996
G. retiformis Small 6 5 0 0 -
Large 6 4 0 0 -
A. gemmifera Small 6 3 0 0 -
Large 5 4 0 0 -
A. hyacinthus Small 4 4 0 0 -
2.5. DISCUSSION
Colony size, location, species and time are important in determining the spatial and temporal pattern of injury in scleractinian corals. Vulnerability to damage was species-specific and dependent on the injury regime (i.e. routine versus catastrophic).
Understanding routine and catastrophic mortality of corals is important because of their role in structuring coral reef populations and communities through such processes as differential mortality and competitive reversals (Connell 1978; Bak and Luckhurst 1980; Porter et al. 1982; Hughes and Jackson 1985; Hughes 1989; Bythell et al. 1993; Karlson and Hurd 1993).
2.5.1. Spatial patterns of injury
The overall amount of damage (partial mortality) was low (<2%) among sites around Lizard Island. However, distinct differences were detected between sites with Washing Machine having approximately three times the amount of partial mortality of the other sites (Figure 2.2). This pattern was influenced by the species composition and size-structure of these particular reef-crest assemblages (Figure 2.3, 2.4 and 2.5) because the injury profiles of reef-crest corals was dependent on colony size and morphological group (Table 2.4). Thus the low amount of partial mortality observed at North Reef, Lizard Head and South Reef was due to the domination of bushy and tabular corals (both in terms of numerical abundance and percent cover), corals with low amounts of partial mortality and fewer injured small colonies. In comparison, the higher levels of partial mortality at Washing Machine were due to a smaller number and percent cover of tabular corals and a greater presence of massive and digitate corals (which have more colonies with > 5% partial mortality and fewer uninjured small colonies ) became more important. Partial mortality was higher in massive and digitate corals possibly because they are longer-lived and slower growing than bushy and tabular corals and the
Alternatively, massive and digitate corals may be more prone to certain types of damage than bushy and tabular corals.
The presence of an injury on a colony at a particular time is a function of how vulnerable the coral is to damage and how fast the injury recovers. In this study, the patterns of injury for small and large colonies of the four main morphological groups were consistent among sites, and therefore the turn - over of injuries on corals was independent of location. A complex interaction among the many biotic and abiotic agents which cause damage to corals and variations in recovery rates of injuries are most likely responsible for this pattern rather than a uniform set of circumstances at each site. Conversely, the distinct differences detected in the proportions of injured and uninjured colonies between morphological groups and colony size, and the proportion of colonies with high and low levels of partial mortality among morphological groups infers that vulnerability to damage and recovery is size-specific and differs among morphological groups.
Vulnerability to damage is complex and dependent on many interrelated factors (e.g. genetics, attractiveness to predators, vulnerability to disease, resistance to physical damage, colony size and location). Morphology also plays a major role (Jackson 1979; Meesters et al. 1996, 1997a; Hall 1997) in the degree of vulnerability to damage
dependent on the mechanical strength of coral skeleton, orientation and thickness of branches, and the degree of bioerosion (e.g. Chamberlain 1978; Liddle and Kay 1987).
The rate of recovery of inju