ii
University of Southern Queensland
Faculty of Engineering & Surveying
Flexural strength of three types of glass powder
reinforced Vinyl Ester composites
A dissertation submitted by
Rezwanul Huq
In fulfilment of the requirements of
Courses ENG4111 and 4112 Research Project
towards the degree of
Bachelor of Engineering (Mechanical)
iii
Abstract
Composites can be obtained from the combination of various materials, as long as the materials are
distinct at a macroscopic level. The significant benefit of using composites is their superior
mechanical properties (such as strength, corrosion resistance, light weight, etc.) as well as low
manufacturing cost during mass production.
When very fine (powder) spherical, hollow glass beads are mixed with Vinyl Ester (VE) resin and a
catalyst such as MEKP (Methyl ethyl ketone peroxide) are mixed together, the chemical reaction
that takes place between the VE and MEKP binds the glass beads in a strong bond and becomes a
composite of stronger mechanical properties than the glass spheres.
Therefore, there is scope to form specimens of different types of glass powder sphere reinforced
composites and analyse them for their flexural behaviour. From such analysis, it would be possible
to come up with conclusions on the appropriateness of future research and commercialisation of the
iv
University of Southern Queensland
Faculty of Engineering and Surveying
ENG 4111 & 4112 Research Project
Limitations of Use
The Council of the University of Southern Queensland, its Faculty of Engineering and Surveying,
and the staff of the University of Southern Queensland, do not accept any responsibility for
the truth, accuracy and completeness of material contained within or associated with this
dissertation.
Persons using all or any part of this material do so at their own risk, and not at the risk of the
Council of the University of Southern Queensland, its Faculty of Engineering and Surveying or the
staff of the University of Southern Queensland.
This dissertation reports an education exercise and has no purpose or validity beyond this exercise.
The sole purpose of the course “Project and Dissertation” is to contribute to the overall education
within the student’s chosen program. This document, the associated hardware, software, drawings
and other material set out in the associated appendices should not be used for any other
purpose: if they are so used, it is entirely at the risk of the user.
Prof Frank Bullen
Dean
v
Certification
I certify that the ideas, designs and experimental work, results, analyses and conclusions set out in
this dissertation are entirely my own effort, expect where otherwise indicated and acknowledged.
I further certify that the work is original and not been previously submitted for assessment
in any other course or institution, expect where specifically stated.
Rezwanul Huq
Student Number: 005 002 4547
__________________________
Signature
29 October 2009
__________________________
vi
Acknowledgements
I would like to take this opportunity to extend my earnest gratitude to my project supervisor,
Dr. Harry Ku, for his valuable guidance, precious time, kind encouragement all through my project
work.
I would also like to thank Mr. Mohan Trada for their important advice and kind assistance during
the casting and testing phases. I am also thankful to Dr. Deb Stenzel of Queensland University of
Technology for her time and enthusiasm in conducting the SEM analysis of the samples I had
prepared.
Finally, I am grateful to my family, colleagues and friends for their encouragement and support.
Rezwanul Huq
University of Southern Queensland
vii
Table of Contents
Chapter 1Introduction... 1
1.1 Introduction ... 1
1.2 Research Objectives... 2
1.3 Conclusions ... 2
Chapter 2Literature review ... 3
2.1 Formation of Composites... 3
2.1.1 Phases... 3
2.2 Types of composites ... 4
2.2.1 Classification based on constituents ... 4
2.2.2 Classification based on matrices ... 5
2.3 Thermoset... 6
2.3.1 Vinyl Esters (VE) ... 7
2.4 Flexural Strength ... 7
2.4.1 Definition ... 7
2.4.2 Testing Methods ... 7
2.4.2.1 Three point (3-point) flexural test ... 8
2.5 Fillers, resins and catalysts... 9
2.5.1 Filler: Glass powder ... 9
2.5.2 Resin: Vinyl Ester (VE)... 11
2.5.3 Choice of catalyst ... 15
2.5.3.1 Methyl Ethyl Ketone Peroxide (MEKP)... 15
2.6 Microscopic analysis – Scanning electron microscopy (SEM)... 16
2.6.1 Sample preparation... 17
2.6.1 Imaging ... 19
2.7 Sustainability... 20
Chapter 3Project Methodology ... 22
viii
3.1.1 Composite formation ... 22
3.1.2 Preparation of the open mould ... 22
3.1.3 Weighing the constituents... 24
3.1.5 Mixing the constituents ... 25
3.1.6 Pouring the mixture in the mould... 26
3.1.7 Natural curing ... 26
3.1.8 Post curing ... 27
3.1.9 Flexural property testing... 29
3.2 Assessment of Significant Effects ... 30
3.3 Safety issues and precautions... 31
Chapter 4 Results, Discussion & Observations... 34
4.1 Results & Discussion... 34
4.1.1 Flexural strength ... 34
4.1.2 Flexural strain... 36
4.1.3 Flexural modulus ... 39
4.2 Observations... 40
4.2.1 SEM observations... 44
Chapter 5Conclusion ... 49
References ... 50
Appendix A: Project Specification ... 52
Appendix B: Composite formation datasheet ... 56
Appendix C: UTS Data and Plots... 59
ix
Nomenclature
MSDS = Material Safety Data Sheet
F = Force (in Newtons)
A = Cross section area
L = Original length
D = Deflection
b = Width
d = Thickness
σ = Stress
ε = Strain
MPa = Mega Pascals
VE = Vinyl Ester resin
1
Chapter 1
Introduction
1.1
Introduction
Composites are engineered materials that are comprised of two or more constituent materials. The
chemicals or physical behaviour of the constituent materials are significantly different from each
other and they remain separate at a macroscopic level within the finished composite structure.
Composite materials (or ‘composites’) have been around for more than 5000 years. In modern
times, there has been growing interest in composites due to the fact that they can offer desired
combination of properties (e.g., light, strong, corrosion resistant materials). This concept of
achieving a better combination of properties is called the principle of combined action.
Examples
New: Advanced materials, engineered to specific applications, such as plywood, oriented strand board, wood plastic composite (recycled wood fibre in polyethylene matrix), perlitic
steel (combination of hard, brittle cementite with soft, ductile ferrite to get a superior
material).
Old: brick-straw composites, paper.
2
1.2
Research Objectives
The aim of this research project is to produce various vinyl ester composite specimens with
different percentage by weight of filler (glass powder). After the initial casting, curing and post
curing, flexural strength tests were conducted in the university laboratory to obtain flexural strength
data of the composite materials.
The data was analysed to evaluate trends and formulae for the theoretical prediction of the
composite material behaviour.
1.3
Conclusions
This dissertation aims at providing a detailed overview of the composite specimen casting, curing,
post curing, testing and result analysis on three (3) types of glass powders, namely, Sphericel
60P18, QCel 5020 and QCel 6019.
A review of literature associated to this research would help determine the key concepts and
important background research data and information. Also, it would provide a good foundation for
future research work.
The outcome of this research may provide the starting point for future research, as composites have
been attracting much attention from researchers. Also, the results obtained during this exercise may
be used to design and develop newer, cost effective composites by using hollow glass spheres and
3
Chapter 2
Literature review
2.1
Formation of Composites
2.1.1 Phases
Solid materials are divided into four classes: polymers, metals, ceramics, and carbon. Generally,
composites, alike other solid materials, are comprised of two materials or ‘phases’:
1. Matrix phase (continuous)
2. Reinforcing/dispersed phase (particulates, fibres)
As the basic formation method of composites, the ‘reinforcing phase’ is embedded in the other
material called ‘the matrix phase’. The reinforcing phase and the matrix phase can both be metal,
ceramic, or polymer.
Normally, reinforcing phases are strong with low densities while the matrix phase is usually a
ductile or tough material. If the composite is designed and fabricated correctly, it combines the
strength of the reinforcement with the toughness of the matrix to achieve a combination of desirable
properties not available in any single conventional material.
(a)Matrix
The matrix is the monolithic material into which the reinforcement is embedded, and is completely
continuous. This means that there is a path through the matrix to any point in the material, unlike
4
such as aluminium, magnesium, or titanium, and provides a compliant support for the
reinforcement. In high temperature applications, cobalt and cobalt-nickel alloy matrices are
common.
(b)Reinforcement
As mentioned earlier, the reinforcement material is embedded into the matrix. The reinforcement
does not always serve a purely structural task (reinforcing the compound), but is also used to
change physical properties such as wear resistance, friction coefficient, or thermal conductivity. The
four key types of reinforcements used in composites are continuous fibres, discontinuous fibres,
[image:13.595.148.449.348.518.2]whiskers (elongated single crystals), and particles (refer to figure below).
Figure 1: Types of reinforcements
2.2
Types of composites
2.2.1 Classification based on constituents
5
1. Particle-reinforced
Large-particle
Dispersion-strengthened
2. Fibre-reinforced
Continuous (aligned)
Discontinuous short fibres (aligned or random)
3. Structural
Laminates
Sandwich panels
2.2.2 Classification based on matrices
Composite
materials
Matrices
Polymer Matrix
Composites (PMC)
Metal Matrix
Composites (MMC)
Ceramic Matrix
Composites (CMC)
6
(i) Polymer Matrix Composite (PMC)
Polymer Matrix Composite (PMC) is the material consisting of a polymer (resin) matrix combined
with a fibrous reinforcing dispersed phase. Polymer Matrix Composites are very popular due to
their low cost and simple fabrication methods.
(ii)Metal Matrix Composite (MMC)
Metal Matrix Composites (MMC) is a composite where a metal or alloy forms a continuous
network.
(iii) Ceramic Matrix Composite (CMC)
The key ceramics used as CMC matrices are silicon carbide, alumina, silicon nitride, mullite, and
various cements. The properties of ceramics, especially strength, are even more process sensitive
than those of metals.
2.3
Thermoset
Thermosetting resins are used in moulded and laminated plastics. These resins are fluid at standard
temperature and pressure. They are first polymerized into a low-molecular-weight linear or slightly
branched polymer or oligomers, which are still soluble, fusible, and highly reactive during final
processing. Thermoset resins are generally highly filled with mineral fillers and glass fibres.
Thermosets are generally catalysed and/or heated to finish the polymerization reaction, cross
linking them to almost infinite molecular weight. This step is often referred to as curing. Such cured
polymers cannot be reprocessed or reshaped. The high filler loading and the high crosslink density
of thermoset resins result in high densities and low ductility but high rigidity and good chemical
7
2.3.1 Vinyl Esters (VE)
Vinyl esters are part of the unsaturated polyester family. They are prepared by the reaction of an
epoxy resin with meth acrylic acid. Thus the epoxide group is converted into a meth-acrylate ester.
Vinyl esters offer an enhancement in properties over unsaturated polyesters with greater toughness
and better resistance to corrosion to a wide range of chemicals. This chemical resistance includes
halogenated solvents, acids, and bases.
Uses: Applications for vinyl esters are similar to those for unsaturated polyesters but where added toughness and chemical resistance are required, i.e., electrical equipment, flooring, fans, adsorption
towers, process vessels, and piping.
2.4
Flexural Strength
2.4.1 Definition
In brittle materials, flexural strength is a mechanical parameter that indicates a material's ability to
resist deformation when it is placed under a load. Frequently, a transverse load is applied on a
sample of rectangular cross-sectional area until the sample fractures. The highest stress the material
experiences at the moment of failure is known to be the flexural strength of the material.
Understandably, since it attempts to find the highest stress at the moment of failure, the measure of
flexural strength is stress in MPa.
2.4.2 Testing Methods
The International Organisation for Standards (ISO) specifies 2 methods for determining the flexural
8
1. Three point (3-point) flexural test
2. Four point (4-point) flexural test
For this project, testing has been carried out using the 3-point flexural test arrangement.
2.4.2.1 Three point (3-point) flexural test
The three point (3-point) flexural test is a flexure test that produces tensile stress in the convex side
of the specimen and compressive stress in the concave side as load is applied on a sample of
rectangular cross-section. By calculating the highest stress experienced by the outermost fibre and
[image:17.595.186.404.369.458.2]the amount of deflection at failure, we can determine the flexural strength of that material.
Figure 2: Three point (3-point) flexural test arrangement
The governing equation for calculating flexural strength of a rectangular sample in a 3-point test is:
2
2
3
bd
FL
where,
σ = Flexural strength [MPa]
F = load (force) at the fracture point [N]
L = length of the support span [mm]
9
d = thickness of the support span [mm]
2.5
Fillers, resins and catalysts
2.5.1 Filler: Glass powder
Fillers (reinforcement materials) help reduce shrinkage during moulding, lower the manufacturing
cost and improve strength of the material. They are also used to improve electrical and thermal
insulating properties and chemical resistance. The testing will be done by varying the amount of
filler from 0 to 30 %.
Three (3) types of hollow glass spheres (powders) were used in this project to manufacture the
composites. They are:
1. QCEL 5020
2. QCEL 6019
3. SPHERICEL 60P18
QCEL 5020 & 6019:
QCel Hollow Microspheres have sufficient pressure and shear resistance to withstand typical
mixing processes. They dissolve easily into a wide range of liquid systems and because of their
low density and spherical shape; they do not contribute significantly to viscosity. To ensure
maximum effectiveness, density is commonly used as an indication of sphere content. QCel
Hollow Spheres provide an economical way to reach the critical density required for the final
product.
10
Physical Form Free-Flowing Low Density Powder
Color White
Surface Treatment Oleophilic (having a strong affinity for oils
rather than water)
Density (g/cm3) Particle Size µm
(Malvern) Working pressure
Type
Bulk Effective Mean Range psi bar MPa
5020 0.12 0.20 55 5 ~ 115 500 34 3.4
6019 0.13 0.21 75 5 ~ 175 500 34 3.4
SPHERICEL 60P18:
Sphericel 60P18 hollow glass spheres are used to enhance performance and reduce viscosity in
paints and coatings and as lightweight additives in plastic parts. They are chemically inert,
non-porous, and have very low oil absorption.
Grade 60P18 is used in many high performance polymer systems.
Typical properties of the spheres are as following:
Shape Spherical
Color White
Composition Proprietary Glass
Density 1.1 g/cc and 0.6 g/cc
Particle Size Mean Diameter 11 and 18 microns
Hardness 6 (Moh’s Scale)
Chemical Resistance Low alkali leach/insoluble in water
Crush Strength >10,000 psi
Sphericel 60P18 hollow spheres offer formulators flexibility in polymer composites. The
11
urethane castings can provide weight reduction cost savings and improved impact resistance.
Insulating features of hollow spheres also work to the chemists' advantage in thermal shock
and heat transfer areas. Two densities available are 0.6 to 1.1 g/cc; it provides choices to best
fit mixing and target weight requirements (Potters Industries, undated b). The density of the
hollow glass powder used in this research is 0.6 g/cc because the other filler, ceramic hollow
spheres or SLG used in similar study is 0.7 g/cc; this will give a better basis for comparison of
results obtained in the future. When used in polymer concrete, hollow spheres provide a cost
effective alternative without degrading physical properties. The material safety data sheet of
Sphericel 60P18 hollow spheres was also carefully studied to avoid unnecessary accidents
(Potters Industries, undated b; undated c).
The particle size of the white glass powder ranges from 6 to 32 microns with an average size of
20 microns. They are therefore micron fillers. These fused inorganic oxides are spherical and
non-porous.
2.5.2 Resin: Vinyl Ester (VE)
Vinyl esters (matrix phase) are a family of thermosetting resins that have many similarities to, and
seem to fit between, both unsaturated polyesters and epoxies. These resins are slightly more
expensive than unsaturated polyesters but are not as expensive as epoxies. It offers superior
chemical resistance, maximum service temperature of 220⁰F (104⁰C), fast chemical set time and
low porosity. They have better toughness and corrosion resistance compared to polyesters and cure
easier than epoxies. Therefore, vinyl esters are ideal candidates where cost is a major issue and
12
Advantages of vinyl ester resins
Vinyl esters have found their use in bathroom fixtures, automotive body parts, chemical storage
tanks, pipes and liners, furniture, boat hulls, fishing rods, light weight ladder rails, recreational
vehicle parts and architectural components. Cost of vinyl ester resins is comparative with polyesters
and are thus is used in various applications, for its very low cost per unit volume. Vinyl ester resins
have high chemical resistance as compared to other cheap resins. Also, they have good dimensional
stability under temperature fluctuations and good adhesive properties. Due to these special
properties, vinyl ester resins have been found to be attractive for aircraft, mass transit vehicles, and
as interior construction materials. But due to styrene contents, this resin is not suitable for use in
areas of food handling and preparation because of the risk of tainting.
13
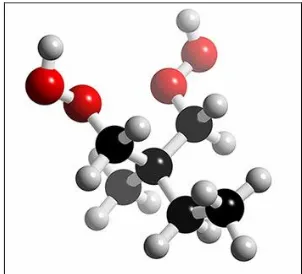
Vinyl ester polymers are formed by reacting an epoxy resin with an acrylic acid. The acrylic acid
opens the epoxy rings and makes way for multiple sites for cross linking (curing) reactions. The
four main steps in this process are:
Step 1:
The cross linking reactions begin with a peroxide catalyst that splits into two parts, each
containing a free radical. Those free radicals then react with the carbon-carbon double bond
(as shown in the following figure).
Step 2:
In the presence of styrene molecules, the free radicals attack the polymer ends.
Step 3:
The styrene and the polymer bonds together. Depending on the relative concentrations of
polymer and styrene, and reaction conditions, several styrene molecules can form the cross
linking bridge.
Step 4:
The first polymer attaches to a second vinyl ester polymer. The non-reacting ends are likely
14
15
2.5.3 Choice of catalyst
For the purpose of cross linking reaction to initiate, a peroxide catalyst is required. As an optimal
choice in the polyester system, the following catalysts for vinyl ester resin can be used:
Methyl ethyl ketone peroxide (MEKP)
Methyl ethyl ketone peroxide (MEKP) is an organic, toxic peroxide. It is a colourless
and less sensitive to shock and temperature, and more stable in storage.
AkzoNobel Butanox LA
AkzoNobel Butanox LA is Methyl ethyl ketone peroxide (MEKP) in phthalate
mixture. It is used for the curing/cross linking of unsaturated polyester resins (similar
to MEKP).
Though MEKP was used as the primary catalyst, in the event of non-availability of MEKP,
AkzoNobel Butanox LA at higher concentration is used at 1.5% by weight for similar effect.
2.5.3.1 Methyl Ethyl Ketone Peroxide (MEKP)
MEKP is a colourless, oily liquid solution of methyl ethyl ketone peroxide at STP in dimethyl
phthalate, with 9% active oxygen. It is used as a catalyst which initiates the polymerization of
[image:24.595.221.372.578.715.2]polyester resins used in glass-reinforced plastic, and casting.
16 Molecular formula C4H10O4
Appearance Colourless, high-viscosity liquid
Density 1.15 g/cm³
Hazard classification Organic peroxide, Type D, class 5.2.
MEKP should be stored in a closed container in a cool, dry place away from all sources of heat,
sparks, or flames, and out of direct sunlight. Explosive decomposition may take place if MEKP is
exposed to high temperatures or contamination with foreign materials. This catalyst is not to be
stored in unvented glass containers or stored close to cobalt naphthenate, dimethyl aniline, or other
promoters, accelerators, acids, bases, or strong reducing agents. The contained used to store MEKP
should not be reused for any other purpose. Maximum storage temperature for MEKP is 38°C
(100°F) and decomposition temperature 68°C (155°F).
2.6
Microscopic analysis – Scanning electron microscopy (SEM)
The scanning electron microscope (SEM) is a type of electron microscope that images the sample
surface by scanning it with a high-energy beam of electrons in a raster scan pattern. In raster scan,
the beam sweeps horizontally left-to-right at a steady rate, then blanks and rapidly moves back to
the left, where it turns back on and sweeps out the next line. The electrons interact with the atoms
that make up the sample producing signals that contain information about the sample's surface
topography, composition and other properties such as electrical conductivity.
The SEM analysis provides magnification of a surface (in this case, the fracture surface) from 10
times to up to 500,000 times. Hence, important characteristics of composite materials can be
revealed at matrix-reinforcement level, which is not possible under a normal light microscope, let
17
Due to the construction and functional requirements of the scanning electron microscope, samples
usually need some preparation before they can be successfully imaged or analysed.
Samples must be:
Dry (placed into high vacuum)
Clean (placed into high vacuum; imaging of sample surface)
Able to generate a signal (image (SEI or BSI), analysis (EDS etc.))
Conductive (dissipation of charge and heat)
2.6.1 Sample preparation
For SEM analysis, samples require specialised preparation through a number of steps in sequence,
as they are required to withstand the vacuum inside the microscope:
1. Surface cleaning:
Scanning electron microscopy is a surface imaging and analysis technique. The surface of
the sample must be exposed and it is very important that the surface is clean. The surface of
the sample may be obscured by deposits eg. mucous, cell debris, blood cells, dust, wax, oil,
silt, wear debris, etc. Such surface debris need to be removed during this stage of
preparation.
2. Coating:
The sample surface must be electrically and thermally conductive to provide a good image
in the scanning electron microscope. Heat build-up (from the electron beam) may damage
the sample. Charge build-up (electrons from the beam have a negative charge) will repel the
18
To improve conductivity, the sample is coated with a thin layer of metal or carbon. This
layer usually is 10-25 nm thick; high resolution scanning electron microscopy may require a
thinner coating.
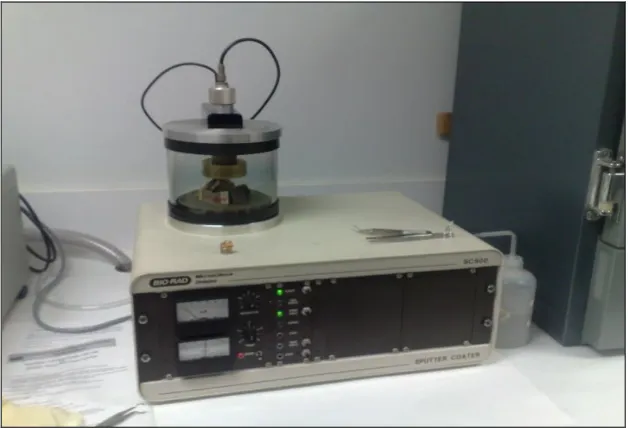
For topographical imaging of the composite samples made during the project, a gold sputter
coating was used. This method is used to gold coat samples for secondary electron imaging.
It is a non-directional coating method, which means, all surfaces of the sample are coated.
In a sputter coater machine, an inert gas (argon) is introduced in a relatively low vacuum
(10-3 Torr/10-1 Pa) into a high voltage (1-3 kV) field. The gas molecules are ionised and are
accelerated into metal ‘target’. For gold coating, the target is a gold foil. Metal atoms are
dislodged from the target, and the dislodged atoms continue to interact with argon,
producing a ‘cloud’. Gold atoms preferentially deposit on the sample (due to the
[image:27.595.154.478.455.663.2]configuration of the sample chamber), and build up a metallic coating on the sample.
19
Figure 5: Actual sputter coating machine.
3. Mounting:
If there are possibilities that the sample would not stay stable inside the electron microscope,
it would need to be mechanically stabilized using a ‘stub’. In the case of the samples
prepared during this project, stubs were not required as they could be held on the stage of
the SEM pretty firmly using double-sided tape.
2.6.1 Imaging
During SEM imaging, an electron beam is thermionically emitted from an electron gun fitted with a
tungsten filament cathode. Tungsten has the highest melting point and lowest vapour pressure of all
metals, thereby allows to be heated for electron emission and also costs less. These are the reasons
why it is often used as SEM filament.
As the scanning starts, the beam travels downward through a series of magnetic lenses designed to
20
beam back and forth across the specimen, row by row. As the electron beam hits each spot on the
sample, secondary electrons are knocked loose from its surface. A detector counts these electrons
and sends the signals to an amplifier. The final image is built up from the number of electrons
[image:29.595.150.445.176.430.2]emitted from each spot on the sample. The obtained image would appear similar to the one below.
Figure 6: Example of SEM image at 1000 times magnification.
The SEM can magnify the surface image to 500,000 times to reveal detail and complexity that is
otherwise not available for research.
2.7
Sustainability
This project has negligible impact on the environment and therefore is environmentally sustainable.
The resin, filler and catalysts used during sample preparation are mass produced and degradable.
The only major use of energy during sample preparation and testing was the use of electricity, of
course for which coal is a raw material. The carbon footprint of such a project can be reduced by
21
technology, availability and incentive to use Green Energy are all available in Australia, the
ecological impact of the project can be minimized to almost nil.
In the event of taking the research outcomes further by commercial ventures, it would be
recommended that the possibility of using eco-friendly manufacturing practices are thoroughly
22
Chapter 3
Project Methodology
3.1
Sample preparation
3.1.1 Composite formation
The composite formation takes place as:
Composite (g) = Filler (g) + Catalyst (g) + Resin (g)
For example,
Composite: 150 g
Filler: 15 g (10% of composite weight)
Catalyst: 2.7 g (2% by weight of ‘Resin + Catalyst’ weight, i.e. 135 g)
Resin: 132.3 g (‘Resin + Catalyst’ weight – Catalyst weight)
3.1.2 Preparation of the open mould
Before mixing of resin, catalyst and glass powder, it is crucial to prepare the mould. Once the mix
starts to cure, it starts losing its fluid nature and begins to solidify rapidly. Hence, a prepared mould
23
Figure 7: Mould cleaning.
Figure 8: Lubricant application.
Firstly the mould was scraped off thoroughly using a scrapper to make sure it was free from all
external debris from previous use. This aids specimen extraction after the curing has taken place
and ensures that the specimen does not contain foreign objects once it solidifies. After cleaning both
the upper and lower moulds, they were clamped together using screws and wing nuts. The mould
material is PVC and there were chances that cured specimens would get stuck to the surface. To
[image:32.595.141.456.321.526.2]24
3.1.3 Weighing the constituents
It is very important that all the constituent materials of the composite are measured accurately
before mixing so that the specimens conform to the standards. For example, the resin was measured
using an electronic measuring scale in a plastic container. The scale was calibrated to zero after
loading the container so that it measured the weight of the resin only. Similarly, the catalyst and
[image:33.595.172.424.279.470.2]glass powder was also measured and stored in separate containers ready to be mixed.
Figure 9: Weighing the glass powder.
[image:33.595.171.424.520.714.2]25
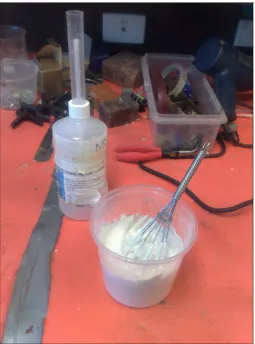
3.1.5 Mixing the constituents
As the mixing process of chemicals can emit toxic fumes, the process needs to be carried out under
the ventilator chamber of the laboratory. The ventilator captures the toxic fumes produced during
the reaction and safely disposes them into the external environment.
Firstly the glass powder was mixed with the resin gradually by slow stirring with a conventional
whisk. It should be observed that the mix is not whisked rapidly as that would allow air to be
trapped within the mixture and would reduce the structural integrity of the specimens. Next, the
weighted catalyst is added to the resin-glass powder mixture and the overall mixture was further
[image:34.595.171.426.328.672.2]mixed until homogenous slurry was obtained.
26
3.1.6 Pouring the mixture in the mould
Once the mixture was adequately homogenous, it was poured into the specimen slots of the mould
using a spoon. In order to obtain the correct thickness of the specimens, extra care was exercised so
that the slots were not over or under-filled. Under-filling the mould would mean the final specimens
would shrink to smaller than required dimensions, whereas over-filling would cause difficulty while
[image:35.595.140.456.261.503.2]trying to extract the specimens out of the moulds.
Figure 12: Mixture ready to be poured.
3.1.7 Natural curing
After casting the specimens, the moulds were left on the laboratory shelf for natural curing at room
temperature and standard pressure. Since the project aimed at preparing and testing 9 different sets
of specimens, it was made sure that the moulds were clearly identifiable and therefore proper
identifications were put on the moulds themselves. It was observed that the specimens took up to 48
27
Figure 13: Natural curing at room temperature.
3.1.8 Post curing
Post curing is a process where the specimens are baked in a conventional oven or microwave oven
in order to further harden and set the composites and to increase its mechanical properties. The post
curing was done as per the temperatures and durations as below:
4 hours at 50 °C;
4 hours at 80 °C;
28
[image:37.595.200.432.352.670.2]Figure 14: Curing oven
Figure 15: Samples arranged inside the oven.
29
evenly cure the specimens. On the flip side, they consume considerable amount of electricity.
Though post curing enhances mechanical characteristics of the specimens, heating them directly at
high temperature can increase brittleness in the specimens. Hence the heating was done gradually in
phases.
Due care was exercised during the heating process as it has been found in earlier experiments that
the specimens tend to deform during heating. To prevent this from happening, the bunch of
specimen is made and weights put at the ends during the heating. This kept the specimens straight
and uniform in shape.
3.1.9 Flexural property testing
The specimens are tested for flexural strength. This is done in the University of Southern
Queensland’s engineering faculty laboratory on a Universal Testing Machine (UTM). The UTM that
was available for use was an 810 Material Test System running TestStar 2S software.
The principle of the test is to test the specimen visualising it as a beam and deflecting it at a
constant rate until the specimen fractures or the deformation reaches a pre-determined value. The
force required to generate deflection is also measured.
The specimen can be three-point or four-point supported on the MTS. The MTS has a loading frame
at the top and a supporting frame at the bottom of the test setup. The loading frame has hydraulic
grips to hold the bending attachment that exerts force on the specimen during the test. Once the
specimen is placed on the supporting frame, the bending attachment is lowered as close to the
30
At the beginning of the test, the width, height and thickness of the specimen need to be measured
using digital slide callipers for dimensional accuracy. The specimens have to comply with the shape
and dimensions chalked out in Table 3 (for three-point flexure) under section 6.1.3 of the ISO
14125:1998(E) reference manual.
It is very important to get these values correct, as otherwise future results would turn out to be
erroneous. The width, height and thickness values are entered into the TestStar 2S software along
with the span and speed values. Upon entering these input parameters, the machine is ready to carry
out the test.
The test apparatus consists of a machine that complies with ISO 5893 and should be capable of
maintaining test speeds specified in section 5.1.2 of the ISO reference manual. Also, the load and
deflection indicators have to adhere to the section 5.1.4.
The results obtained by the tests are then used for analysis by software for calculation of flexural
strengths of the specimens.
3.2
Assessment of Significant Effects
The results obtained by this research may be used for analysis and may form the basis of future
research work. Hence, the safety and other ethical issues related to the technical tasks performed/
undertaken were also assessed.
The research has to encompass all facets of the Workplace Health and Safety Act, 1995 awareness
31
can be a source of injury as well. Codes of practice must be adhered to such that risks can be
minimized to humans and machinery. Other risks are the loss of data from the experiments due to
computer failures, etc. It is highly recommended to have periodical backups of all data obtained
through testing.
Risk assessment comprises of:
o Risk identification
o Risk evaluation
o Risk control
The reference material can be found by browsing the internet and also from some course books
from USQ, e.g. Engineering Management, Technology and Society, etc.
3.3
Safety issues and precautions
Resins
The vinyl ester resin is not highly toxic from ingestion, but is capable of causing significant eye and
skin effects. Because they contain relatively high amounts of styrene monomer, they also present a
health problem due to inhalation. However, they may be handled safely if proper precautions are
taken. These include, care to avoid inhalation of vapours and care to avoid skin and eye contact.
MEKP
32
the event of ingestion, large quantities of milk or water should be taken and medical help
needs to be sought immediately.
Contamination: Contaminated clothing must be discarded. If skin comes in contact with
MEKP, it must be washed with soap and water thoroughly.
Contact with eye: MEKP in the eye may result in permanent blindness, even if rinsed out
with water or saline solution. Eyes must immediately be flushed with water for at least 30
minutes. It becomes a very time critical event and medical assistance need to be sought as
soon as possible. Due to the potential dangers to human health that can be caused by this
catalyst, it is always recommended to wear goggles, gloves, protective clothing, and a
respirator.
Glass powders
The glass powder fillers used during this research as not toxic, but are very fine spherical hollow
beads. There is elevated risk of respiratory problems from inhalation of the powder and hence a
respiratory mask is always recommended during handling them.
Cured samples
Properly polymerized (cured) resins are considered to be toxicologically inert. Therefore, they do
not present health problems from handling. The finished resins, however, may present a health
33 Safe handling suggestions
Suitable PPE should be worn. Impervious clothing can increase the hazard if it becomes
contaminated on the inside. Suitable eye protection such as safety glasses or their equivalent should
be worn to avoid eye contact. Contact with the fume should be particularly prevented. Ventilation
34
Chapter 4
Results, Discussion & Observations
4.1
Results & Discussion
4.1.1 Flexural strength
The flexural strength of individual specimens was calculated using the formula stated in section
2.4.2.1. In order to calculate the flexural strength at a particular glass percentage, the mean flexural
strength of the specimens were calculated. In the same process, the mean flexural strength of all
different percentages of QCel 5020 glass powder was calculated and tabulated in the following
table:
Glass Percentage
10% 20% 30%
Specimen 1 24.912 18.414 12.91
Specimen 2 27.684 13.385 7.97
Specimen 3 31.99 17.756 8.139
Specimen 4 30.254 23.324 8.755
Specimen 5 31.025 20.596 0
Specimen 6 34.672 19.236 0
[image:43.595.155.444.391.658.2]Mean Flexural Strength (MPa) 30.089 18.785 9.443
Table 1: Flexural strengths for QCel 5020 specimens at different percentages.
35
visually demonstrate the flexural strength of the QCel 5020 glass composite at different filler ratio.
Graph 1: Flexural Strength vs. Glass Percentage (QCel 5020)
It is to be noted that at 30% QCel 5020 filler ratio by weight, the calculations has been done using
four (4) specimens only. At this ratio, the formations of specimens were very difficult as the amount
of filler was too high for the resin to bind.
Nevertheless, it is evident from the graph that, QCel 5020 displays the highest flexural strength of
30.09 MPa at 10% filler ratio. The flexural strength almost linearly decreases as the filler ratio
increases.
The flexural strength tables and graphs for QCel 6019 and Sphericel 60P18 are included in the
36
4.1.2 Flexural strain
In order to calculated flexural strain of the specimens of a particular type of glass powder
composite, the peak loads and maximum deflections during those loads need to be determined. The
flexural strain of all three (3) types of glass powder composites were determines, and the exemplary
process is as following:
Firstly, the peak loads experienced by the specimens were obtained from the UTS machine test
reports. The table below demonstrates the peak loads in newtons (N) at all percentages of QCel
5020 specimens.
Glass Percentage
10% 20% 30%
Specimen 1 77.212 87.283 36.927
Specimen 2 80.065 49.013 30.213
Specimen 3 110.782 70.498 26.185
Specimen 4 93.326 93.997 28.871
Specimen 5 91.983 57.07 0
Specimen 6 96.683 87.283 0
[image:45.595.169.428.368.627.2]Mean Peak Load (N) 91.675 74.19 30.549
Table 2: Peak loads for QCel 5020 specimens at different percentages.
Next, the maximum deflection exhibited by all the specimens of QCel 5020 are tabulated in the
37
Glass Percentage
10% 20% 30%
Specimen 1 13.53 9.61 9.76
Specimen 2 13.64 8.97 4.80
Specimen 3 14.29 10.92 4.91
Specimen 4 20.19 12.59 6.48
Specimen 5 18.78 14.47 0.00
Specimen 6 17.76 11.48 0.00
[image:46.595.139.456.61.322.2]Avg. Max Deflection (mm) 16.35 11.24 6.41
Table 3: Max deflections for QCel 5020 specimens at different percentages.
Once the maximum deflection values are obtained, the following formula is used for calculating the
flexural strain of the QCel 5020 specimens at 10%, 20% and 30%:
100
6
(%)
2
L
Dh
f
where,
εf= Flexural Strain (%)
D = Maximum deflection (mm)
h = Thickness of the specimen (mm)
38
Glass Percentage
10% 20% 30%
Specimen 1 1.764 1.593 1.272
Specimen 2 1.771 1.309 0.715
Specimen 3 1.999 1.647 0.676
Specimen 4 2.687 1.93 0.904
Specimen 5 2.462 1.84 0.00
Specimen 6 2.255 1.839 0.00
[image:47.595.128.469.487.715.2]Avg. Flexural Strain (%) 2.156 1.693 0.892
Table 4: Flexural strain for QCel 5020 specimens at different percentages.
The above mean flexural strain data was plotted on the graph below, which indicates that the QCel
5020 specimens with 10% glass powder had the highest strain, or in other words, had the highest
load bearing capability.
39
Similar tables and graphs for QCel 6019 and Sphericel 60P18 are can be found in Appendix D.
4.1.3 Flexural modulus
Another key prameter that was calculated from the bending test was the flexural modulus of the
specimens. The UTS machine automatically generates this data, which has been populated in the
following table:
Glass Percentage
10% 20% 30%
Specimen 1 1482.134 1202.9 828.146
Specimen 2 1530.132 902.493 789.501
Specimen 3 1724.197 1022.68 775.753
Specimen 4 1197.545 1248.56 800.737
Specimen 5 1260.069 1018.54 0.00
Specimen 6 1551.291 1144.74 0.00
[image:48.595.148.448.513.715.2]Mean Flexural Modulus (MPa) 1457.561 1089.99 798.534
Table 5: Flexural modulus for QCel 5020 specimens at different percentages.
The above table has been visually represented in the following graph:
40
4.2 Observations
From analysing the data, it is evident that the data between Sphericel 60P18 and QCel 5020 can be
compared for flexural strength, strain and modulus. QCel 6019 have been excluded from this
comparison as specimens for that type of glass could not be formed at 30% reinforcement weight
ratio. Also, all the aforementioned properties of QCel 5020 and QCel 6019 are quite close (Graph 7,
8 and 9), hence comparing Sphericel 60P18 with QCel 5020 should help reach a conclusion.
Graph 4: Flexural Strength comparison.
The analysis suggests that Sphericel 60P18 at 10% filler ratio by weight of the whole specimen
posesses higher flexural strength (Graph 4), flexural strain (Graph 5) and flexural modulus (Graph
6) properties. For example, the flexural strength at 10% filler weight, Sphericel 60P18 displays an
41
MPa, which is almost half (54%) of that of Sphericel 60P18.
Graph 5: Flexural Strain comparison.
Similarly, the average flexural strain ratio for Sphericel 60P18 is also higher than that of QCel 5020
by 7.8%. This higher average flexural strain is observed upto 20% filler ratio, at which point the
average flexural strain of Sphericel 60P18 is 18.4% higher than that of QCel 5020.
This trend starts changing after about 20% filler weight, at which the Sphericel 60P18’s average
flexural strain sharply declines and reduces by 9.8% when the filler weight becomes 30% of the
composite weight. To be noted, the average flexural strain of QCel 5020 does not display any abrupt
decline as Sphericel 60P18, but it also almost linearly reduces to 0.98%.
42
60P18 may start experiencing lower than expected strain, which would increase the flexural
modulus at those filler weights.
Graph 6: Flexural Modulus comparison.
The graph above supports the observation made in the proceeding setion, as the average flexural
modulus for Sphericel 60P18 has increased by about 7.8%, whereas the average flexural modulus
for QCel 5020 linearly decreased as expected.
Also, it needs to be restated that the QCel 6019 specimens could not be formed beyond the filler
percentage of 25%, and hence was not deemed appropriate for inclusion in the above analyses.
Nevertheless, the following graphs provided indicated that QCel 5020 and QCel 6019 shared
43
Graph 7: Flexural Strength comparison between QCel 6019 and QCel 5020.
44
Graph 9: Flexural Modulus comparison between QCel 6019 and QCel 5020.
By analysing the aforementiond three graphs, it is quite justified to deduce that the flexural
properties of QCel 5020 and QCel 6019 are similar, if not the same, but comparing Sphericel 60P18
to QCel 5020 would be a reasonable analysis for obtaining sound results.
4.2.1 SEM observations
The following SEM images for Sphericel 60P18 at 10% weight (which possesses the highest
flexural strength) of the filler indicate that, the amount of porosity in the specimen was quite low
due to the avaiablility of VE resin matrix, which in turn suggests that the specimen cured properly
45
Figure 16: SEM image of composite for Sphericel 60P18 at 10% weight ratio
(20 times magnification).
Figure 17: SEM image of composite for Sphericel 60P18 at 10% weight ratio
(200 times magnification). Glass spheres
VE Resin Matrix
Porosity Broken glass spheres
[image:54.595.142.454.407.700.2]46
Figure 18: SEM image of composite for Sphericel 60P18 at 10% weight ratio
(500 times magnification).
On the other hand, as the glass percentage increased, the flexural strength started to decline. A
prime example of low flexural strength specimen is that of QCel 5020 at 30% weight, where the
specimen did not have as much VE resin matrix aviable and was quite porous due to higher mean
particle size.
From the figures 19, 20 and 21, it can be clearly observed that the proportion of glass spheres are
very high and there is very little room for the VE matrix to wrap around the individual spheres. This
would have caused the strength of the material to sustantially decrease, as the flexural load would
easily transfer to the surface of the hollow spheres and cause stress concentrations. As a result, the
spheres would crack once their limit of stress is overcome by the flexural load. Also, at higher glass
47
Figure 19: SEM image of composite for QCel 5020 at 10% weight ratio
(20 times magnification).
Figure 20: SEM image of composite for QCel 5020 at 10% weight ratio
(200 times magnification).
[image:56.595.142.454.411.700.2]48
Figure 21: SEM image of composite for QCel 5020 at 10% weight ratio
49
Chapter 5
Conclusion
This research was conducted to compare the flexural strength (and also flexural strain and modulus
as related properties) for Sphericel 60P18, QCel 5020 and QCel 6019 glass powders, and for all
types of glass, the composite slurry could not be obtained (i.e. QCel 6019 at 30% filler weight).
Still, it was also demonstrated that QCel 5020 and QCel 6019 composites display similar flexural
properties with QCel 6019 being slighltly higher in mean farticle size, flexural strength, strain and
modulus values. The conclusion that Sphericel 60P18 at 10% filler weight would demonstrate
superior flexural strength and other associated flexural properties among all three (3) types of glass
powder would have to be confined to at most 25% filler weight of the composite specimen.
Much experimental information on these three types of glass powder reinforced composites on a
comparative level was not available for cross comparison, and hence there is further scope for
research on using other resins, catalysts and inclusion of other reinforcement particles along with
these reinforcements and at other filler percentages.
The cost justification analysis can be carried out on these composites in order to measure the
commercial viability of the whole exercise. Nonetheless, in the event of commercialisation, the
research results indicate Sphericel 60P18 at lower filler weight ratio to be a more suitable candidate
50
References
3Dchem.com. (2007). MEKP @ 3Dchem.com. Available:
http://www.3dchem.com/moremolecules.asp?ID=313&othername=MEKP. Last accessed 2 October
2009.
Askeland, D R, The Science and Engineering of Materials, Third Edition, Stanley Thornes.
Callister, W D, Material Science and Engineering: An Introduction, 7th Edition, Wiley International, 2006, pg. 447-449.
Evans, Alexander, San Marchi, Christopher, Mortensen, Andreas, Metal matrix composites in industry: an introduction and a survey. 1st edition, Springer 2003, pg 392.
ISO, ISO 14125:1998(E), Fibre reinforced plastic composites — Determination of flexural properties,
1998, International Organization for Standardization, Geneve, Austria.
Jenkins, C H, Editor, Manual on Experimental Methods for Mechanical Testing of Composites, Second Edition, The Fairmont Press, 1998.
Kopeliovich, Dr. Dmitri. (2009). Polymer Matrix Composites (introduction). Available: http://www.substech.com/dokuwiki/doku.php?id=polymer_matrix_composites_introduction. Last
accessed 14 September 2009.
Ku, H, Trada, N and Samchuk, M, Flexural Strength of SLG Reinforced Phenol Formaldehyde Composites post-cured in Microwaves, Key Engineering Materials, 2009.
Metal matrix composite. Available: http://en.wikipedia.org/wiki/Metal_matrix_composite. Last accessed 12 October 2009.
51
Potters Industries, undated, http://www.pottersbeads.com/markets/polySphericel.asp <viewed on
27 August 2009>
Potters Industries, undated, http://www.pottersbeads.com/markets/polycomposites.asp<viewed
on 27 August 2009>
Potters Industries, undated, Material Safety Data Sheet for SPHERICELO Hollow Spheres, pp. 1-4
<viewed on 27 August 2009>.
Shackelford, J F, Introduction to Material Science for Engineers, 3rd Edition, Macmillan, 1992.
Shekhar, Shashi, Tensile strength of sawdust reinforced phenolic resin composite materials, University of Southern Queensland, 2008.
Schaffer, J.P., Saxena, A., Antolovich, S.D., Sanders, Jr., T.H. and Warner, S.B., The Science and Design of Engineering Materials, IRWIN [now McGraw-Hill], Chicago. Retrieved from: http://www.engr.sjsu.edu/WofMatE/Composites.htm. <viewed on 2 October 2009>.
Strong, A. Brent, Fundamentals of Composites Manufacturing: Materials, Methods and Applications, SME, 2008.
Stenzel, Deb, Lecture 6: The Scanning Electron Microscope, Queensland University of Technology, Brisbane, 2009.
Swallowe, G M, Mechanical Properties and Testing of Polymers, Vol. 3, Kluwer, 1999.
Sweet Composites. (2008). Methyl Ethyl Ketone Peroxide. Available:
52
53
University of Southern Queensland
Faculty of Engineering and Surveying
ENG 4111/4112 Research Project
PROJECT SPECIFICATION
Project title: Flexural strength of three types of glass powder reinforced
Vinyl Ester composites.
Student: Rezwanul Huq - 005 002 4547
Supervisor: Dr. Harry Ku
Co-Supervisor:
Sponsorship: Faculty of Engineering & Surveying
University of Southern Queensland
Project Synopsis:
This project aims at analysing 3 (three) different types of glass powder (namely - Q cell 5020, Q
cell 6091 and Sphericel 60P18) and their behaviour as filler substance of composites. Filler usage
reduces the cost of composites and modifies their structural properties significantly, which is a
critical factor in engineering applications. Hence, curing, post-curing and flexural testing would be
carried out sequentially on a range of VE resin specimens to evaluate their flexural properties.
Further in depth analysis of the findings would be carried out to determine behaviour trends and
formulas suitable for theoretical prediction of the filled polymer behaviour.
Timeline:
1. Literature reviews with reinforced phenolic composites.
Begin : 16th March 2009
Completion : 10th April 2009
Approx. Hours : 60 hours
2. Determine and design processes (parameters) for testing.
54
Completion : 16th April 2009
Approx. Hours : 20 hours
3. Testing Methods and examination of specimens.
Begin : 21st April 2009
Completion : 30th May 2009
Approx. Hours : 80 hours
4. Analysis of results.
Begin : 2nd June 2009
Completion : 27th June 2009
Approx. Hours : 50 hours
5. Draw up conclusions.
Begin : 21st July 2009
Completion : 8th August 2009
Approx. Hours : 40 hours
6. Discussion for the thesis outline with supervisors.
Begin : 11th August 2009
Completion : 22nd August 2009
Approx. Hours : 10 hours
7. Thesis initial drafting – each chapter in draft form and shown to supervisors.
Begin : 25th August 2009
Completion : 26th September 2009
Approx. Hours : 60 hours
8. Final draft of thesis, to incorporate modifications suggested by supervisor.
Begin : 29th September 2009
Completion : 10th October 2009
55
9. Complete the thesis in requested format.
Begin : 13th October 2009
Completion : 28th October 2009
Approx. Hours : 20 hours
AGREED:
______________________ (student) __________________ (Supervisor)
56
Appendix B: Composite formation datasheet
Glass type: QCel 5020
Glass percentage: 10%
Composite (g) Glass Powder (g) Vinyl Ester Resin + MEKP (g) Vinyl Ester Resin (g) MEKP (g)
150 15 135 132.3 2.7
Glass percentage: 20%
Composite (g) Glass Powder (g) Vinyl Ester Resin + MEKP (g) Vinyl Ester Resin (g) MEKP (g)
150 30 120 117.6 2.4
Glass percentage: 30%
Composite (g) Glass Powder (g) Vinyl Ester Resin + LA (g) Vinyl Ester Resin (g) LA (g)
57 Glass type: QCel 6019
Glass percentage: 10%
Composite (g) Glass Powder (g) Vinyl Ester Resin + LA (g) Vinyl Ester Resin (g) LA (g)
150 15 135 132..97 2.03
Glass percentage: 20%
Composite (g) Glass Powder (g) Vinyl Ester Resin + LA (g) Vinyl Ester Resin (g) LA (g)
150 30 120 118.2 1.8
Glass percentage: 25%
Composite (g) Glass Powder (g) Vinyl Ester Resin + LA (g) Vinyl Ester Resin (g) LA (g)
58 Glass type: Sphericel 60P18
Glass percentage: 10%
Composite (g) Glass Powder (g) Vinyl Ester Resin + MEKP (g) Vinyl Ester Resin (g) MEKP (g)
150 15 135 132.3 2.7
Glass percentage: 20%
Composite (g) Glass Powder (g) Vinyl Ester Resin + MEKP (g) Vinyl Ester Resin (g) MEKP (g)
150 30 120 117.6 2.4
Glass percentage: 30%
Composite (g) Glass Powder (g) Vinyl Ester Resin + MEKP (g) Vinyl Ester Resin (g) MEKP (g)
59
Appendix C: UTS Data and Plots
3/09/2009
Sample ID: 60P18-10%-6.mss Test Date: 3/09/2009
Method: MMT - Flexural Test (ISO 14125).msm Operator: Mohan Trada
Specimen Results:
Specimen # Width mm Thickness mm Modulus MPa Peak Load N UTS MPa
Load At Break N
Stress At Break MPa
1 9.69 5.14 2669.216 154.927 58.1 149.388 56.019
2 9.65 5.23 2492.492 101.886 37.1 100.711 36.628
3 9.64 5.57 2912.739 172.887 55.5 172.887 55.494
4 9.85 5.63 3079.13 190.847 58.7 184.973 56.876
5 9.95 5.67 2878.364 204.108 61.3 201.422 60.449
6 9.75 5.88 3180.674 243.049 69.2 241.707 68.834
Mean 9.755 5.520 2868.769 177.951 56.6 175.181 55.717
Std. Dev. 0.123 0.281 254.938 47.812 10.7 47.805 10.586
Specimen # Strain at Break %
1 2.171
2 1.911
3 2.219
4 1.913
5 1.501
6 2.287
Mean 2.000
60 Calculation Inputs:
Name Value Units
Break Marker Drop 6.0 %
Break Marker Elongation 0.010 mm
Slack Pre-Load 4.448 N
Slope Segment Length 5.000 %
Span 64.000 mm
Strain Point 1 0.05 %
Strain Point 2 0.250 %
Strain Point 3 0.020 mm/mm
Yield Angle 0.000 rad
Yield Offset 0.002 mm/mm
Yield Segment Length 2.0 %
Test Inputs:
Name Value Units
Break Sensitivity 80 %
Break Threshold 40.000 N
DataAcqRate 5.0 Hz
Extension Endpoint 25.400 mm
Initial Speed 1.0 mm/min
Load Endpoint 4448 N
Outer Loop Rate 100 Hz
Secondary Speed 1.000 mm/min
61
0 20 40 60 80 100 120 140 160 180 200 220 240 260
0.0 1.0 2.0 3.0
Load (N)
Extension (mm)
62 8/09/2009
Sample ID: 60P18-20%-6.mss Test Date: 8/09/2009
Method: MMT - Flexural Test (ISO 14125).msm Operator: Mohan Trada
Specimen Results:
Specimen # Width mm Thickness mm Modulus MPa Peak Load N UTS MPa
Load At Break N
Stress At Break MPa
1 9.64 5.28 2948.798 127.567 45.6 126.225 45.089
2 9.7 5.44 2490.369 110.782 37 108.936 36.431
3 9.78 5.5 2869.701 102.725 33.3 102.725 33.334
4 9.72 5.61 2479.943 116.153 36.5 110.782 34.766
5 9.76 5.61 3041.571 124.042 38.8 120.853 37.771
6 9.69 6.02 2719.032 179.937 49.2 175.237 47.905
Mean 9.715 5.577 2758.236 126.868 40.1 124.126 39.216
Std. Dev. 0.050 0.250 236.539 27.500 6.0 26.436 5.903
Specimen # Strain at Break %
1 1.409
2 1.279
3 1.126
4 1.813
5 1.549
6 1.401
Mean 1.430
63 Calculation Inputs:
Name Value Units
Break Marker Drop 6.0 %
Break Marker Elongation 0.010 mm
Slack Pre-Load 4.448 N
Slope Segment Length 5.000 %
Span 64.000 mm
Strain Point 1 0.05 %
Strain Point 2 0.250 %
Strain Point 3 0.020 mm/mm
Yield Angle 0.000 rad
Yield Offset 0.002 mm/mm
Yield Segment Length 2.0 %
Test Inputs:
Name Value Units
Break Sensitivity 80 %
Break Threshold 40.000 N
DataAcqRate 5.0 Hz
Extension Endpoint 25.400 mm
Initial Speed 1.0 mm/min
Load Endpoint 4448 N
Outer Loop Rate 100 Hz
Secondary Speed 1.000 mm/min
64
0 20 40 60 80 100 120 140 160 180
0.0 0.2 0.4 0.6 0.8 1.0 1.2 1.4 1.6 1.8 2.0 2.2
Load (N)
Extension (mm)
65 8/09/2009
Sample ID: 60P18-30%-6.mss Test Date: 8/09/2009
Method: MMT - Flexural Test (ISO 14125).msm Operator: Mohan Trada
Specimen Results:
Specimen # Width mm Thickness mm Modulus MPa Peak Load N UTS MPa
Load At Break N
Stress At Break MPa
1 9.870 5.690 3212.111 117.496 35.3 114.139 34.290
2 9.860 5.560 2194.232 73.855 23.3 73.855 23.261
3 9.810 5.950 3530.041 122.196 33.8 120.853 33.406
4 10.050 5.690 2996.396 106.418 31.4 105.579 31.150
5 10.120 6.090 3125.777 104.068 26.6 104.068 26.618
6 10.060 5.500 2791.914 93.997 29.7 93.997 29.653
Mean 9.962 5.747 2975.079 103.005 30.0 102.082 29.730
Std. Dev. 0.130 0.229 454.005 17.447 4.5 16.589 4.192
Specimen # Strain at Break %
1 1.087
2 0.940
3 0.949
4 1.002
5 0.840
6 1.064
Mean 0.980
66 Calculation Inputs:
Name Value Units
Break Marker Drop 6.0 %
Break Marker Elongation 0.010 mm
Slack Pre-Load 4.448 N
Slope Segment Length 5.000 %
Span 64.000 mm
Strain Point 1 0.05 %
Strain Point 2 0.250 %
Strain Point 3 0.020 mm/mm
Yield Angle 0.000 rad
Yield Offset 0.002 mm/mm
Yield Segment Length 2.0 %
Test Inputs:
Name Value Units
Break Sensitivity 80 %
Break Threshold 40.000 N
DataAcqRate 5.0 Hz
Extension Endpoint 25.400 mm
Initial Speed 1.0 mm/min
Load Endpoint 4448 N
Outer Loop Rate 100 Hz
Secondary Speed 1.000 mm/min
67
0 10 20 30 40 50 60 70 80 90 100 110 120 130
0.0 0.1 0.2 0.3 0.4 0.5 0.6 0.7 0.8 0.9 1.0 1.1 1.2 1.3 1.4 Load (N)
Extension (mm)
68 3/09/2009
Sample ID: 6019-10%-6.mss Test Date: 3/09/2009
Method: MMT - Flexural Test (ISO 14125).msm Operator: Mohan Trada
Specimen Results:
Specimen # Width
mm Thickness mm Modulus MPa Peak Load N UTS MPa
Load At Break
N
Stress At Break
MPa
1 9.950 5.470 1705.445 97.186 31.3 97.186 31.338
2 9.820 5.440 1536.702 97.354 32.2 93.997 31.051
3 9.700 5.470 1747.773 99.368 32.9 97.3