A COMPARATIVE STUDY ON THE EFFECTIVENESS OF DFMC CHART VERSUS CARDIFF COUNT TEN CHART IN RELATION TO MATERNAL COMPLIANCE AND
MOTHERS PERCEPTION ON SELF ASSESSMENT OF FOETAL WELLBEING
By ASHNA JOSE
A Dissertation submitted to The Tamil Nadu Dr.M.G.R. Medical University, Chennai, in partial fulfillment for the requirement of the degree of
Master of Science in Nursing
2016
A COMPARATIVE STUDY ON THE EFFECTIVENESS OF DFMC CHART VERSUS CARDIFF COUNT TEN CHART IN RELATION TO MATERNAL COMPLIANCE AND
MOTHERS PERCEPTION ON SELF ASSESSMENT OF FOETAL WELLBEING
Approved by the Dissertation Committee on: 13.11.2014
Proposal Presentation on:11.12.2015
1. ________________________________ SUBJECT GUIDE
PROF. SREERENJINI .B, M.Sc (N)., Professor,
Department of Obstetrics and Gynaecological Nursing, PSG College of Nursing,
Peelamedu,
Coimbatore-641 004.
2. _________________________________ RESEARCH GUIDE
DR. G. MALARVIZHI, M.Sc(N), Ph.D., Vice Principal
Professor and Head,
Child Health Nursing Department , PSG College of Nursing,
Peelamedu,
Coimbatore-641 004.
3. _________________________________
PROF. DR. SEETHA PANICKER, D.G.O, MD, DNB., Head of the Department of Obsteretics and Gynaecology, PSG Hospitals,
Coimbatore-641 004.
A Dissertation submitted to The Tamil Nadu Dr.M.G.R. Medical University,
Chennai, in partial fulfillment for the requirement of the degree of
Branch III Obstetrics and Gynecological Nursing 2016
CERTIFICATE
Certified that A COMPARATIVE STUDY ON THE EFFECTIVENESS OF DFMC CHART VERSUS CARDIFF COUNT TEN CHART IN RELATION TO MATERNAL COMPLIANCE AND MOTHERS PERCEPTION ON SELF ASSESSMENT OF FOETAL WELLBEING this is a bonafide work of ASHNA JOSE, PSG College of Nursing, Coimbatore, and submitted in partial fulfillment of requirement for the Degree of Master of Science in Nursing to The Tamil Nadu Dr. M. G. R Medical University, Chennai.
Dr. Elizabeth Jean Abraham, M.Sc (N), Ph.D., Principal,
PSG College of Nursing, Peelamedu,
Coimbatore-641004.
PSG COLLEGE OF NURSING COIMBATORE
ACKNOWLEDGEMENT
My heartfelt praises to God Almighty for the enriched blessings and abundant grace and mercy which enriched me through every step of this work and convert this work into reality and without whom it would not have been possible. Through him, I dedicated my work to the most influential and ever motivating spirit, My Grand Father, Mr. Ithack.
I have been fortunate in having received the cooperation and guidance of many people in completing this research. I consider it a privilege to acknowledge here the help and guidance extended by each one of them.
I submit my sincere thanks and respect to our Managing Trustee for all the facilities which had been provided to us at the institution.
I express my deep sense of gratitude to our beloved Principal, Dr. Elizabeth Jean Abraham M.Sc. (N), Ph.D., PSG College of Nursing. The words of appreciation and encouraging support that Principal has bestowed on me, kindled my spirit and enthusiasm to go ahead and accomplish this study successfully.
I express my sincere gratitude to my research guide Dr. G. Malarvizhi, M.Sc. (N)., Ph.D., Vice Principal, HOD of Child Health Department, PSG College of Nursing for unwavering encouragement, invariable help, insisting support, timely correction and scholarly guidance in each and every step of this study which could make the study possible and purposeful.
I wish to extend my whole hearted thanks to my subject guide Prof. Sreerenjini B, M.Sc. (N) Professor, Obstetrics and Gynaecological Nursing Department, PSG College of Nursing. Thank you madam for your dexterous, constructive and critical guidance, logistic support, valuable suggestions, affectionate and enduring support, timely motivation and above all the patience extended for clarifying my doubts and for the enthusiastic words which kept me on track towards the successful completion of my study.
I am extremely thankful to Prof.Baby, HOD, Obstetrics and Gynaecological Nursing Department, for their keen interest, constant encouragement and enduring support throughout the study.
I proudly and honestly express my grateful thanks to all Faculty Members of Obstetrical and Gynaecological Nursing Department, PSG College of Nursing for their valuable suggestion and support.
I extend my gratitude towards Mr.Subramaniam, statistician for this valuable corrections and kindness which helped me in doing my data analysis.
I express my sincere thanks to the Ethical Committee of PSG institution for their valuable suggestions and approval for the study being conducted.
I extend my whole-hearted thanks to OG OPD Staff Nurses, Nursing Assistants, Library Staffs and All Non-teaching staff members for rendering all the facilities and kindly approach during the time of stud
I honestly express my grateful thanks to my friends, for his continued and unfailing encouragement and emotional support in both good and bad times throughout my study.
I extend my heartful unexplainable thanks to my beloved parents, Mr.P.P. Jose, Mrs. Binny Jose and My brother Mr. Amal Jose and family members who are the source of strength, encouragement, inspiration in every step of my life.
My heartfelt gratitude goes to all the members of my congregation in Kerala.
My sincere thanks and appreciation for Mr. Mohan Kumar of cool blue for his patience, diligence in the final typing, alignment, editing and organization of the manuscripts and his excellent work towards the final bound copy of the thesis.
LIST OF CONTENTS
CHAPTERS TITLE PAGE NO.
ABSTRACT
CHAPTER I INTRODUCTION 1
1.1 Background of the study 1
1.2 Need for the study 3
1.3 Statement of the problem 7
1.4 Objectives 7
1.5 Assumption 8
1.6 Hypothesis 8
1.7 Delimitations 8
1.8 Operational definition 8
1.9 Conceptual framework 9
1.10 Projected outcome 11
CHAPTER II REVIEW OF LITERATURE 13
2.1
Literatures related to importance of DFMC chart. 13 2.2 Literatures related to importance of Cardiff count ten
chart.
17
2.3
Literature related to the comparison of DFMC chart and Cardiff count ten chart.
21
CHAPTER III MATERIALS AND METHOD 24
3.1 Research approach and design 24
3.2 Variables of the study 25
3.3 Setting of the study 25
3.4 Population and sampling 25
3.5 Instruments and tool for data collection 26
3.6 Ethical approval 28
3.7 Report of pilot study 29
3.8 Data Analysis Plan 29
CHAPTER IV DATA ANALYSIS AND INTERPRETATION 31
4.1 Demographic and Obstetrical variables of antenatal mothers
32
4.2 Frequency and percentage distribution of mother’s perception and maternal compliance towards DFMC chart and Cardiff count ten charts
37
4.3 Comparison of mother’s perception and maternal compliance towards DFMC chart and Cardiff count ten
charts
4.4 Correlation between mother’s perception and maternal compliance towards DFMC chart and Cardiff count ten charts
42
4.5 Association of maternal compliance with their selected demographic variables in mothers using DFMC chart and Cardiff Count Ten chart
43
CHAPTER V RESULTS AND DISCUSSON 47
5.1 Obstetrical variables of antenatal mothers towards DFMC chart and Cardiff count ten chart.
47
5.2 Assessment of maternal compliance among mothers
towards DFMC chart and Cardiff count ten chart.
47
5.3 Assessment of mothers perception mothers towards DFMC chart and Cardiff count ten chart.
48
5.4 Comparison of mothers perception towards Cardiff count ten chart and DFMC chart
48
5.5 Comparison of maternal compliance among mothers towards Cardiff count ten chart and DFMC chart.
48
5.6 Correlation between the mothers perception and maternal compliance towards DFMC chart and Cardiff count ten chart
49
CHAPTER VI SUMMARY AND CONCLUSION 50
6.1 Major findings of the study 50
6.2 Conclusion 51
6.3 Nursing Implication 51
6.4 Limitation 52
6.5 Recommendation for further study 52
BIBLIOGRAPHY 53
LIST OF TABLES
TABLES TITLE PAGE NO
4.1 Demographic variables of antenatal mothers 32
4.2 Obstetrical variables of antenatal mothers 34
4.3 Frequency of mother’s perception regarding DFMC chart and Cardiff count ten chart.
37
4.4 Frequency and percentage distribution of level of mother’s perception towards Cardiff Count Ten Chart and DFMC Chart
39
4.5 Frequency and percentage distribution of level of maternal compliance among mothers towards Cardiff Count Ten Chart
40
4.6 Comparison of maternal compliance among mothers towards Cardiff Count Ten Chart and DFMC Chart
41
4.7 Comparison of mothers perception towards Cardiff Count Ten Chart and DFMC Chart
41
4.8 Correlation between mother’s perception and maternal compliance among mothers towards Cardiff count 10 chart
42
4.9 Correlation between mothers perception and maternal compliance among mothers towards DFMC Chart
42
4.10 Association of maternal compliance among mothers towards DFMC Chart with their selected demographic variables using Chi-square test.
43
4.11 Association of maternal compliance among mothers towards Cardiff Count ten chart and their selected demographic variables using Chi-square test
45
LIST OF FIGURES
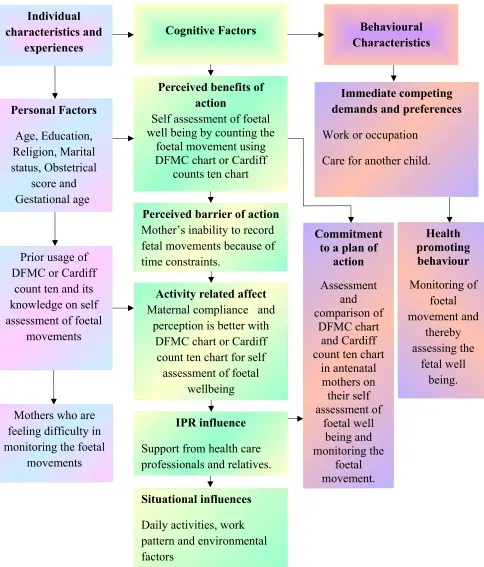
1.1 Conceptual framework: Modified Pender’s health promotion model to assess the effectiveness of DFMC chart versus Cardiff count ten chart in relation to maternal compliance and mothers perception on self assessment of foetal wellbeing.
12
3.1 Flow chart showing the techniques of data collection 27 4.1 Bar diagram showing the percentage distribution of antenatal
mothers according to pregnancy category
36
4.2 Bar diagram showing the percentage distribution of mother’s previous knowledge about the foetal movement monitoring
36
4.3 Bar diagram showing the percentage distribution of antenatal mothers according to the level of perception
39
4.4 Bar diagram showing the percentage distribution of antenatal mothers according to the level of maternal compliance
LIST OF ANNEXURES
ANNEXURE TITLE PAGE NO.
I Permission letter 57
II Institutional Human Ethics Committee Letter 58
III Consent form 60
IV Tool 64
LIST OF ABBREVATIONS
Sl. No Abbreviations
1 DFMC Daily Fetal Movement Count
2 MOMS Maternal Observation and Memories of Stillbirth 3 FEMINA Foetal Movement Intervention Assessment
4 RFM Reduced Foetal Movement
5 CTG Cardiotocogram
6 PMR Perinatal Mortality Rate
7 DFM Decreased Foetal Movement
8 NST Non Stress Test
9 APGAR Appearance, Pulse, Gremaice, Activity, Respiration 10 CLAP Latin American Center for Perinatology
11 IMR Indian Mortality Rate
12 SRS Sample Registration System
13 NFHS National Family Health Survey
14 DOH Department of Health
15 RR Relative Risk
16 CI Confidence Interval
17 OPD Out Patient Department
18 SD Standard Deviation
19 f Frequency
20 S Significant
21 NS Not significant
22 LMP Last Menstrual Period
ABSTRACT
A comparative study on the effectiveness of DFMC chart versus Cardiff count ten chart in relation to maternal compliance and mothers perception on self assessment of foetal wellbeing
Pregnancy is considered as a very precious event in every women`s life. Foetal movement counting is a method in which a woman quantifies the movements of her baby. The purpose is to reduce perinatal mortality by alerting care givers when the baby might have become compromised. Yet for every 1000 birth the perinatal mortality is 37.7, varies from 24.8 in Kerala to 75.5/1000 in Orissa. It is higher in rural (54.4) and lower in urban and in Tamilnadu 37.9/1000. In India alone about 8,90,000 perinatal deaths occur annually.
Objectives of the study: 1) To assess the maternal compliance towards Cardiff count ten chart and DFMC chart. 2) To assess the mother’s perception about Cardiff count ten chart and DFMC chart. 3) To compare the effectiveness of DFMC chart versus Cardiff count ten chart in relation to maternal compliance and mothers perception. 4) To find out the correlation between the maternal compliance and maternal perception towards DFMC chart and Cardiff count ten chart. 5) To find out the association between the selected demographic variables and maternal compliance to DFMC chart and Cardiff count ten chart.
Research Methodology: The research design adopted for this study was post test only design with comparison group. Non probability convenient sampling techniques were used. The study was conducted in PSG hospitals, Coimbatore. Desired samples of 40 were selected. DFMC chart was given to one group. The mother was used to record the number of fetal movements in the chart one hour after food at the morning, afternoon and evening. Cardiff count ten chart was given to another group, to assess the fetal movements for 12 hours in a day, from 9am to 9pm. During their next visit, perception was assessed.
Major Findings of the Study: Among the 40 antenatal mothers 6(30%) had non compliance and 14(70%) had compliance towards DFMC chart and in Cardiff count ten chart non compliance is 9(45%) and compliance is 11(55%). There is no significant difference in mother’s perception between Cardiff count ten chart and DFMC chart t=(0.221, p<0.05). There is a significant difference in maternal compliance between Cardiff count ten chart and DFMC chart t= (9.123, p<0.05). There is no correlation between maternal compliance and perception towards Cardiff count ten chart and DFMC chart r=(0.118, 0.015) p<0.05. There is no association between age, methods to monitor the foetal movements, knowledge about fetal movement counting in DFMC chart, and age, educational status, pregnancy category in Cardiff count ten chart.
Conclusion: In this study, two main protocols are used to assess the foetal wellbeing are Cardiff count ten chart and DFMC chart. The past researchers have shown that maternal monitoring of foetal movements can lead to lower incidence of stillbirth. While comparing the DFMC chart and Cardiff count ten chart there is an effectiveness of using DFMC chart for the self assessment of fetal wellbeing by antenatal mother in relation to maternal compliance.
CHAPTER-I
INTRODUCTION
1.1 Background of the Study:
Pregnancy is considered as a very precious event in every women`s life. It is filled with happiness, joy and surprises. Every parents hopes for a healthy baby, but may sometimes become sorrowful when danger sets in either to the mother or to the foetus. Pregnancy links mother and foetus together and is the basis for regeneration and the generation. In high risk pregnancies the mother may sometimes escape death but foetus and neonates often become the victim. (Nitanjali Patel, 2013)
During the past decades there has been significant improvement in obstetrics in achieving the antenatal surveillance of high risk pregnancy. Since above 75 percent of foetal death occur in the ante partum it is oblivious that limiting foetal surveillance to intrapartum period will not achieve optimal perinatal outcome. To be clinically useful ante partum test should be readily available, easy to perform, consistently reproducible, cost effective, easy to interpret and reliable, so that appropriate intervention can be undertaken when necessary. Assessing of foetal well being by monitoring foetal movement count by antenatal mothers fulfils all the above criteria. Process of birth is the most dangerous journey an individual undertakes. A healthy new born is the goal of every expectant mother and her physician. Yet for every 10000 births the perinatal mortality is 37.7, varies from 24.8 in Kerala to 75.5/10,000 in Orissa. It is higher in rural (54.4) and lower in urban and in Tamilnadu 37.9/10,000. It is estimated that 7.3 million perinatal deaths occur annually in the world and most of these in the developing countries. In India alone about 8,90,000 perinatal deaths occur annually.
Under-5 mortality from 126 in 1990 to 52 in 2012, which is higher than the global decline.Neo-natal deaths account for 56 per cent of Under-5 deaths in India which is much higher than the global average of 44 per cent. The progress in reduction of neo-natal mortality has been slow. In fact, four states- Uttar Pradesh, Bihar, Madhya Pradesh and Rajasthan account for half of the deaths in India. Assam with 75 per 1,000 live births tops the chart among states having Under-5 mortality above the national average of 52, followed by Madhya Pradesh (73), Odisha (68), UP (68), Rajasthan (59), Bihar (57) and Chhattisgarh (55), he said. However, as per SRS report, Andhra Pradesh has shown 17 per cent decline in between 2009 and 2012 and Rajasthan has shown 20 per cent decline during the same period. In India every year, 1.34 million children die before completing five years, of which 7,48,000 die within the first month of their life. In order to achieve a reduction in the Under-5 deaths, should focus on reducing neonatal deaths, which account for 56 per cent of total such deaths, by integrating quality maternal care with newborn care. (Dr Gagan Gupta.2015).
The foetal heart beat was first thought to be heard in utero in the middle of the seventeenth or eighteenth century, but it was not until the early nineteenth century. It is suggested that listening to the foetal heartbeat might be clinically useful. It proposed that it could be used to diagnose foetal life and multiple pregnancies, and to assess foetal compromise from variations in the foetal heart rate. Since, various methods of listening to the foetal heart rate have been developed and introduced into maternity care, each with the aim of improving outcomes for babies and reducing the headache for mothers and families when a baby dies or suffers long term disability. Today, monitoring the foetal heart during labour, by one method or another, appears to have become a routine part in antenatal care. (Suraj Gupta, 2009)
monitor the movements of her unborn baby by counting the number of kicks in a given time period. This is an indicator of foetal health and has been used for over a century. (Marzano & Hanlon-Lundberg, 2004).
At 7 weeks of gestation the title embryo is already squirming about, but because at this point it is so small and the mother cannot possibly feels its periodic contractions. By week 16 the mother may feel the first momentous kicks called ‘quickening’. By 20th week of the gestation most mothers are able to feel the baby’s movements and by week 28 the kicks will become stronger and regular. (Nolte, 1998)
Over the years, maternal perception of foetal movement has become recognized as a valuable tool for early detection of foetal compromise. The recording of foetal activity serves as an indirect measure of central nervous system integrity and function (Rayburn, 1995), indicating that foetal movements are a reliable sign of foetal well-being (Bennet & Brown, 1999). In study on excessive foetal activity as a worrisome sign. Rayburn, Rayburn and Gabel (1983) further clarified that foetal inactivity is strongly suggestive of foetal jeopardy. A change in the normal pattern or number of foetal movements may indicate that the foetus is under stress.
1.2 Need for Study:
Since biblical times, foetal movements have been viewed as a reassuring sign of a healthy pregnancy. Foetal movements in utero are a movement’s expression of foetal wellbeing. By counting the foetal movements, a mother can therefore, monitor the condition of the foetus. Assessment of foetal movements is a non-invasive method of monitoring the wellbeing of the foetus.
Decreased fetal movement has been associated with poor pregnancy outcomes including stillbirth about 50% of women with stillbirth, they reported that they felt a gradual decrease of foetal movements before intrauterine death. Maternal perception of decreased foetal movement has been reported in 15% of pregnancy during the third trimester and around 50% of women perceives a gradual reduction of fetal movements before intra uterine death. (Dr. Arms Grannbarm, 2014)
FEMINA (Foetal Movement Intervention Assessment) is an ongoing international research collaboration conducted a study to improve pregnancy outcome. The findings reveal that women still do not get enough information on the importance of foetal activity to act in such a way to protect their baby. In 2008, Freon reported that 50% of affected mothers waited more than 24 hours without any foetal activity before contacting health professionals; one in three waited more than 48 hours. Public Relations efforts in Norway as well as in the U.S. are on the way to educating the public regarding kick count. (Freon, 2008)
According to NFHS Survey (2005-2006), the IMR in India is 57/10000 live births. Still birth is a high global burden and according to SRS estimates (2003), the still birth rate of India is 9/10000 and that of Karnataka is 20/10000 deliveries, which is highest among all other states. Some still births are unexplained and some are unavailable. But in some cases, still births can be preventive if the mother is highly aware of her foetal movements. (NFHS Survey, 2005-2006)
According 2003 revision of the procedure for coding cause of foetal death under ICD10 the National Centre for health statistics defines foetal death prior to the complete expulsion or extraction from its mother of a product of human conception, irrespective of the duration of pregnancy and which not an induced termination of pregnancy. The death is indicated by the fact after such expulsion or extraction, the foetus does not breath or show any other evidence of life such as beating of the heart, pulsation of the umbilical cord or definite movement of voluntary muscles. Heart beat are to be distinguished from transient cardiac contractions, respirations are to be distinguished from respiratory efforts or gasps. In the United States, the term still birth of foetal demise does not have a standard definition. For statistical purposes the foetal loses are classified according to gestational age. A death that occurs prior to 20 weeks of gestation is usually classified as a spontaneous abortion those occurring after 20 weeks constitute a foetal demise or still birth. Many states use a foetal weight of 350gm or more to define a foetal demise. (Patricia Mattingly, Leriv Smith M.D, 2003).
factor in the early identification of abnormality of foetal movement. The unsatisfactory knowledge and poor perception behaviour among respondents reflect the need for a guideline, particularly during antenatal care, on information and management of abnormal foetal movement in the setting to prevent avoidable stillbirth. (Akintayo A A, 2014)
Decreased foetal movement often precedes a stillbirth. The objective of this study was to describe women's experiences of foetal movement before the confirmation of foetal death. Data were collected through a Web-based questionnaire. Women with stillbirths after 28 gestational weeks were self-recruited. Content analysis was used to analyze the answers to one open question. The statements from mothers of a stillborn, during gestational weeks 28 to 36 were compared with those of a stillborn at term. The women's 215 answers were divided into three categories: decreased, weak, and no foetal movement at all; 154 (72%) of the descriptions were divided into three subcategories: decreased and weak movement (106; 49%), no movement at all (35; 16%), and contraction interpreted as movement (13; 6%). The category of foetal movement as normal includes 39 (18%) of the descriptions. The third category, extremely vigorous foetal activity followed by no movement at all, includes 22 (10%) of the descriptions. Eight (15%) of the women with stillbirths in gestational weeks 28 to 36 interpreted contractions as foetal movement as compared to 5 (5%) of the women with stillbirths at term. Uterine contractions can be interpreted as foetal movement. A single episode of extremely vigorous foetal activity can precede foetal death. The majority of the women experienced decreased, weaker, or no foetal movement at all 2 days before foetal death was diagnosed. Mothers should be educated to promptly report changes in foetal movement to their health care providers. Using foetal movement information to evaluate possible foetal distress may lead to reductions in stillbirths. (Linda.A,2015)
Maternal perception of foetal movement is one of the first signs of foetal life and
is regarded as a manifestation of foetal wellbeing. Movements are first perceived by the
mother between 18 and 20 weeks of gestation and rapidly acquire a regular pattern.
Foetal movements have been defined as any discrete kick, flutter, swish or roll. A
significant reduction or sudden alteration in foetal movement is a potentially important
warning sign of impending foetal death. Studies of foetal physiology using ultrasound
have demonstrated an association between RFM (Reduced Foetal Movement) and poor
perinatal outcome. The majority of women (55%) experiencing a stillbirth perceived a
reduction in foetal movements prior to diagnosis. A number of studies of foetal deaths in
Norway and the UK identified that an inappropriate response by clinicians to maternal
perception of RFM was a common contributory factor in stillbirth. (Royal College of
Obstetricians and Gynaecologists, 2011)
Decreased foetal movements are present in 5% to 15% of pregnancies and are associated with intrauterine foetal death and intrauterine growth restriction (Obstetrical & Gynaecological survey, 2008). In national level the last one year in rural area 35 per 10000 and in urban area 22 per 10000 intra uterine death was mentioned. (Dr. Anjali Choudary, 2014) In PSG hospital there were 6 intrauterine deaths reported from January 2014 to April 2014.
1.3 Statement of the problem:
A comparative study on the effectiveness of DFMC chart versus Cardiff count ten chart in relation to maternal compliance and mothers perception on self -assessment of foetal wellbeing.
1.4 Objectives:
1. To assess the maternal compliance towards DFMC chart and Cardiff count ten chart.
2. To assess the mother’s perception about DFMC chart and Cardiff count ten chart. 3. To compare the effectiveness of DFMC chart versus Cardiff count ten chart in
relation to maternal compliance and mothers perception.
4. To find out the correlation between the maternal compliance and mothers perception towards DFMC chart and Cardiff count ten chart.
1.5 Assumption:
1. The mothers will be able to comply and record the foetal movements to one of the methods.
2. The mother will better comply with Cardiff count ten method than DFMC chart.
1.6 Hypothesis:
1. H1: There will be a significant difference in maternal compliance to DFMC chart and Cardiff count ten chart.
2. H2: There will be a significant difference in mothers perception about Cardiff count ten than DFMC chart.
3. H3: There will be a correlation between mothers perception and maternal compliance towards DFMC chart and Cardiff count ten chart.
4. H4: There will be a significant association between selected demographic variables and maternal compliance.
1.7 Delimitations:
x The study is limited to 40 antenatal mothers attending OPD at PSG Hospitals. x The study participants are antenatal mothers from 32 weeks of gestation till term.
1.8 Operational Definitions:
1.8.1 Effectiveness: It refers to the correct recording of foetal movement by DFMC chart and Cardiff count ten chart there by identifying the foetal well being.
1.8.2 DFMC Chart: It is a tool in which the antenatal mothers used to record the number of foetal movements perceived by mother one hour after food (breakfast, lunch, dinner) 1.8.3 Cardiff count ten method: It is a tool in which the antenatal mothers used 8-12 hours period to record at least ten of baby’s movements per day.
1.8.5 Perception: Mothers ability to understand about the foetal movements by using DFMC chart and Cardiff count ten chart.
1.8.6 Self assessment: Assessing the foetal movement in terms of kick rolling of foetus and maintain the record of the same by the antenatal mothers using DFMC Chart and Cardiff count ten chart.
1.8.7 Antenatal mothers: All pregnant mothers from 32 weeks of gestation attending the antenatal OPD.
1.8.8 Foetal well being: It refers that antenatal mothers perceives at least ten of baby’s movements in 8 to 12 hours period.
1.9 Conceptual Frame Work:
The conceptual frame work is a theoretical approach to the study of problems that are scientifically based and emphasizes the selection, arrangements and classification of its concepts.
The theoretical frame work of the present study was developed from Pederson’s health promotion model (1996). Pender’s health promotion model aims to increase an individual health promotion activity. The model focuses on cognitive, perceptual and modifying factors that influence the health promotion activities. Health promotion entails activities directed toward developing resources that maintain or enhance a person’s well being. The model embodies a number of theoretical propositions that can be used in developing and testing interventions and understanding health behaviours. The model embodies a number of theoretical propositions that can be used in developing and testing interventions and understanding health behaviours.
The model directs nurses to systematically assess clients for their:
religion, marital status, obstetrical score and gestational age and previous usage of DFMC chart and Cardiff count ten chart and its impact on self assessment of foetal movements. Perceived benefits of action: Perceived benefits of action is the belief about the positive or reinforcing consequences of a health promoting barrier.
Perceived barriers to action: Beliefs about the unavailability, inconvenience, expense, difficulty or time consuming nature of a health.
Situational Influence: Beliefs about the situation context of the health promoting behaviour. These beliefs may include perception of the available option, demand characteristics and aesthetic feature of the environment in which a given behaviour is proposed to take place situation influence on health behaviour.
Interpersonal Influence: Beliefs concerning the behaviour, beliefs or attitude of other regarding a health promoting behaviour, source of influence include social norms and social support.
Personal socio cultural and biologic factors: The factors include variable such as gender, race, education, socio economic status and family history.
Health promoting behaviour: A health promoting behaviour is an end point or action outcome directed toward attaining positive health outcome such as optimal well being, personal fulfilment and productive living.
According to this model, the present study conceptualized as follows,
Activity related effect: This includes the maternal compliance and perception is better with DFMC chart or Cardiff count ten chart for self assessment of a foetal wellbeing. Perceived benefit of action: Self assessment of foetal wellbeing by counting the foetal movement using DFMC chart and Cardiff count ten chart.
Situational influence: In this study mothers daily activities, work pattern, and environmental factors.
Interpersonal influence: Support from health care professionals and relatives.
Personal socio cultural factor: In this study variables such as age, gender, education, occupation, family history, socioeconomic status, obstetrical history and gestational age. Health promoting behaviour: Monitoring of foetal movement and thereby assessing the foetal wellbeing.
Commitment to a plan of action: Assessment and comparison of DFMC chart and Cardiff count ten chart in antenatal mothers on their self assessment of foetal wellbeing and monitoring the foetal movements.
1.10 Projected Outcome
Figure 1.1 Modified Pender’s health promotion model to assess the effectiveness of DFMC chart versus Cardiff count ten chart in relation to maternal compliance and
mothers perception on self assessment of foetal well being Individual
characteristics and experiences
Prior usage of DFMC or Cardiff
count ten and its knowledge on self assessment of foetal
movements Personal Factors Age, Education, Religion, Marital status, Obstetrical score and Gestational age
Cognitive Factors Behavioural
Characteristics
Perceived benefits of action
Self assessment of foetal well being by counting the
foetal movement using DFMC chart or Cardiff
counts ten chart
Perceived barrier of action Mother’s inability to record fetal movements because of time constraints.
Activity related affect Maternal compliance and
perception is better with DFMC chart or Cardiff
count ten chart for self assessment of foetal
wellbeing
IPR influence Support from health care professionals and relatives.
Situational influences Daily activities, work pattern and environmental factors
Immediate competing demands and preferences Work or occupation
Care for another child.
Commitment to a plan of
action Assessment and comparison of DFMC chart and Cardiff count ten chart
in antenatal mothers on their self assessment of foetal well being and monitoring the foetal movement. Health promoting behaviour Monitoring of foetal movement and thereby assessing the fetal well being.
Mothers who are feeling difficulty in monitoring the foetal
CHAPTER-II
REVIEW OF LITERATURE
The review of Literature provides a basis for future investigation, an insight to the problem, relates the findings of one study to another with the hope to establish a comprehensive link between the findings of the research review can also serve as the connecting link between the findings of the research that has been done in the problem area and the results of the proposed study (Polit and Hungler, 1995).
Literatures relevant for this study were reviewed and have been organised as follows: 2.1. Research related to importance of DFMC chart.
2.2. Research related to importance of Cardiff count.
2.3. Research related to the comparison of DFMC chart and Cardiff count chart.
Importance of DFMC Chart
A prospective study was carried out over 500 booked cases after introducing daily foetal movements count (DFMC) Chart in the ninth month of pregnancy. Prior ultrasound was done in all cases. DFMC Chart was used to record number of foetal movements perceived by patients for one hour after food (breakfast, lunch, dinner). The foetal movements were considered satisfactory if the count was 3 or more on each occasion. During the study period, no foetus was lost after introduction of DFMC Chart in the 250 cases that were given DFMC Chart and delivered in the hospital (Nil perinatal mortality). This was compared with 250 booked cases that were not given DFMC Chart but had normal ultrasound done after completion of 8 months of pregnancy and followed up. Five intrauterine deaths occurred in the ninth month in control group (2% perinatal mortality). In the DFMC Chart group, 15 patients were admitted with decreased foetal movements out of this 12 were discharged after monitoring for 3 days and 3 cases were delivered.
A prospective observational study conducted in the department of obstetrics and gynaecology St. Martha’s Hospital over a period of 13 months from 01/03/2009 to 31/03/2010 included 50 pregnant women after 32 weeks of gestation and singleton pregnancies with <12 foetal movements in 24 hours. They underwent a cardiotocogram (CTG) or a non stress test and biophysical profile test and results were analyzed statistically. Although daily foetal movement counting is subjective, with onset of reduced foetal movements. It is prudent to advocate close foetal monitoring even in the presence of a reactive admission. (Syeda R M, et al., 2013)
According to the saving babies report (DOH, 2002), the Limpopo Province is subdivided into six district municipalities with the total of 43 hospitals, and 455 clinics and health centres. Forty (40) hospitals and 281 clinics have functional maternity units at which deliveries take place. In this report it is documented that the inappropriate response to poor foetal movements (8.2% in Limpopo Province) could be classified as patient-related avoidable factors. It was further pointed out that poor report of reduced foetal movement is frequently attributed to patient-related factors. Neldam observed that formal scoring of foetal movement in a low risk population resulted in a significant reduction in perinatal mortality in Sweden in 1979, in the context of this study it was not clear whether pregnant mothers understood the importance of foetal movement monitoring during pregnancy in relation to the perinatal outcome. (RC Pattinson, 2002)
A multicenter controlled trial on 1,013 woman with a singleton pregnancy were randomly assigned either to perform daily foetal movement counting from pregnancy week 28 or to follow standard Norwegian antenatal care where foetal movement counting is not encouraged. The primary outcome was maternal concern, measured by the Cambridge Worry Scale. Analysis was by intention-to-treat. The means and standard deviation on Cambridge Worry Scale scores were 0.77 and 0.90 for the intervention and control groups respectively, a mean difference between the groups of 0.14. The decreased foetal activity was concerned to 433 women once or more during pregnancy 45 and 42% in the intervention and control groups respectively. 79% of the women responded favourably to the use of counting charts. The result shows that women who performed foetal movement counting in the third trimester reported less concern than those in the control group. The frequency of maternal report of concern about decreased foetal activity was similar between the groups. Most women considered the use of a counting chart to be positive. (Saastad .E, et al., 2012)
A multicentre, randomized, controlled trial, 1076 pregnant women with singleton pregnancies from an unselected population were assigned to either perform foetal movement counting from gestational week 28, or to receive standard antenatal care not including foetal movement counting (controls). Women were recruited from nine Norwegian hospitals during September 2007 through November 2009. Main outcome was a compound measure of foetal pathology and adverse pregnancy outcomes. Analysis was performed by intention-to-treat. The frequency of the main outcome was equal in the groups; 63 of 433 (11.6%) in the intervention group, versus 53 of 532 (10.7%) in the control group [RR: 1.1 95% CI 0.7–1.5)]. The growth-restricted foetuses were more often identified prior to birth in the intervention group than in the control group; 20 of 23 foetuses (87.0%) versus 12 of 20 foetuses (60.0%), respectively, [RR: 1.5 (95% CI 1.0– 2.1)]. In the intervention group two babies (0.4%) had APGAR scores <4 at 1 minute, versus 12 (2.3%) in the control group [RR: 0.2 (95% CI 0.04–0.7)]. The frequency of consultations for decreased foetal movement was 71 (13.1%) and 57 (10.7%) in the intervention and control groups, respectively [RR: 1.2 (95% CI 0.9–1.7)]. The frequency of interventions was similar in the groups. The result shows that maternal ability to detect clinically important changes in foetal activity seemed to be improved by foetal movement counting; there was an increased identification of foetal growth restriction and improved perinatal outcome, without inducing more consultations or obstetric interventions.(Eli Saastard, et al., 2011)
Importance of the Cardiff count ten method
This is used in 8 to 12 hours period to record at least 10 of baby’s movements. The time period will depend on, when the mother think baby is more active. For example, in the evening, if the baby has at least 10 movements with this 12 hours period, they are thought to be well. If the baby has not moved for 12 hours should contact health care providers.
When charting, start timing around the same time each day. The mothers felt her baby’s movements and recorded the time and write it down on a graph. Try to count every movement or kick until the baby has moved 10 times. When the mother feels tenth movement write down the time or put as ‘X’ in the box corresponding to that time.
A study was stated that perceived foetal activity is the oldest and least expensive technique for monitoring for foetal wellbeing. The mother’s awareness of a loss or a significant decrease in propulsive foetal activity has been traditionally regarded as a warning sign, especially when uteroplacental insufficiency is present. Many investigators have reported the value of the daily foetal movement count as a means for signalling foetal jeopardy and possible demise. The aim of the study was to detect abnormal foetal conditions by registering foetal body movements. Cardiff count to ten kick chart was used. It was concluded that the daily foetal movements charting is a simple and effective method for the detection of abnormal foetal conditions and the foetal inactivity needs further investigations by NST. (Listen .R .M, et al., 2001)
From the 5th
times is the foetal hypoxia. If in a time women with DFM, respectively. Reports of DFM did not increase during the intervention. The stillbirth rate among women with DFM fell during the intervention: 4.2% vs. 2.4%, and 3.0/1000 vs. 2.0/1000 in the overall study population. There was no increase in the rates of preterm births, foetal growth restriction, transfers to neonatal care or severe neonatal depression among women with DFM during the intervention. The use of ultrasound in management increased, while additional follow up visits and admissions for induction were reduced. (Freon .J F, 1995)
A Crossover trail; 40 healthy women with an uncomplicated full term pregnancy counted the foetal movements according to a count to ten method and assessed the character of the movements according to the mindfoetalness method. Each self assessment was observed by a midwife and followed by questionnaire. A total of 80 self assessment was performed; 40 with each method. Of the 40 women, only one did not find at least one method suitable. Twenty of the total of 39 reported a preference, 15 for the mindfoetalness method and five for the Count to ten methods. All 39 said they felt calm, relaxed, mentally present and focused during the observations. Furthermore, the women described the observation of the movements as safe and reassuring and a moment for communication with their unborn baby. In the 80 assessment all but one of the women found one or both methods suitable for self-assessment of foetal movements and they felt comfortable during the assessments. More women preferred the mindfoetalness method compared to the count-to-ten method, than vice versa. (Malm, et al., 2014)
antenatally than those women randomised to hormone analysis (relative risk (RR) 0.26, 95% confidence interval (CI) 0.20 to 0.35), whereas there were fewer APGAR scores less than seven in five minutes for women randomised to hormone analysis (RR 1.72, 95% CI 1.01 to 2.93) There was a significantly higher compliance with Cardiff ‘count to ten’ (once a day) method than the foetal movement counting method where women were counting 30 minutes before meals and at bed time (more than once a day). (Lindeka Mangesi, et al., 2010)
Julie Victoria Holm Tveit, et al., (2009), Norway, in their study assessed the women experiencing decreased foetal movements (DFM) are at increased risk of adverse outcomes, including stillbirth. Fourteen delivery units in Norway registered all cases of DFM in a population-based quality assessment. We found that information to women and management of DFM varied significantly between the hospitals and they intended to examine two cohorts of women with DFM before and during two consensus-based interventions aiming to improve care through: 1) written information to women about foetal activity and DFM, including an invitation to monitor foetal movements, 2) guideline for management of DFM for health care professionals. All singleton third trimester pregnancies presenting with a perception of DFM were registered, and outcomes collected independently at all 14 hospitals. The quality assessment period included April 2005 through October 2005, and the two interventions were implemented from November 2005 through March 2007. The baseline versus intervention cohorts included: 19,407 versus 46,143 births and 1215 versus 3038 chart was clearly preferred over the Hollister chart because of the shorter recording period. The population of patients who fully completed the count ten charts during the week was significantly higher than the proportion completing the Hollister chart. (J Marten, 2003)
obstetric response rates to the survey were 82% (n=47) and 71% (n=89) respectively. The majority of respondents reported an absence of local guidelines for detecting and managing DFM (Decreased Foetal Movements) in pregnancy. Less than 10 movements in 12 hours was the most frequently provided definition of DFM. A minority of respondents routinely recommended formal foetal movement counting for low-risk women (24% and 19% for midwives and obstetricians respectively). This increased considerably, however, for women who presented with DFM (62% and 47% in low risk women and 78% and 51% in high-risk women for midwives and obstetricians respectively). The Cardiff count to ten method was the chart of choice for more than 70% of all respondents. Large variations in management strategies for women presenting with DFM was identified; however, almost all respondents would perform a cardiotocograph (CTG) in women presenting with DFM. (Valerie Smith, et al., 2014)
The Cardiff count ten chart was developed by Pearson and Weaver. According to them they evaluated 173 pregnant women after the 26th
week of gestation in this way. Evidence for foetal inactivity is less than 10 movements/12 movements hours. 10% of the pregnancies showed foetal inactivity; half of them are expected to have an unfavorable outcome due to placental insufficiency and foetal distress during labour. Foetal movement count charting is a simple and effective method for the abnormal foetal conditions. It should be used in all high risk pregnancies especially in cases of incompatibility in the Rh system, diabetes mellitus and placental insufficiency.
(Geburtshilfe Frauenheild, 1990)
foetal movements, the correlation was weaker (r=0.23, p<0.05). All clusters of foetal movements perceived by the mother were recorded by the machine and were associated with foetal heart rate accelerations. Two or more accelerations within 3 minutes of the foetal movements were seen with 87.8% of clusters felt by mother compared with 66.7% detected by the machine (p=0.01). In the 2,263 minutes of recording in 42 women, a cluster of foetal movements was felt at least every 25 minutes by the mother. The result shows that the maternal perception of 1 or 2 clusters of foetal movements in 30 to 60 minutes may be as reliable as a non-stress test in reassuring good health. It would be less time consuming than the traditional count to 10 foetal movement chart and a more reliable indicator of foetal health than counting episodes of foetal movements. Thus, the study suggests that clusters rather than episodes of foetal movements should be considered for evaluating foetal health based on foetal movements. (Singh .K, et al., 2013)
Comparison of DFMC method and Cardiff count to ten methods
A comparative study was done at Lima in Peru to determine the degree of compliance with a novel foetal movement chart by high risk patients the standard count to 10 methods. The prospective trial included 1400 high risk patients. Women with singleton gestations were randomly assigned to use either the count to 10 charts or a DFMC proposed by the Latin American Centre for Perinatology (CLAP). Compliance with regimens was compared between the two groups. Compliance in the CLAP group (448 of 700 was lower in the count to 10 group, 638 of 700; 64 versus 91%; p<0.0001). The main advantage of the count to10 chart was lack of interference with daily activities. The count to 10 methods is an easy and inexpensive tool for foetal monitoring and should continue to be used in obstetric practice. (Gomez LM, Vega DL, 2012)
completed and return both charts. The count to ten charts was clearly preferred over the Hollister chart because of the shorter recording period. The proportion of patients who fully completed the count to ten charts during the week was significantly higher than the proportion completing the Hollister chart. To conclude the count to ten methods was clearly preferred and promoted higher level of adherence. (FC. Christensen, et al., 2003)
A cross sectional study was conducted among 156 antenatal women in a tertiary referred hospital, Sydney. Where the participants were more than 28 weeks carrying a single child, more than 18 years old and with sufficient English literacy to complete the questionnaire regarding the description of the fetal movements through the pregnancy. The results shows that, they used word such as gentle strong, and limb movements and whole body movements to describe the fetal movements. Only 16% regularly counted the fetal movements and many describing as counting as confusing. (Jon A Ligette, 2013)
throughout the last 3 months of pregnancy is a sign of fetal well-being, whereas perception of reduced fetal movements is associated with increased risk of late stillbirth.
(Edwin .A, 2011)
A convenience sample of 100 women attending two antenatal clinics in Auckland in November and December 2011 were interviewed. The main aim is to determine what information women in the third trimester of pregnancy receive about foetal movements, both from their maternity caregivers and from other source. Ninety-seven per cent of women reported that their Lead Maternity Care (LMC) regularly asked about foetal movements, and 62% recalled receiving information from their LMC about what to expect regarding foetal movements in the last three months of pregnancy. Thirty-three per cent recalled receiving information from their LMC that their baby's movements should increase or stay the same and 20% that their baby's movements may decrease in late pregnancy. Forty per cent were advised to contact their LMC if they had any concerns about their baby's movements, and one-quarter were informed to seek advice if they had fewer than 10 movements in a day. The study suggests a proportion of pregnant women in Auckland do not have optimum information about foetal movements. Strategies to enhance maternal knowledge such as a pamphlet about foetal movements may be helpful. (Robin Cronin, 2012)
Summary:
CHAPTER III
MATERIALS AND METHOD
Designing a research involves the development of plan or strategy that will guide the collection and analysis of data. The present study is comparing the effectiveness of DFMC chart versus Cardiff count ten chart in relation to maternal compliance and mothers perception on self assessment of foetal well being.
The methodology of the study includes research design, setting, population and sampling criteria for selection of samples, instruments and tool for data collection, pilot study report and changes made after pilot study.
3.1 Research approach and design:
Post test only design with comparison group. It helps the investigator to carried out on both the groups to assess the effect of manipulation. This design can be helpful in situations where it is not possible to pre-test the subjects.
Group 1: DFMC Chart Post test
Group 2: Cardiff count 10 Chart Post test
Post test only design with comparison group
Intervention 1: DFMC chart was given to one group. The mothers should record the number of foetal movements in the chart one hour after food in a day that is morning, afternoon, evening.
Intervention 2: Cardiff count ten chart was given to the second group. The mother foetal movement assessment for chart 12 hours in a day, from 9 am to 9 pm.
3.2 Variables of the study: 3.2.1 Independent variable:
x In this study education, on self assessment of foetal wellbeing by researcher using DFMC chart and Cardiff count ten chart is the independent variable.
3.2.2 Dependent variable:
x The dependant variable in this study is self assessment of foetal well being using the foetal movement chart by mothers, age, parity education, previous experiences.
3.3 Setting of the study:
The study was conducted in ante natal OPD in PSG hospital Coimbatore. PSG is a NABH accredited with 1300 bedded multispecialty hospital. There are about 100 to 150 antenatal mothers attending antenatal OPD every day.
3.4 Population and sampling:
Antenatal mothers who are after 32 weeks of gestation coming in PSG hospitals were included for the study. Sample size is calculated by using precision method and 40 samples were selected.
Sample size calculation: Precision method:
n z
2
SD2
100ofmean2SD = Standard Deviation of population
Z = Value of normal deviate at p<0.05 level of significance.
1 .982*9. 22 1. 962= 18 n=18 x 2 = 36
Selected sample = 40
DFMC Chart = 20 3.4.1 Sampling technique:
x Non probability convenient sampling technique.
3.4.2 Sample selection criteria: Inclusion criteria:
x All ante natal mothers beyond 32 weeks of gestation who attended the outpatient department.
Exclusion Criteria:
x Antenatal mothers who are coming with labour pain.
3.5 Instruments and tool for data collection: Assessment tool was prepared based on the objectives of study.
3.5.1 Validity and Reliability: The demographic tool was prepared with the help of various literatures and based on objectives. The reliability of the tool assessed by test retest method. The reliability of the DFMC was 0.72 and the Cardiff count ten chart was 0.78.The tool was found to be reliable and feasible. Validity of the tool was established by giving the experts in the fields of OBG and OBG nursing and the modifications were done accordingly.
Figure 3.1: Flow chart showing the techniques of data collection 3.5.3 Data collection procedure:
Description of the tool: The tool consists of three sections Section A: Demographic and baseline data of mother. Section B: Cardiff count ten chart.
Population: 150 antenatal mothers attending antenatal OPD per day in PSG Hospitals
Antenatal mothers beyond 32 to 38 weeks of gestation who attended the outpatient department
Samples: 40 antenatal mothers were selected
DFMC 20 samples Cardiff Count Ten
Chart 20 samples
Obstetrical variables were collected
Mothers were instructed to record the number of foetal movements perceived by the mother one hour
after food
Mothers were instructed to record the number of foetal movements
for a period of 8-12 hours
Post test was done during their next antenatal visit by fill up the questionnaire for assessing mothers perception and maternal compliances
Inclusion Criteria
Section D: Questionnaire on mother’s perception about foetal movement count charts. Section A: Demographic variables which include age, educational status, occupation, income, religion, no of working hours per week the mothers works, obstetrical score, LMP, EDD, gestational age, normal or high risk pregnancy, number of antenatal visit, have the mothers thought a method to count and keep track of your babies movements in this pregnancy or previous pregnancies and previous knowledge about foetal monitoring. (Annexure IV)
Section B: It includes Cardiff count ten chart. In count ten chart the mother record the foetal movements in 8-12 hour’s period. It should be at least 10 of foetal movement. (Annexure IV)
Section C: It include DFMC chart. In this the ante natal mothers used to record the number of foetal movements perceived by the mother one hour after food (breakfast, lunch, dinner). (Annexure IV)
Section D: Questionnaire on mother’s perception about foetal movement count chart. In this, questionnaire consists of 10 questions and each question has five possible responses as definitely yes, yes, uncertain, no, definitely no. The scores were categorized as 5, 4, 3, 2, 1. Mother’s perception was graded based on the total score. (Annexure IV)
The interpretations are divided as
Score Grade Interpretation
10 – 23 Poor
24 – 36 Good
37 – 50 Very good
3.6 Ethical Approval:
3.7 Report of pilot study: Pilot study was conducted to test the validity, practicability of the tool and feasibility of conducting the study. Pilot study was conducted for a period of one week at PSG Hospitals, Coimbatore. Ten samples were selected for the study. The selection is mainly based upon the inclusive criteria. The demographic variables and baseline data of mother was done priorly. After collecting the data, random assignment of subjects was done with simple flip of a coin for each subject. Among ten samples, five samples were DFMC chart and another five were Cardiff count ten chart. The researcher collected the chart after one week and the researcher asked the mothers to fill up the questionnaire for mother’s perception about foetal movement chart. The researcher provides the questionnaire for mother’s perception about foetal movement chart. The results of the pilot study showed that both DFMC chart and Cardiff count chart, mothers completed all the days, and mothers showing good perception.
3.7.1 Changes brought after pilot study: During the pilot study presentation the minor changes was done in grading and it is included in the evaluation form and some modifications were done on the conceptual frame work.
3.8 Data analysis plan: Both the descriptive and inferential statistics are used to analyze the data. Data is presented in tables and figures. Statistical analysis was done by using unpaired ‘t’ test to assess the effectiveness of DFMC chart and Cardiff count ten chart. Chi square test was used to find out the association between selected demographic variables and maternal compliance.
Descriptive statistics will be used to find the frequency and percentage distribution of demographic variable of antenatal mothers with Cardiff count ten chart and DFMC chart. Un Paired ‘t’ test will be used to assess the effectiveness of DFMC chart versus Cardiff count ten chart was analysed by using un paired ‘t’ test.
Chi Square test will be used to find out the association between selected demographic variables and maternal compliance.
Summary:
CHAPTER-IV
DATA ANALYSIS AND INTERPRETATION
Analysis is the process of organizing and synthesizing the data in such a way that research questions can be answered and hypothesis can be tested. The data was assembled, analyzed and tested for significance analysis is the method of rendering qualitative data as meaningful and providing intelligent information. In this study the effectiveness of DFMC chart and Cardiff count ten chart in relation to the maternal compliance and self perception were assessed.
Section I: Demographic and Obstetrical variables of antenatal mothers.
Section II: Frequency and percentage distribution of mother’s perception and maternal compliance towards DFMC chart and Cardiff count ten charts.
Section III: Comparison of mother’s perception and maternal compliance towards DFMC chart and Cardiff count ten charts.
Section IV: Correlation between mother’s perception and maternal compliance towards DFMC chart and Cardiff count ten charts.
Section I: Demographic and Obstetrical variables of antenatal mothers.
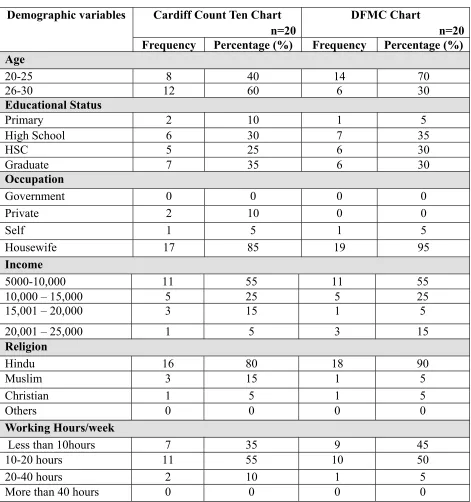
Table 4.1: Frequency and percentage distribution of demographic variables of mothers in Cardiff Count Ten Chart and DFMC Chart
n=40 Demographic variables Cardiff Count Ten Chart
n=20
DFMC Chart
n=20 Frequency Percentage (%) Frequency Percentage (%) Age
20-25 8 40 14 70
26-30 12 60 6 30
Educational Status
Primary 2 10 1 5
High School 6 30 7 35
HSC 5 25 6 30
Graduate 7 35 6 30
Occupation
Government 0 0 0 0
Private 2 10 0 0
Self 1 5 1 5
Housewife 17 85 19 95
Income
5000-10,000 11 55 11 55
10,000 – 15,000 5 25 5 25
15,001 – 20,000 3 15 1 5
20,001 – 25,000 1 5 3 15
Religion
Hindu 16 80 18 90
Muslim 3 15 1 5
Christian 1 5 1 5
Others 0 0 0 0
Working Hours/week
Less than 10hours 7 35 9 45
10-20 hours 11 55 10 50
20-40 hours 2 10 1 5
Among 20 antenatal mothers 8 (40%) of women age ranged from 20 to 25 years and 12(60%) were in 26 to 30 years in Cardiff count ten chart. In DFMC chart 14(70%) in 20 to 25years and 6(30%) in 26 to 30years. In educational status, 7(35%) were graduates in Cardiff Count Ten Chart, but in DFMC chart 7(35%) were studied in high school. About occupation 17(85%) of mothers were housewives and 19(95%) were in DFMC chart.
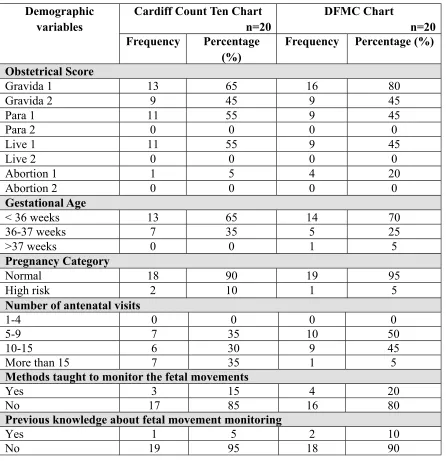
Table 4.2: Frequency and percentage distribution of obstetrical variables of mothers in Cardiff Count Ten Chart and DFMC chart
n=40 Demographic
variables
Cardiff Count Ten Chart n=20
DFMC Chart
n=20 Frequency Percentage
(%)
Frequency Percentage (%) Obstetrical Score
Gravida 1 13 65 16 80
Gravida 2 9 45 9 45
Para 1 11 55 9 45
Para 2 0 0 0 0
Live 1 11 55 9 45
Live 2 0 0 0 0
Abortion 1 1 5 4 20
Abortion 2 0 0 0 0
Gestational Age
< 36 weeks 13 65 14 70
36-37 weeks 7 35 5 25
>37 weeks 0 0 1 5
Pregnancy Category
Normal 18 90 19 95
High risk 2 10 1 5
Number of antenatal visits
1-4 0 0 0 0
5-9 7 35 10 50
10-15 6 30 9 45
More than 15 7 35 1 5
Methods taught to monitor the fetal movements
Yes 3 15 4 20
No 17 85 16 80
Previous knowledge about fetal movement monitoring
Yes 1 5 2 10
No 19 95 18 90
of mothers in DFMC chart. About gestational age, 13(65%) of mothers were in <36 weeks. in Cardiff count ten chart, in same manner 14(70%) belongs to <36 weeks in DFMC chart. Among 20 antenatal mothers 18(90%) were normal and 2(10%) mothers are high risk women in Cardiff count ten chart. But in DFMC chart 19(95%) and in high risk it is decreased to 1(5%)
[image:48.612.124.519.391.656.2]Majority 17(85%) of mothers were not taught to monitor the fetal movements in Cardiff count ten chart. In DFMC chart, 16(80%) were not taught the fetal movements. Likewise 1(5%) and 2(10%) of mothers have the knowledge about the fetal movement in both Cardiff count ten chart and DFMC chart. 19(95%) and 18(90%) of mothers in Cardiff count ten chart and DFMC chart were not having the previous knowledge about fetal movements.
equency and p e rc entage d is tr
ibution of mo
th
er
’s
per
cepti
on and mat
ernal comp
li
an
ce tow
ards DFMC cha
[image:50.612.154.519.57.722.2]rt and ff c o unt te n c h arts.
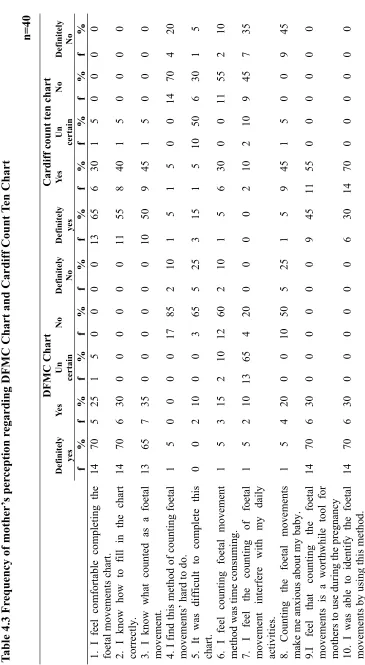
ble 4.3 Fr
equency of mother ’s per cep tion r e gar d
ing DFMC Chart and Car
d iff Count T e n Chart n=40 D F MC Ch art Cardiff c o unt ten chart Definitely ye s Ye s U n c erta in No Defin itely No Definitely ye s Ye s U n c erta in No D e fin it el y No f % f % f % f% f % f % f % f% f% f % I fee l co m fort able co m p leting the al mov em en ts c h art. 1 4 7 0 5 2 5 1 50 00 0 1 3 6 5 6 3 0 15 00 0 0 I know how to fill in the chart ly. 1 4 7 0 6 3 0 0 00 00 0 1 1 5 5 8 4 0 15 00 0 0 I know w h at counte d as a foetal v eme nt . 1 3 6 5 7 3 5 0 00 00 0 1 0 5 0 9 4 5 15 00 0 0 I find this m ethod of counti ng foetal o v ements ’ har
d to do.
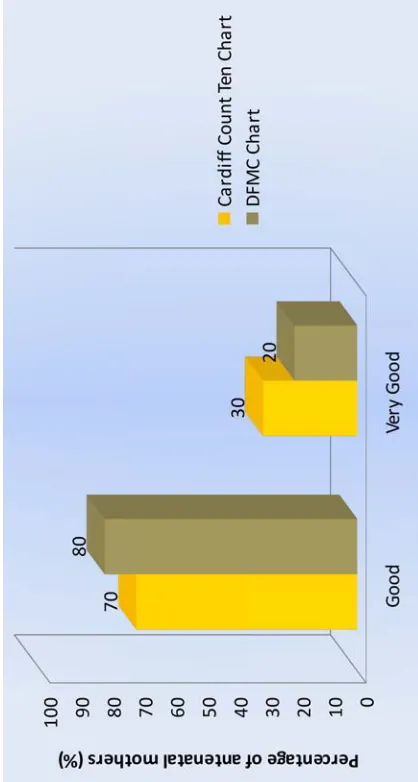
Table 4.3 shows that, the ma jority 14(70% ) of the antena tal mothe rs fee ls comfortable d efin itely in com p leting the DFMC chart w ere as 13(65%) f elt the Cardiff count ten chart has definite ly helpe d the sa m e. Most of the m o th er s 14( 70% ) knew how to fil l the DFMC chart correctly were as 11(55%) felt the sa me about C ardi ff c ount te n chart. More tha n half 13(65% ) know what counted as fetal move m ent in DFMC charting, where as 9(45%) affir m ed the sam e in Cardiff count ten chart. More than half 12(60%) who used
DFMC chart and 11(55%) who used C
ardi
ff count ten cha
rt fe lt their r espective met hod f o r ti m e consum ing. DF M C w as considered as a re mar kable tool for m o th er s by 14( 70% ) of the antenatal mothe r. W h il e only 9 (45%) obs erved the sa m e about Cardiff count te n chart. Most of the m o th er s who used D F MC 14(70%) stated that they were ab le to iden tif y th e fetal move ment s us ing thes e m ethods . W h il e only 6(30%) of the an tenatal mothe r were definit el y abl
e to identify f
etal movem
ent by us
[image:51.612.75.318.244.697.2]T a ble 4.4: Fr equ e n c y and per c e n tage dis tr ibution of lev e l o f mo ther ’s per ception towards Cardiff Count T e
n Chart and DFMC Chart
n=40 P e rcepti on Good (24-36) V e
ry Good (37-50)
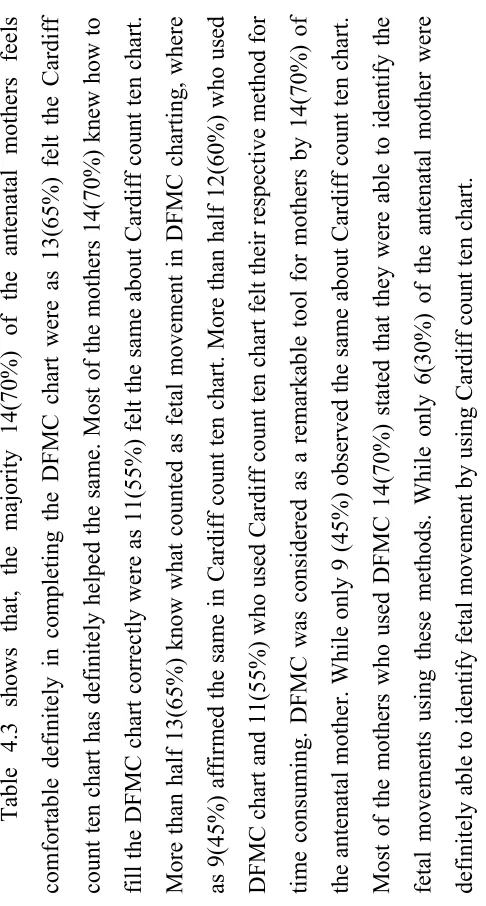
F reque nc y P er c e ntage (% ) F req ue nc y P er c e ntage (% ) Car diff Count T e n Ch art 14 70 6 3 0 DFMC Chart 16 80 4 2 0 According to table 4.4 the level of mothers perception, 14(70%) of mothe rs w er e having good perce ption and 6(30% ) of m o ther s showing very good perception in Cardiff count te n chart In D F MC cha rt , 16(80%) of the wom en in good perception and 4(20% )of
women showing very good perception. No one sh
ow
[image:52.612.393.602.271.662.2]T a ble 4.5: Fr equ e n c y an d per c e n tage d istrib ut ion of level of mat ernal compliance among mothers tow ar d
s Cardiff Count
T e n Chart n = 40 M a te rnal Compliance Non Comp li ance Compliance f% f % DFMC 63 0 1 4 7 0 Cardi ff c o unt te n c h art 94 5 1 1 5 5 According to table 4.5, a m ong the 40 antenatal mothers 6(30%) had non com pliance and 14(70%) ha d com pliance towar d s DFMC char t and in C ardiff count ten cha
rt non com
plianc
e is 9(
45%) and c
o
m
p
lia
nce is 11(55%).
F igur e 4.4: Bar diagram s h ow
ing the per
ce
n
tage dis
tribution of antenatal
mothers
according to th
e leve
l of maternal comp
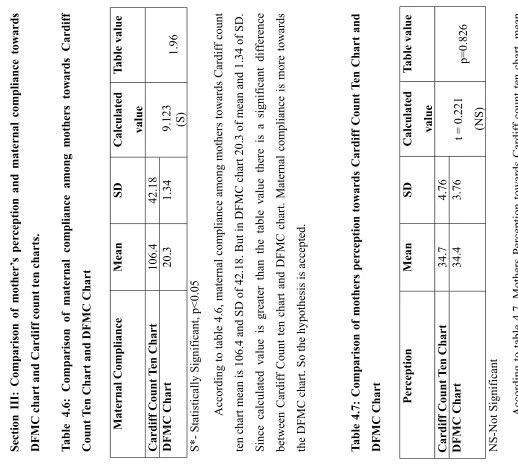
[image:53.612.290.531.258.678.2]Section III: Comparison of mother ’s per ception and mat e rnal compliance towards DFMC cha
rt and Cardiff count ten cha
rts. T a ble 4.6: C o m p arison of mater n a l comp li ance among mothers tow ards Ca rdiff Count T e
n Chart and DFMC Char
t Maternal Compliance Me an SD Calculated value